 |
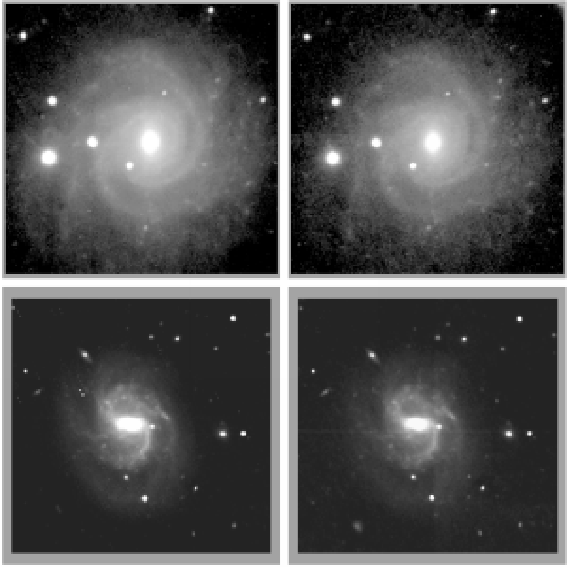
Figure 1:
Surface brightness images for NGC 3344, J and
|
| Open with DEXTER | |
In the text
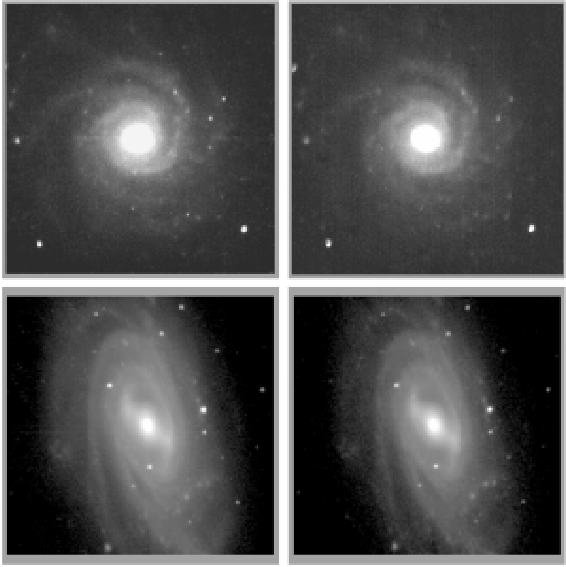 |
Figure 2:
Surface brightness images for NGC 3938, J and |
| Open with DEXTER | |
In the text
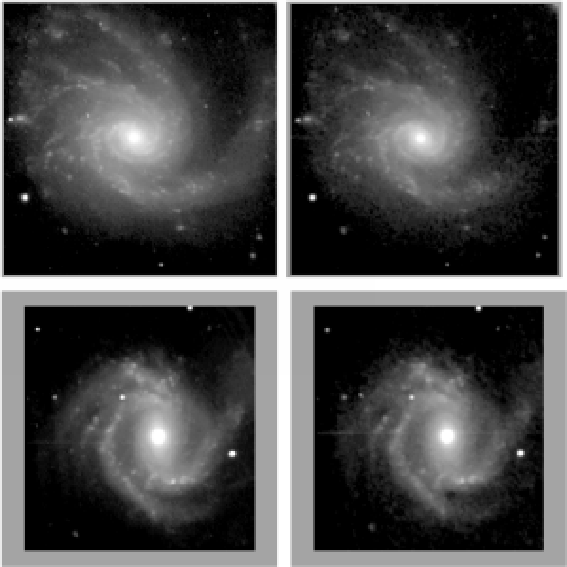 |
Figure 3:
Surface brightness images for NGC 4254, J and |
| Open with DEXTER | |
In the text
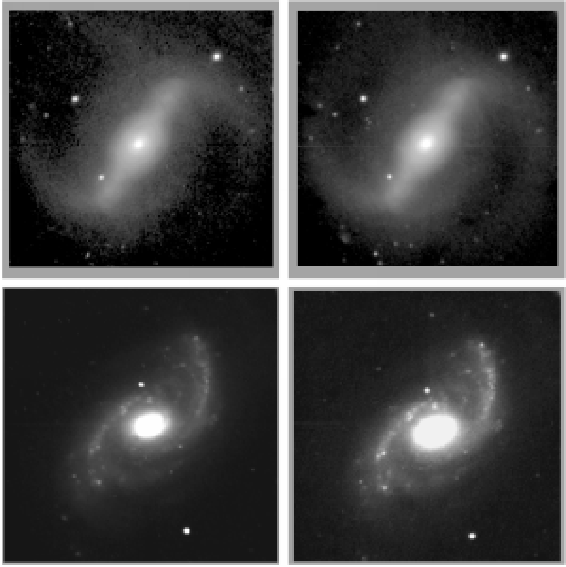 |
Figure 4:
Surface brightness images for NGC 4314, J and |
| Open with DEXTER | |
In the text
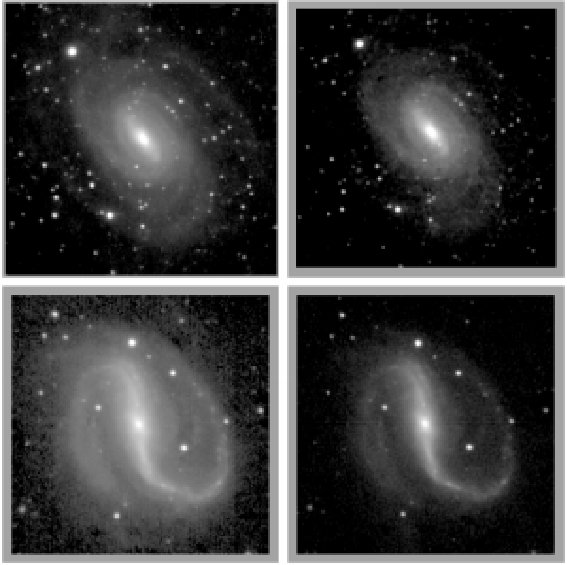 |
Figure 5:
Surface brightness images for NGC 6384, J and K (top panels, left to
right) and NGC 7479, J and |
| Open with DEXTER | |
In the text
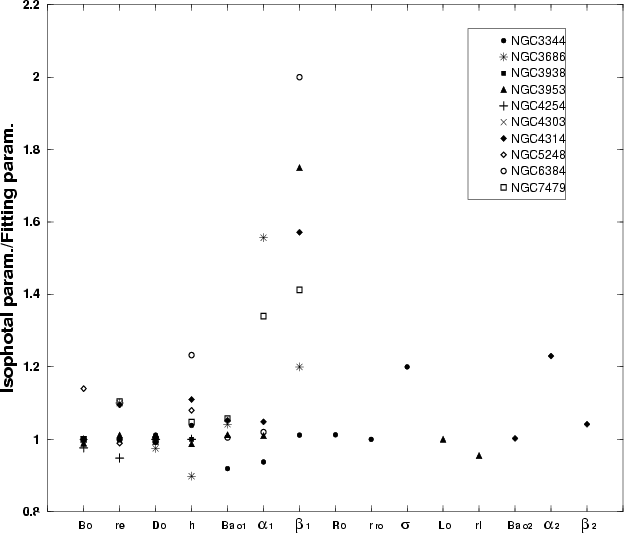 |
Figure 6: Correlation between the two sets of parameters for the brightness profiles: isophotal parameters (i) vs. fitting parameters (f). The graphic represents the ratio between the same parameters of each galaxy's surface brightness decomposition calculated using the two methods. See caption of Table 5 for an explanation of the parameter names in the x-axis. |
| Open with DEXTER | |
In the text