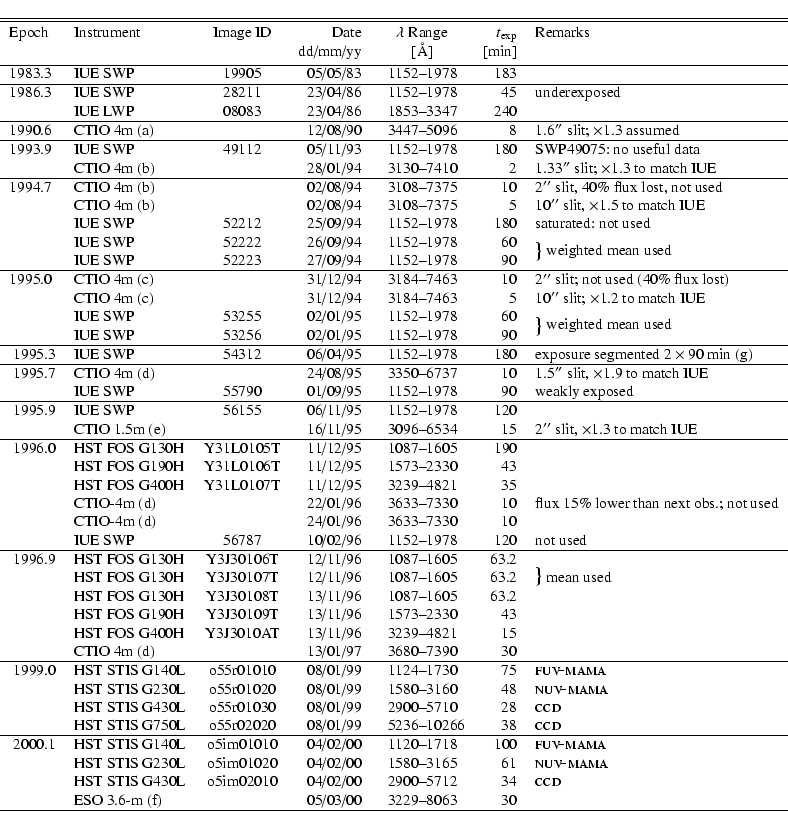
(b) CTIO 4m, RC spectrograph, grating KPGL2, Ret1 detector. (c) CTIO 4m, RC spectrograph, grating KPGL2, Ret2 detector. (d) CTIO 4m, RC spectrograph, grating KPGL3, Loreal3K-1 detector. (e) CTIO 1.5m, RC spectrograph, Loral1K-1 detector. (f) ESO 3.6-m with EFOSC/2.9. (g) INES and NEWSIPS IUE archives erroneously assume one single 90 min exposure and hence give wrongly calibrated data. |