Table 2:
Logarithm of the suitability index,
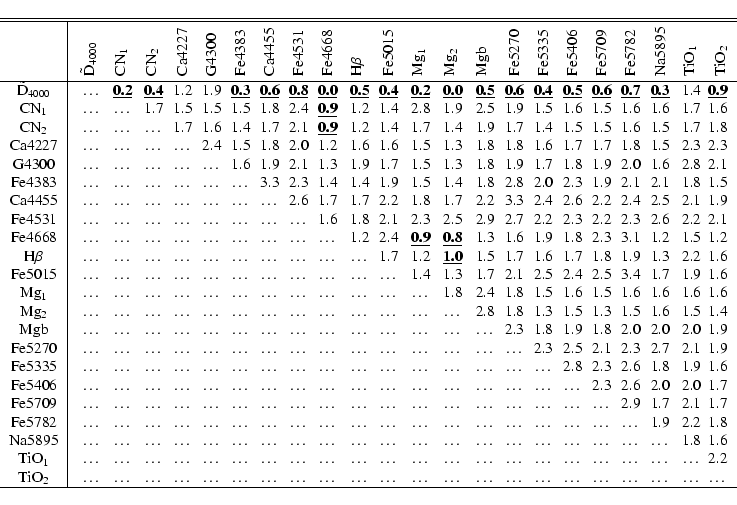
![$\log[\kappa]$](/articles/aa/full/2003/38/aa3590/img95.gif) ,
- see
Eq. (21) - for the study of the age-metallicity degeneracy,
computed for different combinations of common line-strength indices in the
optical range. For the generation of these numbers we have employed the
predictions of Bruzual & Charlot (2001) models, for single stellar populations
of 12 Gyr old and solar metallicity. Better diagrams are those for which
,
- see
Eq. (21) - for the study of the age-metallicity degeneracy,
computed for different combinations of common line-strength indices in the
optical range. For the generation of these numbers we have employed the
predictions of Bruzual & Charlot (2001) models, for single stellar populations
of 12 Gyr old and solar metallicity. Better diagrams are those for which
 are lower. In this sense, and as a guide for the eye, we have
boldfaced and underlined the 10% of these numbers with the lowest values.
are lower. In this sense, and as a guide for the eye, we have
boldfaced and underlined the 10% of these numbers with the lowest values.
|
Source LaTeX |
All tables |
In the text