 |
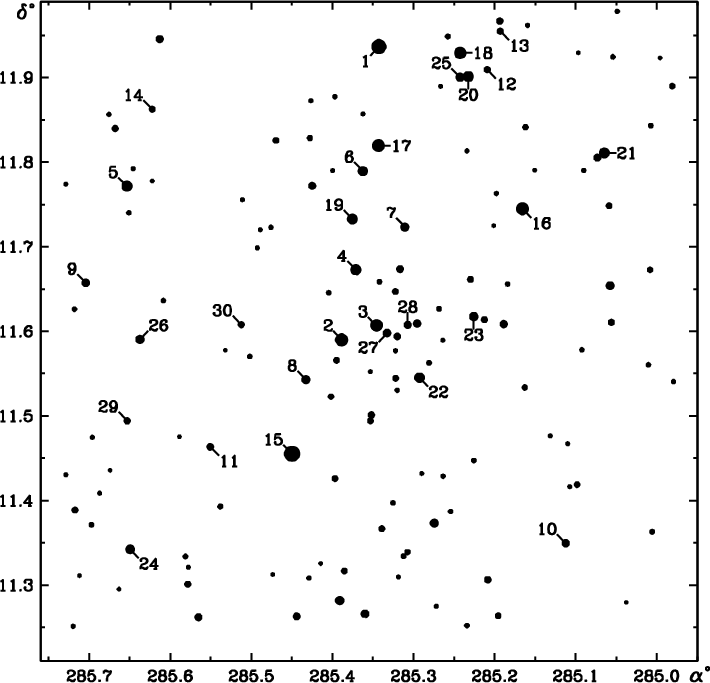
Figure 1: Finding chart of the stars brighter than V=13 in the field of NGC 6738. Dots scale with magnitude. Stars spectroscopically observed are numbered. |
| Open with DEXTER | |
In the text
![\begin{figure}
\par\includegraphics[width=17.66cm,clip]{Boeche_fig_2.ps}
\end{figure}](/articles/aa/full/2003/30/aa3891/img14.gif) |
Figure 2:
V, (B-V) diagrams ( top) and
(U-B), (B-V) diagrams ( bottom)
of the 44 |
| Open with DEXTER | |
In the text
![\begin{figure}
\par\resizebox{8.5cm}{!}{\includegraphics[clip]{Boeche_fig_3.ps}}
\end{figure}](/articles/aa/full/2003/30/aa3891/img24.gif) |
Figure 3:
Apparent luminosity function for the 44 |
| Open with DEXTER | |
In the text
![\begin{figure}
\par\resizebox{8.5cm}{!}{\includegraphics[clip]{Newfiles/Boeche_fig_4.eps}}
\end{figure}](/articles/aa/full/2003/30/aa3891/img25.gif) |
Figure 4: Intrinsic colour-magnitude diagram of observed stars, each of them labeled with its spectral classification. |
| Open with DEXTER | |
In the text
![\begin{figure}
\par\resizebox{8.5cm}{!}{\includegraphics[clip]{Boeche_fig_5.ps}}
\end{figure}](/articles/aa/full/2003/30/aa3891/img26.gif) |
Figure 5:
Vector point diagram (based on Tycho-2 data) of the stars
located inside a
|
| Open with DEXTER | |
In the text
![\begin{figure}
\par\includegraphics[clip]{Newfiles/Boeche_fig_6.eps}
\end{figure}](/articles/aa/full/2003/30/aa3891/img44.gif) |
Figure 6:
Histogram of the surface density of the stars in the
|
| Open with DEXTER | |
In the text
![\begin{figure}
\par\resizebox{8cm}{!}{\includegraphics[clip]{Boeche_fig_7.ps}}
\end{figure}](/articles/aa/full/2003/30/aa3891/img46.gif) |
Figure 7:
Surface stellar density from 44 |
| Open with DEXTER | |
In the text