 |
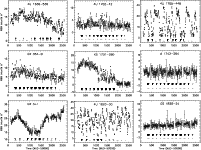
Figure 1: ASM/RXTE lightcurves of 9 of the most frequent X-ray bursters in the WFC database. Each bin is a one week average. Below the lightcurve the WFC observations on these sources are indicated with horizontal bars. The arrows just above the horizontal bars indicate the times of type I bursts. |
| Open with DEXTER | |
In the text
 |
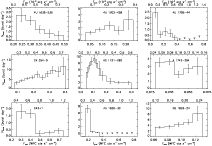
Figure 2:
Burst rate,
|
| Open with DEXTER | |
In the text
 |
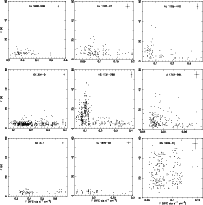
Figure 3:
The wait time, |
| Open with DEXTER | |
In the text
 |
Figure 4:
The exponential decay time, |
| Open with DEXTER | |
In the text
 |
Figure 5: A schematic diagram of the burst rate as a function of luminosity for the nine X-ray burst sources (see Fig. 2). Between the solid lines the region is indicated where the burst rate drops by a factor of 5. No type I bursts were observed at luminosities above the dashed line. The dotted-dashed line indicates the theoretical predicted transition from hydrogen-rich bursts to pure helium bursts. |
| Open with DEXTER | |
In the text