A&A 403, 877-887 (2003)
DOI: 10.1051/0004-6361:20030442
Spectroscopic study of blue compact galaxies
III. Empirical population synthesis
X. Kong 1,2 -
S. Charlot1,3 -
A. Weiss1 -
F. Z. Cheng2
1 - Max Planck Institute for Astrophysics, Karl-Schwarzschild-Str.
1, 85741 Garching, Germany
2 -
Center for Astrophysics, University of Science and Technology
of China, 230026, Hefei, PR China
3 -
Institut d'Astrophysique de Paris, CNRS, 98 bis boulevard
Arago, 75014 Paris, France
Received 8 October 2002 / Accepted 11 March 2003
Abstract
This is the third paper of a series dedicated to the study of the star
formation rates, star formation histories, metallicities and dust
contents of a sample of blue compact galaxies (BCGs). We constrain the
stellar contents of 73 blue compact galaxies by analyzing their continuum
spectra and the equivalent widths of strong stellar absorption features
using a technique of empirical population synthesis based on a library
of observed star-cluster spectra. Our results indicate that blue
compact galaxies are typically age-composite stellar systems; in
addition to young stars, intermediate-age and old stars contribute
significantly to the 5870 Å continuum emission of most galaxies in
our sample. The stellar populations of blue compact galaxies also span
a variety of metallicities. The ongoing episodes of star formation started
typically less than a billion years ago. Some galaxies may be undergoing
their first global episode of star formation, while for most galaxies in
our sample, older stars are found to contribute up to half the optical
emission. Our results suggest that BCGs are primarily old galaxies with
discontinuous star formation histories.
These results are consistent with the results from
deep imaging observations of the color-magnitude diagrams of a few
nearby BCGs using HST and large ground-based telescopes.
The good quality of our population synthesis fits of BCG spectra allow
us to estimate the contamination of the H ,
H
,
H ,
H
,
H and H
and H Balmer
emission lines by stellar absorption. The absorption equivalent widths
measured in the synthetic spectra range from typically 1.5 Å for H,
to 2-5 Å for H,
H,
and H.
The implied accurate measurements of
emission-line intensities will be used in a later study to constrain
the star formation rates and gas-phase chemical element abundances of
blue compact galaxies.
Balmer
emission lines by stellar absorption. The absorption equivalent widths
measured in the synthetic spectra range from typically 1.5 Å for H,
to 2-5 Å for H,
H,
and H.
The implied accurate measurements of
emission-line intensities will be used in a later study to constrain
the star formation rates and gas-phase chemical element abundances of
blue compact galaxies.
Key words:
galaxies: dwarf - galaxies: evolution - galaxies: stellar content
- galaxies: star clusters
The stellar populations of galaxies carry a record of their star
forming and chemical histories, from the epoch of formation to the
present. The global properties of galaxies are determined by the
nature and evolution of their stellar components. Their studies thus
provide a powerful tool to explore the physics of galaxy formation
and evolution (Kong 2000; Cid Fernandes etal. 2001).
For local group galaxies and some very nearby galaxies that can be
resolved into individual stars with HST and 10-m class telescopes,
the stellar population properties may be studied by means of direct
observations. However, for objects at larger distances, individual
stars (except for some giants) are unresolved, even with 10-m class
telescopes. The integrated light of such galaxies is expected to
contain valuable information about their physical properties.
The most common approach used to interpret the integrated
spectrophotometric properties of galaxies is stellar population
synthesis. There are two main types of population synthesis studies:
evolutionary population synthesis and empirical population synthesis
(EPS hereafter). Both types of studies require a complete library
of input (observed or model atmosphere) spectra of stars or star
clusters (e.g., Fritze-v. Alvensleben 2000).
In the evolutionary population synthesis approach, pioneered by
Tinsley (1967), the main adjustable parameters are the stellar initial
mass function (IMF), the star formation history and, in some cases, the
rate of chemical enrichment. Assumptions about the time evolution of
these parameters allow one to compute the age-dependent distribution of
stars in the Hertzsprung-Russell diagram, from which the integrated
spectral evolution of the stellar population can be obtained. In recent
years, a number of groups have developed evolutionary population
synthesis models, which allow one to investigate the physical
properties of observed galaxies (Bruzual 1983; Arimoto & Yoshii
1987; Buzzoni 1989; Bressan et al. 1994; Worthey 1994;
Weiss et al. 1995; Fioc & Rocca-Volmerange 1997;
Mas-Hesse & Kunth 1999; Moeller et al. 1999;
Leitherer et al. 1999; Bruzual & Charlot 1993, 2003). Such models
are convenient tools for studying the spectral evolution of
galaxies, as they allow one to predict the past and future spectral
appearance of galaxies observed at any given time. However, modern
evolutionary population synthesis models still suffer from serious
limitations (e.g., Charlot etal. 1996).
The empirical population synthesis approach, also known as "stellar
population synthesis with a data base'', was introduced by Faber
(1972). In this technique, one reproduces the integrated spectrum of a
galaxy with a linear combination of spectra of individual stars or star
clusters of various types taken from a comprehensive library. The
empirical population synthesis approach has been employed successfully
by several authors to interpret observed galaxy spectra (Faber 1972;
O'Connell 1976; Pickles 1985; Bica 1988; Pelat 1998; Boisson et al.
2000; Cid Fernandes etal. 2001). An appealing property of this approach
is that the results do not hinge on a priori assumptions about stellar
evolution, the histories of star formation and chemical enrichment,
nor - in the case of a library of individual stellar spectra - the IMF.
In return, it does not allow one to predict the past and future
spectral appearance of galaxies. In 1996, a workshop devoted to the
comparison of various evolutionary population synthesis and empirical
population synthesis codes showed broad agreement in general and a
number of discrepancies in detail (Leitherer et al. 1996).
In this paper, we use the empirical population synthesis approach
to constrain the stellar content and star formation histories of a
sample of 73 blue compact galaxies (BCGs). Our approach builds on
earlier studies by Bica (1988) and Cid Fernandes etal. (2001), and we
adopt the library of observed star-cluster spectra assembled by Bica
& Alloin (1986; see also Bica 1988). Our primary goal is to illustrate
the constraints that can obtained on the ages and metallicities of the
stellar populations of BCGs that cannot be resolved into individual
stars, on the basis of their integrated spectra. In a forthcoming study,
we will use the results of this analysis to model the spectral
evolution of BCGs using evolutionary population synthesis models.
Another goal of the present work is to refine previous measurements of
the Balmer emission-line fluxes of the BCGs in our sample, through an
accurate modeling of the underlying stellar absorption spectrum. This
issue is critical to spectroscopic analyses of BCGs (e.g.,
Thuan & Izotov 2000; Olive & Skillman 2001).
The paper is organized as follows. In Sect. 2, we briefly review the
principle of the empirical population synthesis approach. We describe
the properties of the BCG spectral sample in Sect. 3. In Sect. 4,
we estimate the stellar components in BCGs by fitting the observed
equivalent widths and continuum colors with the empirical population
synthesis approach. In Sect. 5 we discuss the age-metallicity
degeneracy and the possible application of our results. Section 6
summarizes our main results.
In a recent paper, Cid Fernandes etal. (2001) revisit the classical
problem of synthesizing the spectral properties of a galaxy by using
a "base'' of star-cluster spectra, approaching it from a probabilistic
perspective. Their work improves over previous EPS studies at both
the formal and computational levels, and it represents an efficient
tool for probing the stellar population mixture of galaxies. To provide
a quantitative description of the stellar components in the nuclear
regions of BCGs, we will apply this EPS method to our BCG sample. It is
based on spectral-group templates built from star clusters of different
ages and metallicities, and on Bayes probabilistic theorem and the
EPS Metropolis algorithm. In this section, we first describe the star
cluster base. We then briefly review Bayes probabilistic formulation
and the EPS Metropolis algorithm.
Empirical population synthesis by with a data base (a base of
 spectra of stars or star clusters) is a classical tool
designed to study the stellar population of galaxies. The recent EPS
algorithm of Cid Fernandes etal. (2001; see also Bica 1988) relies on a
data base of star-cluster spectra rather than on one of individual
stellar spectra. The star cluster base used by Cid Fernandes etal.
(2001) was introduced by Schmidt etal. (1991). It consists of 12
population groups, spanning five age bins - 10 Gyr (representing
globular cluster-like populations), 1 Gyr, 100 Myr, 10 Myr and
"HII''-type (corresponding to current star formation) - and four
metallicities - 0.01, 0.1, 1 and 4 times
spectra of stars or star clusters) is a classical tool
designed to study the stellar population of galaxies. The recent EPS
algorithm of Cid Fernandes etal. (2001; see also Bica 1988) relies on a
data base of star-cluster spectra rather than on one of individual
stellar spectra. The star cluster base used by Cid Fernandes etal.
(2001) was introduced by Schmidt etal. (1991). It consists of 12
population groups, spanning five age bins - 10 Gyr (representing
globular cluster-like populations), 1 Gyr, 100 Myr, 10 Myr and
"HII''-type (corresponding to current star formation) - and four
metallicities - 0.01, 0.1, 1 and 4 times  (see Table 1 of
Cid Fernandes etal. 2001). All metallicities are not available for
clusters of all ages. In particular, spectra of star clusters younger
than 1 Gyr are only available for the metallicities
and
4 .
Since blue compact galaxies are expected to have
predominantly low abundances, the base of star-cluster spectra used by
Cid Fernandes etal. (2001) is not optimal for our analysis.
(see Table 1 of
Cid Fernandes etal. 2001). All metallicities are not available for
clusters of all ages. In particular, spectra of star clusters younger
than 1 Gyr are only available for the metallicities
and
4 .
Since blue compact galaxies are expected to have
predominantly low abundances, the base of star-cluster spectra used by
Cid Fernandes etal. (2001) is not optimal for our analysis.
The base of 35 star-cluster spectra used by Bica (1988; see also Bica
& Alloin 1986) is more appropriate for our purpose, as it contains
spectra of young star clusters with metallicities down to
 (see Table 1). Each component, corresponding to
a specific age and metallicity, is characterized by a set of six
metallic features (Ca II K
(see Table 1). Each component, corresponding to
a specific age and metallicity, is characterized by a set of six
metallic features (Ca II K  3933, CN 4200,
G band 4301, Mg I+Mg H 5175, Ca II 8543,
Ca II 8662) and three Balmer lines (H,
H,
and H), as
well as
3933, CN 4200,
G band 4301, Mg I+Mg H 5175, Ca II 8543,
Ca II 8662) and three Balmer lines (H,
H,
and H), as
well as
 continuum fluxes at selected pivot wavelengths
(3290, 3660, 4020, 4510, 6630, 7520 and 8700 Å), which are normalized
at 5870 Å. The library contains an HII region component
corresponding to current star formation. This is represented by a pure
continuum based on the spectrum of 30 Dor, which is used at all
metallicities (see the recent description by Schmitt etal. 1996).
continuum fluxes at selected pivot wavelengths
(3290, 3660, 4020, 4510, 6630, 7520 and 8700 Å), which are normalized
at 5870 Å. The library contains an HII region component
corresponding to current star formation. This is represented by a pure
continuum based on the spectrum of 30 Dor, which is used at all
metallicities (see the recent description by Schmitt etal. 1996).
Table 1 lists the ages and metallicities of each of the 35 components
of the Bica (1988) base of star-cluster spectra. The top line lists
the ages of the components, while the rightmost column lists the
metallicities, with [
![$Z/Z_\odot] = \log(Z/Z_\odot$](/articles/aa/full/2003/21/aa3164/img26.gif) ).
).
Table 1:
Ages (in units of yr), metallicities and numbering convention
for the star clusters in the base.
| HII |
E7 |
5E7 |
E8 |
5E8 |
E9 |
5E9 |
E10 |
[
 ] ] |
| 35 |
31 |
27 |
23 |
19 |
14 |
8 |
1 |
0.6 |
| 35 |
32 |
28 |
24 |
20 |
15 |
9 |
2 |
0.3 |
| 35 |
33 |
29 |
25 |
21 |
16 |
10 |
3 |
0.0 |
| 35 |
34 |
30 |
26 |
22 |
17 |
11 |
4 |
-0.5 |
| |
|
|
|
|
18 |
12 |
5 |
-1.0 |
| |
|
|
|
|
|
13 |
6 |
-1.5 |
| |
|
|
|
|
|
|
7 |
-2.0 |
The principle of EPS is to find the linear combination of a base of
spectra (
star clusters) that best reproduces a given set
of measured observables, such as the equivalent widths Wj of  conspicuous absorption features and the
  continuum fluxes Ck in
an observed galaxy spectrum. Different synthesis algorithms have been
developed to select the optimal combination of base spectra in the most
efficient way. We use here the algorithm described by Cid Fernandes
etal. (2001). Since this is relatively new, we briefly recall below its
probabilistic formulation and the main features of the algorithm.
continuum fluxes Ck in
an observed galaxy spectrum. Different synthesis algorithms have been
developed to select the optimal combination of base spectra in the most
efficient way. We use here the algorithm described by Cid Fernandes
etal. (2001). Since this is relatively new, we briefly recall below its
probabilistic formulation and the main features of the algorithm.
The data  we wish to model is composed of a set of
 observables, as described above. The measurement
errors in these observables, collectively denoted by
observables, as described above. The measurement
errors in these observables, collectively denoted by
 ,
are
known from the observations. Given these, the problem of EPS is to
estimate the population vector
,
are
known from the observations. Given these, the problem of EPS is to
estimate the population vector  (Xi,
(Xi,
 )
and the extinction AV that "best'' represents the data according to
a well defined probabilistic model, where Xi denotes the
fractional contribution of the ith base element to the total flux
at the reference wavelength. The probability of a solution
)
and the extinction AV that "best'' represents the data according to
a well defined probabilistic model, where Xi denotes the
fractional contribution of the ith base element to the total flux
at the reference wavelength. The probability of a solution
 given the data
and the errors
,
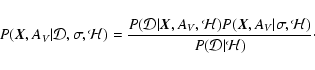
is given by Bayes theorem (Smith & Grandy 1985):
given the data
and the errors
,
is given by Bayes theorem (Smith & Grandy 1985):
 |
(1) |
 summarizes the set of assumptions on which the
inference is to be made,
summarizes the set of assumptions on which the
inference is to be made,
 is the
likelihood,
is the
likelihood,
 is the normalizing constant,
 is the joint a priori probability
distribution of
and AV.
is the joint a priori probability
distribution of
and AV.
For a non-informative prior, the posterior probability
 is simply
proportional to the likelihood:
is simply
proportional to the likelihood:
 |
(2) |
with  defined as half the value of
  :
:
Here
 and
and
 are the observed features and
 and
and
 are the synthetic features.
This expression contains the full solution of the EPS problem, as
embedded in it is not only the most probable model parameters but
also their full probability distributions. In order to compute the
individual posterior probabilities for each parameter, we use an
efficient parameter-space exploration method, known as the Metropolis
algorithm (Metropolis etal. 1953). The code preferentially visits
regions of large probability, starting from an arbitrary point of the
parameter space. At each iteration s, we
pick one of the
 variables at random and change it by
a uniform deviate ranging from
variables at random and change it by
a uniform deviate ranging from  to
to  ,
producing a new state s+1. Moves to states of smaller
are always accepted, whilst changes to less likely states are
accepted with probability exp[
,
producing a new state s+1. Moves to states of smaller
are always accepted, whilst changes to less likely states are
accepted with probability exp[
 ], thus
avoiding trapping onto local minima. Moves towards non-physical
regions (Xi < 0 or > 1, AV <0) were truncated. In this way,
the probability distributions for the Xi is given, and then the
whole set (Xi,
)
is renormalized to unit sum.
], thus
avoiding trapping onto local minima. Moves towards non-physical
regions (Xi < 0 or > 1, AV <0) were truncated. In this way,
the probability distributions for the Xi is given, and then the
whole set (Xi,
)
is renormalized to unit sum.
The main output of the EPS approach is the population
vector ,
whose
components carry the
fractional contributions of each base element to the observed flux
at the normalization wavelength 5870 Å. This vector corresponds
to the mean solution found from a 108 steps
likelihood-guided Metropolis walk through the parameter space.
Owing to intrinsic errors in the observable parameters and some
other uncertainties, more than one acceptable solution can
represent the observation data. The final mean solution is
given by the weighted (e
 )
average of all solutions
within the observational errors. This mean solution is
more reliable than the single optimal solution, and it provides a
more representative result to the population synthesis problem.
)
average of all solutions
within the observational errors. This mean solution is
more reliable than the single optimal solution, and it provides a
more representative result to the population synthesis problem.
Our sample is drawn from the atlas of optical spectra of 97 blue
compact galaxies by Kong & Cheng (2002a). The spectra were acquired
with the 2.16 m telescope at the XingLong Station
of the Beijing Astronomical Observatory (BAO) in China. A 300 line mm-1 grating was used to achieve coverage in the wavelength
region from 3580 to 7600 Å with the dispersion is 4.8 Å pixel-1. The slit width was adjusted in between
2
 and 3
each night, depending on
seeing conditions. A detailed decription of the
observations, the sample selection, the data reduction and calibration
and the error analysis can be found in the first paper of this
series (Kong & Cheng 2002a). The average signal-to-noise ratio of the
spectra is
and 3
each night, depending on
seeing conditions. A detailed decription of the
observations, the sample selection, the data reduction and calibration
and the error analysis can be found in the first paper of this
series (Kong & Cheng 2002a). The average signal-to-noise ratio of the
spectra is  51 per pixel. The spectrophotometry is accurate to
better than 10% over small wavelength regions and to about 15% or
better on large scales.
51 per pixel. The spectrophotometry is accurate to
better than 10% over small wavelength regions and to about 15% or
better on large scales.
Kong etal. (2002b) measured several quantities in the spectra of
the 97 BCGs in this sample, including the fluxes and equivalent widths
of emission lines, continuum fluxes, the 4000 Å break and the
equivalent widths of several absorption features. The galaxies were
ordered into three classes based on their emssion-line properties: 13
were classified as "non-emission-line galaxies'' (non-ELG), 10 as
"low-luminosity active galactic nuclei'' (AGN) and 74 as "star-forming
galaxies'' (SFG). We are primarily interested here in the star formation
rates, metallicities and star formation histories of BCGs. Therefore,
we focus on the subsample of 74 star-forming galaxies (SFGs). We
exclude I Zw 207 from this subsample because the absence of a blue
spectrum prevents the measurements of most absorption features in
this galaxy. Our final sample therefore consists of 73 star-forming,
blue compact galaxies.
We use the EPS approach of Cid Fernandes etal. (2001; Sect. 2.2
above) and the library of star-cluster spectra of Bica (1988; Sect. 2.1 above) to interpret the spectra of the 73 star-forming BCGs in our
sample.
We use the following observable quantities to constrain the stellar
components in the nuclear regions of BCGs: the observed absorption
equivalent widths (
;
 Å) of Ca II K 3933, H 4102,
CN 4200, G band 4301, H 4340, and
Mg I+Mg H 5176 and the continuum fluxes (normalized at 5870 Å)
at 3660, 4020, 4510, 6630, and 7520 Å (in practice, we use the H
and H
absorption equivalent widths only for galaxies with negligible
emission at these wavelengths, representing roughly half of the sample).
The absorption equivalent widths and continuum fluxes were measured
by Kong etal. (2002b) according to the procedure outlined in Bica
(1988) and Cid Fernandes etal. (2001; see Kong etal. 2002b for detail).
In some spectra, the continuum flux at 5870 Å may be buried
underneath the He I 5876 Å emission line. In such cases,
adjacent wavelength regions were used to estimate the continuum level.
The resulting absorption equivalent widths are listed in Table 6 of Kong
etal. (2002b), and the continuum fluxes in Table 4 of Kong etal.
(2002b). The errors in the absorption equivalent widths and
continuum fluxes must also be included as input parameters. These are
set to 10% for those absorption bands with
Å) of Ca II K 3933, H 4102,
CN 4200, G band 4301, H 4340, and
Mg I+Mg H 5176 and the continuum fluxes (normalized at 5870 Å)
at 3660, 4020, 4510, 6630, and 7520 Å (in practice, we use the H
and H
absorption equivalent widths only for galaxies with negligible
emission at these wavelengths, representing roughly half of the sample).
The absorption equivalent widths and continuum fluxes were measured
by Kong etal. (2002b) according to the procedure outlined in Bica
(1988) and Cid Fernandes etal. (2001; see Kong etal. 2002b for detail).
In some spectra, the continuum flux at 5870 Å may be buried
underneath the He I 5876 Å emission line. In such cases,
adjacent wavelength regions were used to estimate the continuum level.
The resulting absorption equivalent widths are listed in Table 6 of Kong
etal. (2002b), and the continuum fluxes in Table 4 of Kong etal.
(2002b). The errors in the absorption equivalent widths and
continuum fluxes must also be included as input parameters. These are
set to 10% for those absorption bands with
 Å, 20% for those absorption bands with
 Å, and 10% for continuum colors. These errors are consistent with the quality
of the spectra (Kong & Cheng 2002a).
Å, and 10% for continuum colors. These errors are consistent with the quality
of the spectra (Kong & Cheng 2002a).
To select the linear combination of the base cluster spectra that
best represents an observed galaxy spectrum, we set the EPS algorithm
to sample
 states of the whole age versus []
parameter space, with the "visitation parameter''
states of the whole age versus []
parameter space, with the "visitation parameter''  set to 0.05
for the Xi's (
set to 0.05
for the Xi's (
 )
and 0.01 for AV. As
described in Sect. 2.2, we obtain as output a 35-dimension,
mean population vector
containing the expected values of the
fractional contribution of each component to the total light at the
normalization wavelength 5870 and AV. Table 2 lists, as
examples, the results for two galaxies in our sample.
)
and 0.01 for AV. As
described in Sect. 2.2, we obtain as output a 35-dimension,
mean population vector
containing the expected values of the
fractional contribution of each component to the total light at the
normalization wavelength 5870 and AV. Table 2 lists, as
examples, the results for two galaxies in our sample.
Table 2:
Empirical population synthesis results of percentage contributions
from stars of all ages and metallicities to
 ,
for two sample
galaxies. The "evolutionary paths'' favored by the analysis are highlighted
(see text).
,
for two sample
galaxies. The "evolutionary paths'' favored by the analysis are highlighted
(see text).
| a) Mrk 385 Age (yr) |
[] |
|
b) I Zw 97 Age (yr) |
[] |
| HII |
E7 |
5E7 |
E8 |
5E8 |
E9 |
5E9 |
E10 |
|
|
HII |
E7 |
5E7 |
E8 |
5E8 |
E9 |
5E9 |
E10 |
| |
2.0 |
1.8 |
2.1 |
.3 |
.2 |
.2 |
.5 |
0.6 |
|
|
.3 |
1.6 |
2.6 |
1.7 |
.3 |
.2 |
.1 |
0.6 |
| |
2.1 |
2.3 |
2.9 |
.5 |
.3 |
.3 |
.6 |
0.3 |
|
|
.4 |
1.9 |
3.3 |
3.0 |
.6 |
.3 |
.1 |
0.3 |
| |
1.5 |
3.3 |
3.9 |
.8 |
.5 |
.5 |
.8 |
0.0 |
|
8.0 |
.8 |
5.9 |
9.8 |
5.9 |
1.7 |
.6 |
.2 |
0.0 |
| 8.8 |
4.0 |
6.0 |
6.9 |
11.7 |
1.7 |
1.5 |
1.8 |
-0.5 |
|
|
.5 |
1.9 |
3.3 |
1.8 |
2.8 |
1.2 |
.7 |
-0.5 |
| |
|
|
|
|
4.5 |
3.4 |
3.4 |
-1.0 |
|
|
|
|
|
|
4.7 |
1.9 |
1.5 |
-1.0 |
| |
|
|
|
|
|
5.5 |
5.4 |
-1.5 |
|
|
|
|
|
|
|
6.9 |
7.0 |
-1.5 |
| |
|
|
|
|
|
|
8.1 |
-2.0 |
|
|
|
|
|
|
|
|
16.7 |
-2.0 |
The results for the 73 BCGs in our sample indicate that, in all cases,
a single metallicity is favored for all four youngest stellar
components (corresponding to ages less than
 ).
The metallicity of young stars is [
).
The metallicity of young stars is [
![$Z/Z_\odot ]=-0.5$](/articles/aa/full/2003/21/aa3164/img5.gif) for 55 galaxies
in the sample and [
for 55 galaxies
in the sample and [
![$Z/Z_\odot ]= 0.0$](/articles/aa/full/2003/21/aa3164/img6.gif) for the remaining 18 galaxies.
For stars older than
,
the dominant metallicity
anticorrelates with age, in the sense that the metallicity of the
stellar component contributing most to the integrated light increases
with decreasing age from
for the remaining 18 galaxies.
For stars older than
,
the dominant metallicity
anticorrelates with age, in the sense that the metallicity of the
stellar component contributing most to the integrated light increases
with decreasing age from
 to
to
 (see the examples in Table 2). We note that the dominant
metallicity of stars older than
is always
found to be less than or equal to that of younger stars. It is not
surprising that a dominant metallicity be favored for stars of any
given age in a galaxy. The nuclei of BCGs correspond to small volumes,
where star-forming gas is expected to be chemically homogeneous at any
time. It is worth noting that our results differ from those of previous
EPS analyses, such as those performed by Bica (1988) and Schmitt etal.
(1996), in that we determine the evolutionary paths of galaxies in the
age-metallicity plane from a full maximum-likelihood analysis. In most
previous studies, the star-formation and chemical-enrichment histories
of galaxies were selected from a limited number of a priori
evolutionary paths.
(see the examples in Table 2). We note that the dominant
metallicity of stars older than
is always
found to be less than or equal to that of younger stars. It is not
surprising that a dominant metallicity be favored for stars of any
given age in a galaxy. The nuclei of BCGs correspond to small volumes,
where star-forming gas is expected to be chemically homogeneous at any
time. It is worth noting that our results differ from those of previous
EPS analyses, such as those performed by Bica (1988) and Schmitt etal.
(1996), in that we determine the evolutionary paths of galaxies in the
age-metallicity plane from a full maximum-likelihood analysis. In most
previous studies, the star-formation and chemical-enrichment histories
of galaxies were selected from a limited number of a priori
evolutionary paths.
It is of interest to exploit these results and compute simple
"evolutionary paths'' for the galaxies in our sample. As mentioned
above, for each galaxy, the EPS analysis favors a dominant
metallicity for stars of any given age, such that young stars
have typically a higher metallicity than older stars. At any age,
however, stars of any metallicity are assigned non-zero weights
by the EPS algorithm. To represent the star-formation and
metal-enrichment histories of BCGs in a schematic way, we adopt
for each galaxy the path favored by the EPS analysis in the
age-metallicity plane. For consistency, we readjust the various
proportions of stars of different ages along this path by rerunning the
EPS algorithm after setting the weights of all stars outside the path
to zero. Since, for a given galaxy, the age-metallicity space to be
explored then reduces to a single dimension, we refine the analysis by
lowering the "visitation parameter''
to 0.005 (
 )
while still sampling
Ns = 108 states (we keep
)
while still sampling
Ns = 108 states (we keep
 for AV).
The results of our analysis are summarized in Tables 3 and 4 for the
galaxies with asymptotic (young-star) metallicities [
and 0.0, respectively. For each galaxy, we report the percentage contributions
from each age-metallicity component to the integrated flux at
 Å. The first and second lines of each table indicate the
metallicities and the ages of the different stellar components. For
reference, the third line indicates the indices of the stellar
components in the cluster data base of Table 1. For each galaxy, we also list
the inferred V-band attenuation AV and the absorption equivalent widths
of H,
H,
H
and H,
as measured from the synthetic stellar population
spectra. Figure 1 shows the equivalent widths (
Å. The first and second lines of each table indicate the
metallicities and the ages of the different stellar components. For
reference, the third line indicates the indices of the stellar
components in the cluster data base of Table 1. For each galaxy, we also list
the inferred V-band attenuation AV and the absorption equivalent widths
of H,
H,
H
and H,
as measured from the synthetic stellar population
spectra. Figure 1 shows the equivalent widths (
 )
of all the stellar absorption features used to constrain the fits in the
model spectra against those in the observed spectra (
,
for
Å), for all 73 BCGs in our sample. Clearly, the feature
strengths in the model spectra are in very good agreement with those in the
observed spectra.
)
of all the stellar absorption features used to constrain the fits in the
model spectra against those in the observed spectra (
,
for
Å), for all 73 BCGs in our sample. Clearly, the feature
strengths in the model spectra are in very good agreement with those in the
observed spectra.
A first noticeable result in Tables 3 and 4 is that all BCGs show an
underlying component of stars older than
.
The
fractional contribution of this component to the total light at
5870 Å exceeds 15% for most galaxies, except for some
low-luminosity BCGs, such as I Zw 18, II Zw 40, which have
very strong emission line spectra, and have a marginally detected old
component. We note that the spectra used here sample the inner
regions of the galaxies. The contribution from old and intermediate-age
stars to the integrated light could be even larger in the extended
(off-nuclear) regions of galaxies. The presence of significant populations
of old and intermediate-age stars indicates that blue compact galaxies have
experienced substantial episodes of star formation in the past. This
supports the results from deep imaging observations of the color-magnitude
diagrams of a few nearby BCGs that these are old galaxies (see Sect. 5.2 below). As expected, stars younger than
tend to
dominate the emission at 5870 Å, consistent with the observational character
of BCGs, i.e. blue colors and strong emission lines.
![\begin{figure}
\par\includegraphics*[angle=-90,width=8.8cm,clip]{aa3164-f1.ps}
\end{figure}](/articles/aa/full/2003/21/aa3164/Timg71.gif) |
Figure 1:
Synthetic equivalent width
 against observed equivalent
width
against observed equivalent
width
 for all
Å absorption features
used to constrain the star-formation and chemical-enrichment histories
of 73 BCGs (see Tables 3 and 4). The dash line is the identity line.
Different symbols denote different absorption features, as indicated.
for all
Å absorption features
used to constrain the star-formation and chemical-enrichment histories
of 73 BCGs (see Tables 3 and 4). The dash line is the identity line.
Different symbols denote different absorption features, as indicated. |
Another interesting result of Tables 3 and 4 is that blue compact galaxies
present a variety of star formation histories. In II Zw 67 and I Zw 56, for
example, stars with age 10 Gyr contribute as much as 20 per cent of the flux
at 5870 Å. In contrast, in III Zw 43 and Mrk 57, old stars do not
contribute significantly to the flux at 5870 Å, that is produced
in half by intermediate-age stars. The galaxies I Zw 18 and II Zw 40
differ from these cases in that their emission at 5870 Å is
accounted almost entirely by young stars. The star formation history of BCGs,
therefore, appears to vary significantly on a case by case basis.
For simplicity, in what follows we arrange stars into four age bins:
old stars with age
(proportion
 ); intermediate-age stars with ages between
and
); intermediate-age stars with ages between
and
 (proportion
 ); young stars with
ages between
); young stars with
ages between
 and
(proportion
and
(proportion
 ); and newly-born stars in H II regions (proportion
 ). Hence
+
+
+
= 1. Figure 2 illustrates graphically the
variety of star formation histories reported in Tables 3 and 4 for the 73
galaxies in our sample. In each panel, the horizontal axis represents
,
,
,
and
(from left to right), while the vertical axis shows
the percentage contributions at 5870 Å of stars in these four age bins.
Stars younger than
dominate the emission in most BCGs, but the galaxies also contain substantial fractions of older stars.
). Hence
+
+
+
= 1. Figure 2 illustrates graphically the
variety of star formation histories reported in Tables 3 and 4 for the 73
galaxies in our sample. In each panel, the horizontal axis represents
,
,
,
and
(from left to right), while the vertical axis shows
the percentage contributions at 5870 Å of stars in these four age bins.
Stars younger than
dominate the emission in most BCGs, but the galaxies also contain substantial fractions of older stars.
![\begin{figure}
\par\includegraphics[angle=-90,width=17.2cm,clip]{aa3164-f2.ps}
\end{figure}](/articles/aa/full/2003/21/aa3164/Timg75.gif) |
Figure 2:
Star formation histories of 73 BCGs. In each panel, the numbers on the
horizontal axis represent the stellar age groups, as indicated in the
bottom right of the figure. The vertical axis shows the percentage
contributions of stars in the various age groups to the integrated
flux at 5870 Å. |
Figure 3 illustrates the results of the spectral fits obtained
for four galaxies in our sample. Also shown are the contributions to the
integrated spectrum by stars in the four age groups defined in Sect. 4.3
above (the relative contributions by the different stellar components to the
total flux at 5870 Å are those listed in Tables 3 and 4 for these
galaxies). Figure 3 shows that the synthetic spectra (SYN)
inferred from our population synthesis analysis provide good fits to the
observed spectra of BCGs (OBS). The absorption wings of H,
H
and
H
in the observed spectra are also well reproduced by the models (the
synthetic spectra do not include nebular emission lines). We find that, for
some strong star-forming galaxies, the synthetic spectra do not provide very
good fits to the observed continuum spectra at wavelengths between 4300 and
4800 Å. This may arise from the presence of Wolf-Rayet (WR) features, such
as N III features at 4511-4535, [N II]4565,
[N V]4605, 4620, and He II4686, in the observed spectra. We
plan to investigate this small discrepancy using evolutionary population
synthesis models in a future paper.
![\begin{figure}
\par\includegraphics[angle=-90,width=18cm,clip]{aa3164-f3.ps}\end{figure}](/articles/aa/full/2003/21/aa3164/Timg77.gif) |
Figure 3:
Comparison of synthetic spectra (red-solid lines) to the observed spectra of
four BCGs (corrected for galactic reddening; black-solid lines): Haro 35,
I Zw 117, I Zw 53, and I Zw 56. The contributions to the synthetic spectra
by old stars (OLD,
 ), intermediate-age stars (INT, 109,
), young stars (YS, 107-
), and newly-born stars (H II) are also shown. The emission line spectrum
appears in the OBS-SYN difference, at the bottom of each panel.
(This figure is available in color in electronic form.) ), intermediate-age stars (INT, 109,
), young stars (YS, 107-
), and newly-born stars (H II) are also shown. The emission line spectrum
appears in the OBS-SYN difference, at the bottom of each panel.
(This figure is available in color in electronic form.) |
The range of star formation histories inferred for the BGCs in our sample
may be interpreted in terms of an evolutionary sequence. Following Cid
Fernandes etal. (2001b), we represent graphically the histories of star
formation of the galaxies in Fig. 4, in a plane with abscissa
 =
+
and ordinate
.
Also shown as dashed lines in the
figure are lines of constant
(
+
+
= 1).
=
+
and ordinate
.
Also shown as dashed lines in the
figure are lines of constant
(
+
+
= 1).
![\begin{figure}
\par\includegraphics*[angle=-90,width=17.2cm,clip]{aa3164-f4.ps}
\end{figure}](/articles/aa/full/2003/21/aa3164/Timg78.gif) |
Figure 4:
Results of the empirical population synthesis analysis for the galaxies
with asymptotic (young-star) metallicities [
(stars)
and 0.0 (squares), condensed on an evolutionary diagram.
The horizontal axis
=
+
is the fraction of light at
5870 Å due to star clusters between the 107 and
age bins and H II regions, while the fraction
due to stars in the 109 and
age bins is
plotted along the vertical axis.
Dotted lines indicate lines of constant
(
), as
labeled. |
The main result from Fig. 4 is that the 73 BCGs in our
sample define a sequence in
and
over a relatively small
range of
.
The range in
is slightly smaller for
galaxies with asymptotic (young-star) metallicity [
(stars) than for those with asymptotic metallicity [
(squares). Some galaxies with "extreme'' stellar populations are labelled
in Fig. 4. In I Zw 56 and II Zw 67, for example, old stars
contribute up to 20% of the integrated flux at 5870
(see Sect. 4.3 above). The galaxy III Zw 43 is that where
intermediate-age stars contribute the most to the optical continuum
emission. In contrast, some galaxies, such as I Zw 18, II Zw 40, appear
to be almost "pure starbursts''. The small percentage of old and
intermediate-age stars found here for these galaxies is consistent
with the results from other recent studies, e.g., Smoker etal. (1999),
Aloisi etal. (1999) (see Sect. 5.2 below).
Since the location of an individual galaxy in Fig. 4 reflects
the evolutionary state of its stellar population, we can interpret the
distribution of galaxies in this diagram as an evolutionary
sequence. In particular, starbursting galaxies whose spectra are entirely
dominated by young massive stars (bottom right part of the diagram) will
presumably evolve toward larger
/
values (top left part of the
diagram) over a timescale of a few
 ,
once their bursts
have ceased. This interpretation is supported by several observational
facts. First, metal absorption-line features become stronger and galaxy
colors become progressively redder as one moves from large
to large
along the sequence. Second, galaxies with large
(such as
I Zw 56, II Zw 67) have spectra typical of a "post-starburst'' galaxies,
with pronounced Balmer absorption lines characteristic of A-type stars and
with no strong emission lines. Finally, most BCGs in which WR features
have been detected are located in the large-
region of the diagram,
consistent with the young burst ages implied by the presence of WR stars
(Schaerer etal. 1999).
,
once their bursts
have ceased. This interpretation is supported by several observational
facts. First, metal absorption-line features become stronger and galaxy
colors become progressively redder as one moves from large
to large
along the sequence. Second, galaxies with large
(such as
I Zw 56, II Zw 67) have spectra typical of a "post-starburst'' galaxies,
with pronounced Balmer absorption lines characteristic of A-type stars and
with no strong emission lines. Finally, most BCGs in which WR features
have been detected are located in the large-
region of the diagram,
consistent with the young burst ages implied by the presence of WR stars
(Schaerer etal. 1999).
Accurate measurements of the H-Balmer emission lines are crucial
to constrain the attenuation by dust, the star formation rate,
the gas-phase abundances of chemical elements and the excitation
parameter in galaxies (e.g., Rosa-González etal. 2002). To measure with
accuracy the Balmer emission-line fluxes of BCGs, we must account
for the contamination by underlying stellar absorption.
Different approaches have been used to correct Balmer emission-line
fluxes for underlying stellar absorption in BCGs. The simplest
approach consists in adopting a constant equivalent width (1.5-2 Å)
for all the Balmer absorption lines (e.g., Skillman & Kennicutt 1993;
Popescu & Hopp 2000). Another standard correction consists in
determining the absorption equivalent width through an iterative
procedure, by assuming that the equivalent width is the same for all
Balmer lines and by requiring that the color excesses derived from
H/H,
H/H,
and H/H
be consistent (e.g., Olive & Skillman 2001;
Cairós et al. 2002). In reality, however, the absorption equivalent
width may not be the same for all H-Balmer lines.
The advantage of the empirical population synthesis method used
above to fit the observed spectra of BCGs is that it provides
simultaneous fits to the continuum and stellar absorption features
of the galaxies. We have measured the absorption equivalent widths
of H,
H,
H,
and H
in the synthetic spectra fitted to all
73 galaxies in our sample (last four columns of Tables 3 and 4).
Figure 5 shows the distributions of the equivalent
widths of the four lines. The equivalent widths of H,
H,
and H
range typically between 2 Å and 5 Å (the distributions
have different shapes for different lines), while that of H
is
typically less than 2 Å. Hence, Fig. 5 indicates
that adopting a constant absorption equivalent width for all H-Balmer
lines is only a crude approximation. Our results are consistent with
those of Mas-Hesse & Kunth (1999) and Olofsson (1995).
We can correct with accuracy, therefore, the fluxes of Balmer emission
lines for underlying stellar absorption in the spectra of BCGs. In
a forthcoming study, we will exploit the nebular emission-line
spectra (OBS-SYN in Fig. 3) of BCGs to constrain
the rates of star formation and gas-phase chemical element abundances
in these galaxies.
![\begin{figure}
\par\includegraphics*[angle=-90,width=8.8cm,clip]{aa3164-f5.ps}
\end{figure}](/articles/aa/full/2003/21/aa3164/Timg80.gif) |
Figure 5:
Distribution of the equivalent widths (in units of Å) for the
underlying Balmer absorption features, which were measured from
the synthetic stellar population spectrum. |
It is worth noting that the reason why we are able to constrain
simultaneously the ages and metallicities of the different
stellar components in BCGs is that our approach is based on
fitting stellar absorption lines, in addition to continuum
fluxes. Age and metallicity have similar effects on the
continuum spectra of galaxies. However, some stellar absorption
features such as H,
H,
H
and the G-band have been shown
to depend mostly on age, while others, such as Mg I+Mg H and
Fe5709, have been shown to depend mostly on
metallicity (e.g., Worthey & Ottaviani 1997; Vazdekis & Arimoto 1999;
Kong & Cheng 2001).
In this paper, we use the Ca II K 3933, H
4102, CN 4200, G band 4301, H
4340 and Mg I+Mg H 5176 absorption features to
determine the stellar population of BCGs. These include both
age-sensitive and metal-sensitive features. Some of these
absorption features may not be available in some spectra,
which may lack, for example, H
and H.
Also, some absorption
features may be very shallow, and hence difficult to measure
with high accuracy. For most galaxies, however, we find that the
results of the empirical population synthesis analysis provide
coarse but useful constraints on the histories of star formation
and metal enrichment.
The most straightforward way to observe the star formation history
of galaxies is through deep single-star photometry. This allows one
to directly identify stars in various evolutionary phases through
their positions in a color-magnitude diagram (CMD) containing
the fossil record of the star formation history. During the past few
years, intense activity has focused on the reconstruction of the
star formation histories of nearby galaxies using this approach.
Several of these studies were performed on BCGs and led to new
constraints on the ages of the oldest stars present in these galaxies
(Aloisi etal. 1999; Crone etal. 2002; Papaderos etal. 2002; Oestlin etal. 1998).
The general conclusions from these studies are that BCGs contain
evolved stellar populations, and that their star formation histories
have been discontinuous. The basic shortcoming of this approach is
that it cannot be used in galaxies at large distances. In addition,
the CMD-analysis method is also subject to several uncertainties
such as distance determination, extinction, and contamination of
stellar colors by gaseous emission.
Our results of the EPS analysis of 73 BCGs are consistent with those
of the CMD analysis of a few nearby galaxies, supporting the finding
that BCGs are old galaxies with intermittent star formation. The
evolutionary diagram constructed in Fig. 4 above
shows that the EPS method is not only able to recognize composite
systems from a handful of observable absorption-line features and
continuum fluxes, but also to provide a rough description of the
evolutionary state of the stellar components. Therefore, the EPS
method provides a convenient tool for the study of stellar components
and star formation histories of galaxies. It can be easily applied
to the spectra gathered by large spectroscopic galaxy surveys.
We have presented the results of an empirical population synthesis
study of a sample of 73 blue compact galaxies. Our main goal was to
study the stellar components of BCGs. We have constrained the star
formation histories of BCGs by comparing observed stellar absorption
features and continuum fluxes with a library of star cluster spectra.
Our conclusions can be summarized as follows:
BCGs present a variety of star formation histories, as inferred from
the wide spread in stellar absorption equivalent widths and continuum
colors from galaxy to galaxy. BCGs are typically age-composite stellar
systems, in which different stellar components are clearly
distinguished: the current starburst, an underlying older population,
and some intermediate-age population.
A quantitative analysis indicates that the nuclei of some BCGs
are dominated by young components and the star-forming process is
still ongoing. In most of BCGs, stars older than 1 Gyr contribute
significantly to the integrated optical emission. The contribution
by these stars can exceed 40% in some cases. Overall, the stellar
populations of BCGs suggest that they are old galaxies undergoing
intermittent star formation episodes; a typical BCGs is not presently
forming its first generation of stars. We also find that the
attenuation by dust is typically very small in the BCGs in our
sample.
Our results are consistent with the results from deep imaging
observations using HST and large ground-based telescopes. The
virtue of the EPS approach is that it is applied to integrated
galaxy spectra. This method should be useful, therefore, for
interpreting the spectra garthered by large spectroscopic galaxy
surveys.
The EPS approach also provides accurate spectral fits of observed
galaxy spectra. From these spectral fits, it is possible to measure
with accuracy, in particular, the absorption strengths of stellar
Balmer lines and to correct the observed Balmer emission-line fluxes
for underlying stellar absorption. The pure emission-line spectra
of the BCGs in our sample, resulting from the subtraction of the
synthetic spectral fits from the observed spectra, will be presented
in a forthcoming paper.
Acknowledgements
We thank the anonymous referee for helpful comments and constructive
suggestions, which helped us improve the paper. We are very grateful
to Dr. R. Cid Fernandes for giving us the EPS computer program, and
kindly assisting us in its use. This work is based on observations
made with the 2.16m telescope of the Beijing Astronomical
Observatory (BAO) and supported by the Chinese National Natural
Science Foundation (CNNSF 10073009). S.C. thanks the Alexander
von Humboldt Foundation, the Federal Ministry of Education and Research,
and the Programme for Investment in the Future (ZIP) of the German
Government for support. X.K. has been financed by the Special Funds
for Major State Basic Research Projects of China and the Alexander
von Humboldt Foundation of Germany.
-
Alloin, D., Gallart, C., Fleurence, E., et al. 2002, Ap&SS, 281, 109
NASA ADS
-
Aloisi, A., Tosi, M., & Greggio, L. 1999, AJ, 118, 302
NASA ADS
-
Arimoto, N., & Yoshii, Y. 1987, A&A, 173, 23
NASA ADS
-
Bergvall, N., & Östlin, G. 2002, A&A, 390, 891
NASA ADS
-
Bica, E. 1988, A&A, 195, 76
NASA ADS
-
Bica, E., & Alloin, D. 1986, A&A, 162, 21
NASA ADS
-
Boisson, C., Joly, M., Moultaka, J., etal. 2000, A&A, 357, 850
NASA ADS
-
Bressan, A., Chiosi, C., & Fagotto, F. 1994, ApJS, 94, 63
NASA ADS
-
Bruzual, A. G. 1983, ApJ, 273, 105
NASA ADS
-
Bruzual, A. G., & Charlot, S. 1993, ApJ, 405, 538
NASA ADS
-
Bruzual, A. G., & Charlot, S. 2003, MNRAS, submitted
-
Buzzoni, A. 1989, ApJS, 71, 817
NASA ADS
-
Cairós, L. M., Caon, N., García-Lorenzo, B., etal. 2002, ApJ, 577, 164
NASA ADS
-
Charlot, S., Worthey, G., & Bressan, A. 1996, ApJ, 457, 625
NASA ADS
-
Cid Fernandes, R., Sodré, L., Schmitt, H. R., etal. 2001, MNRAS, 325, 60
NASA ADS
-
Cid Fernandes, R., Heckman, T., Schmitt, H., etal. 2001b, ApJ, 558, 81
NASA ADS
-
Crone, M. M., Schulte-Ladbeck, R. E., Greggio, L., & Hopp, U. 2002,
ApJ, 567, 258
NASA ADS
-
Faber, S. M. 1972, A&A, 20, 361
NASA ADS
-
Fioc, M., & Rocca-Volmerange, B. 1997, A&A, 326, 950
NASA ADS
-
Fritze-v. Alvensleben, U. 2000, ASP Conf. Ser. 221: Stars, Gas and Dust in
Galaxies, 179
-
Grebel, E. K 2000, ASP Conf. Ser., 221, 297
-
Grebel, E. K. 2001, Dwarf galaxies and their environment, 45
-
Kong, X. 2000, PASP, 112, 1502
NASA ADS
-
Kong, X., & Cheng, F. Z. 2001, MNRAS, 323, 1035
NASA ADS
-
Kong, X., & Cheng, F. Z. 2002a, A&A, 389, 845
NASA ADS
-
Kong, X., Cheng, F. Z., Weiss, A., & Charlot, S. 2002b, A&A, 396, 503
NASA ADS
-
Lejeune, T., & Schaerer, D. 2001, A&A, 366, 538
NASA ADS
-
Leitherer, C., et al. 1996, PASP, 108, 996
NASA ADS
-
Leitherer, C., et al. 1999, ApJS, 123, 3
NASA ADS
-
Marigo, P., Girardi, L., Groenewegen, M. A. T., & Weiss, A. 2001,
A&A, 378, 958
NASA ADS
-
Mas-Hesse, J. M., & Kunth, D. 1999, A&A, 349, 765
NASA ADS
-
Metropolis, N., Rosenbluth, A., Teller, A., & Teller, E. 1953, J. Chem.
Phys., 21, 1087.
-
Moeller, C. S., Fritze-v. Alvensleben, U., & Fricke, K. J. 1997, A&A,
317, 676
NASA ADS
-
Oconnell, R. W. 1976, ApJ, 206, 370
NASA ADS
-
Oestlin, G., Bergvall, N., & Roennback, J. 1998, A&A, 335, 85
NASA ADS
-
Olofsson, K. 1995, A&AS, 111, 57
NASA ADS
-
Olive, K. A., & Skillman, E. D. 2001, New Astron., 6, 119
NASA ADS
-
Papaderos, P., Izotov, Y. I., Thuan, T. X., Noeske, K. G., etal.
2002, A&A, 393, 461
NASA ADS
-
Pelat, D. 1998, MNRAS, 299, 877
NASA ADS
-
Pickles, A. J. 1985, ApJ, 296, 340
NASA ADS
-
Popescu, C. C., & Hopp, U. 2000, A&AS, 142, 247
NASA ADS
-
Rosa-González, D., Terlevich, E., & Terlevich, R. 2002, MNRAS, 332, 283
NASA ADS
-
Schaerer, D., Contini, T., & Pindao, M. 1999, A&AS, 136, 35
NASA ADS
-
Schmidt, A. A., Copetti, M. V. F., Alloin, D., & Jablonka, P. 1991,
MNRAS, 249, 766
NASA ADS
-
Schmitt, H. R., Bica, E., & Pastoriza, M. G. 1996, MNRAS, 278, 965
NASA ADS
-
Smith, C. R., & Grandy, W. T. Jr. 1985, Maximum-entropy and bayesian methods
in inverse problems (Dordrecht: D. Reidel)
-
Smoker, J. V., Axon, D. J., & Davies, R. D. 1999, A&A, 341, 725
NASA ADS
-
Skillman, E. D., & Kennicutt, R. C. 1993, ApJ, 411, 655
NASA ADS
-
Spinrad, H., & Taylor, B. J. 1971, ApJS, 22, 445
NASA ADS
-
Thuan, T. X., & Izotov, Y. I. 2000, IAU Symp., 198, 176
-
Vazdekis, A., & Arimoto, N. 1999, ApJ, 525, 144
NASA ADS
-
Weiss, A., Peletier, R. F., & Matteucci, F. 1995, A&A, 296, 73
NASA ADS
-
Westera, P., Lejeune, T., Buser, R., Cuisinier, F., & Bruzual, G. 2002, A&A, 381, 524
NASA ADS
-
Worthey, G. 1994, ApJS, 95, 107
NASA ADS
-
Worthey, G., & Ottaviani, D. L. 1997, ApJS, 111, 377
NASA ADS
Copyright ESO 2003
![\begin{figure}
\par\includegraphics*[angle=-90,width=8.8cm,clip]{aa3164-f1.ps}
\end{figure}](/articles/aa/full/2003/21/aa3164/img71.gif)
![\begin{figure}
\par\includegraphics[angle=-90,width=17.2cm,clip]{aa3164-f2.ps}
\end{figure}](/articles/aa/full/2003/21/aa3164/img75.gif)
![\begin{figure}
\par\includegraphics[angle=-90,width=18cm,clip]{aa3164-f3.ps}\end{figure}](/articles/aa/full/2003/21/aa3164/img77.gif)
![\begin{figure}
\par\includegraphics*[angle=-90,width=17.2cm,clip]{aa3164-f4.ps}
\end{figure}](/articles/aa/full/2003/21/aa3164/img78.gif)
![\begin{figure}
\par\includegraphics*[angle=-90,width=8.8cm,clip]{aa3164-f5.ps}
\end{figure}](/articles/aa/full/2003/21/aa3164/img80.gif)