A&A 403, 1115-1121 (2003)
DOI: 10.1051/0004-6361:20030426
On stability of rotation of the mean magnetic field of the Sun
V. I. Haneychuk - V. A. Kotov - T. T. Tsap
Crimean Astrophysical Observatory, Nauchny, Crimea
98409, Ukraine
Isaak Newton Institute of Chile, the Crimean Branch
Received 30 September 2002 / Accepted 14 February 2003
Abstract
New data on the mean magnetic field of the Sun (MMFS) as a star measured
at the Crimean Astrophysical Observatory in 1998-2001 are presented. The
34-year time series of the MMFS using similar data from three other
observatories (1968-2001, with the total number of daily MMFS values N =
12 428), is considered. It is found that (a) the primary synodic period
of the equatorial rotation of solar magnetic field,
 days, did not vary over the last 34 years, but
(b) the average intensity H0 of the photospheric large-scale fields,
by modulus, decreased by about 4.5% (with a confidence level of about
80%). The conclusion is made that the longer, 90-year, cycle might be
responsible for this potential gradual decrease of H0. The average curve of
MMFS variation as plotted with the primary rotational period
days, did not vary over the last 34 years, but
(b) the average intensity H0 of the photospheric large-scale fields,
by modulus, decreased by about 4.5% (with a confidence level of about
80%). The conclusion is made that the longer, 90-year, cycle might be
responsible for this potential gradual decrease of H0. The average curve of
MMFS variation as plotted with the primary rotational period  demonstrates an obvious N-S asymmetry of polarities, perhaps
associated with the quadrupole component and "magnetic disequilibrium''
of the Sun as a whole.
demonstrates an obvious N-S asymmetry of polarities, perhaps
associated with the quadrupole component and "magnetic disequilibrium''
of the Sun as a whole.
Key words: Sun: magnetic fields - Sun: rotation
The mean magnetic field of the Sun (MMFS) represents the magnetic
disequilibrium of the whole magnetic flux seen in the visible solar hemisphere.
It is observed as a rule using the integrated solar flux without forming solar
images at the spectrograph entrance slit. A magnetograph of high sensitivity
is needed for the detection of small variations, from day to day, of the total
(longitudinal) magnetic flux of the Sun.
During the last 34 years, more or less regular measurements of the Sun as a
magnetic star were carried out at four observatories:
1) the Crimean Astrophysical Observatory (CrAO; program was started in
1968 by Severny 1969, with colleagues),
2) the Mount Wilson Observatory (MWO; observations were initiated by
Scherrer 1973 and Howard 1974 in 1970),
3) the Wilcox Solar Observatory of the Stanford University
(WSO; measurements were started in 1975 by J. Wilcox and P. Scherrer; see Scherrer
et al. 1977b),
4) the Sayan Observatory of the Solar-Terrestrial Physics Institute
(SO, Irkutsk; measurements were begun in 1982 by Grigoryev & Demidov
1987).
We now have more than three decades of MMFS measurements - after the start of
the Crimean program (Severny 1969; Kotov & Severny 1983).
These data, as shown below, can give us valuable information about the sector
structure of the interplanetary magnetic field, "magnetic variability''
of the Sun as a star and solar rotation, seen in the average magnetic field.
Recently Kotov et al. (1999) and Haneychuk (1999) showed that
the power spectrum of MMFS variations is dominated by the period =
26.92  0.02 days, which demonstrates high stability of its initial phase
over decades. This period characterises the rotation rate of the near-equatorial
magnetic regions of the Sun and may be connected to the so-called "active
longitudes''. (Kotov & Tsap 1999 also noticed to a
close resonance, 7 : 2, between 26.92-day rotation of MMFS and orbital motion
of Mercury, the closest planet to the Sun. It was suggested that this resonance
have been formed at early stages of the formation of the solar system.)
0.02 days, which demonstrates high stability of its initial phase
over decades. This period characterises the rotation rate of the near-equatorial
magnetic regions of the Sun and may be connected to the so-called "active
longitudes''. (Kotov & Tsap 1999 also noticed to a
close resonance, 7 : 2, between 26.92-day rotation of MMFS and orbital motion
of Mercury, the closest planet to the Sun. It was suggested that this resonance
have been formed at early stages of the formation of the solar system.)
In 1998-2001 we performed 396 daily measurements of MMFS, listed in
Table 1. Combined with the previous CrAO data and those
obtained in other three observatories, these measurements are analysed here to
study the behaviour of the Sun during the new cycle 23 and over the total
34-year interval.
Table 1:
The CrAO measurements of MMFS in 1998-2001 (B in Gs).
| Date |
B |
Date |
B |
Date |
B |
Date |
B |
Date |
B |
Date |
B |
Date |
B |
Date |
B |
| May 1998 |
April 1999 |
July 1999 |
March 2000 |
July 2000 |
March 2001 |
July 2001 |
Oct. 2001 |
| 26 |
0.21 |
17 |
0.52 |
28 |
-0.55 |
31 |
-1.54 |
21 |
-0.62 |
27 |
-0.66 |
6 |
0.26 |
11 |
-0.63 |
| June 1998 |
18 |
0.68 |
29 |
-0.18 |
April 2000 |
22 |
-0.78 |
28 |
-0.11 |
7 |
0.55 |
15 |
-0.35 |
| 2 |
-0.70 |
20 |
0.29 |
30 |
-0.37 |
2 |
-0.99 |
24 |
-1.18 |
30 |
0.23 |
8 |
0.43 |
18 |
-0.09 |
| 5 |
-0.73 |
25 |
-0.69 |
August 1999 |
3 |
-0.68 |
25 |
-0.60 |
31 |
0.17 |
9 |
0.06 |
19 |
0.31 |
| 8 |
0.79 |
26 |
-0.66 |
3 |
-0.12 |
5 |
0.04 |
26 |
-0.33 |
April 2001 |
10 |
-0.03 |
25 |
-0.03 |
| 16 |
-0.74 |
30 |
-0.55 |
4 |
-0.19 |
6 |
0.43 |
28 |
0.31 |
3 |
-0.16 |
11 |
-0.32 |
26 |
-0.33 |
| 17 |
-0.44 |
May 1999 |
5 |
-0.31 |
11 |
0.69 |
29 |
1.09 |
4 |
-0.98 |
12 |
0.15 |
27 |
-0.77 |
| 18 |
-0.31 |
1 |
0.39 |
6 |
-0.17 |
12 |
0.29 |
30 |
1.43 |
7 |
-0.91 |
13 |
0.70 |
28 |
-0.55 |
| 19 |
-0.23 |
2 |
0.42 |
7 |
-0.16 |
13 |
0.03 |
31 |
0.95 |
8 |
-0.70 |
14 |
1.36 |
29 |
-0.71 |
| 23 |
0.33 |
4 |
0.75 |
8 |
-0.16 |
14 |
-0.02 |
Sept. 2000 |
9 |
-0.39 |
15 |
1.51 |
Nov. 2001 |
| 27 |
-0.02 |
21 |
-0.46 |
9 |
0.13 |
15 |
0.02 |
10 |
0.23 |
10 |
-0.40 |
16 |
0.91 |
1 |
0.04 |
| 28 |
-0.71 |
22 |
-0.50 |
10 |
0.11 |
17 |
1.14 |
12 |
-0.31 |
11 |
-0.63 |
17 |
0.90 |
2 |
0.04 |
| 30 |
-0.80 |
23 |
-0.72 |
11 |
0.07 |
18 |
1.42 |
13 |
-0.31 |
12 |
-0.26 |
18 |
0.29 |
3 |
-1.04 |
| July 1998 |
24 |
-0.79 |
12 |
0.43 |
19 |
1.36 |
14 |
-1.19 |
13 |
-0.26 |
19 |
0.11 |
4 |
-1.16 |
| 1 |
-0.61 |
28 |
-0.19 |
Sept. 1999 |
21 |
0.72 |
15 |
-1.51 |
20 |
0.09 |
20 |
-0.57 |
5 |
-0.59 |
| 8 |
0.23 |
29 |
-0.17 |
15 |
1.66 |
24 |
-0.39 |
16 |
-1.87 |
23 |
0.76 |
21 |
-0.45 |
8 |
0.22 |
| 12 |
-0.39 |
June 1999 |
17 |
0.30 |
26 |
-0.69 |
17 |
-1.65 |
27 |
0.29 |
22 |
-0.31 |
9 |
0.33 |
| 13 |
-0.14 |
1 |
0.46 |
18 |
-0.34 |
27 |
-0.51 |
18 |
-0.66 |
28 |
-0.07 |
23 |
-0.32 |
Dec. 2001 |
| 14 |
-0.52 |
6 |
-0.76 |
19 |
-0.73 |
28 |
-0.38 |
19 |
0.03 |
30 |
-0.46 |
24 |
-0.32 |
3 |
-0.77 |
| 15 |
-0.28 |
7 |
-0.54 |
20 |
-1.15 |
29 |
-0.48 |
21 |
1.34 |
May 2001 |
August 2001 |
5 |
-0.34 |
| 16 |
-0.12 |
11 |
0.30 |
21 |
-1.02 |
30 |
-0.56 |
22 |
0.79 |
1 |
-0.70 |
21 |
0.08 |
7 |
-0.09 |
| 19 |
-0.23 |
14 |
-0.21 |
22 |
-0.39 |
May 2000 |
28 |
1.02 |
2 |
-1.06 |
23 |
-0.01 |
|
|
| 20 |
-0.19 |
15 |
-0.17 |
24 |
1.36 |
1 |
-0.25 |
29 |
1.10 |
3 |
-0.94 |
24 |
-0.77 |
|
|
| 21 |
0.17 |
16 |
-0.34 |
25 |
1.20 |
3 |
-0.13 |
Oct. 2000 |
4 |
-0.86 |
25 |
-0.66 |
|
|
| 22 |
0.11 |
17 |
-0.17 |
27 |
0.80 |
4 |
-0.10 |
2 |
0.03 |
6 |
-0.74 |
26 |
-0.60 |
|
|
| 23 |
0.32 |
18 |
-0.10 |
28 |
0.00 |
June 2000 |
3 |
0.26 |
7 |
-0.52 |
27 |
0.07 |
|
|
| 31 |
-0.10 |
19 |
-0.07 |
29 |
-0.65 |
7 |
0.11 |
4 |
0.19 |
8 |
-0.34 |
28 |
0.22 |
|
|
| Sept. 1998 |
21 |
-0.21 |
30 |
-0.85 |
8 |
-0.31 |
5 |
0.24 |
10 |
-0.14 |
29 |
0.34 |
|
|
| 4 |
-0.12 |
22 |
0.10 |
Oct. 1999 |
9 |
0.01 |
6 |
0.64 |
15 |
-0.04 |
30 |
0.23 |
|
|
| 8 |
-0.02 |
25 |
0.12 |
1 |
-1.51 |
10 |
0.17 |
8 |
0.93 |
16 |
-0.07 |
31 |
-0.35 |
|
|
| 11 |
-0.25 |
26 |
0.51 |
2 |
-1.40 |
11 |
0.40 |
13 |
-1.83 |
17 |
-0.30 |
Sept. 2001 |
|
|
| 13 |
-0.17 |
28 |
0.30 |
3 |
-0.52 |
12 |
0.47 |
14 |
-2.24 |
18 |
0.28 |
1 |
-0.46 |
|
|
| 15 |
0.02 |
29 |
0.13 |
4 |
-0.27 |
13 |
0.26 |
15 |
-1.23 |
19 |
0.58 |
2 |
-0.60 |
|
|
| 18 |
0.17 |
30 |
-0.01 |
5 |
-0.28 |
14 |
0.71 |
16 |
-0.40 |
21 |
0.67 |
5 |
0.28 |
|
|
| 25 |
0.07 |
July 1999 |
7 |
0.33 |
26 |
-1.03 |
17 |
0.42 |
24 |
0.53 |
6 |
0.60 |
|
|
| 27 |
-0.93 |
1 |
-0.59 |
12 |
1.71 |
27 |
-0.49 |
24 |
-0.43 |
25 |
0.33 |
10 |
0.45 |
|
|
| 28 |
-0.99 |
2 |
-0.56 |
14 |
0.14 |
29 |
0.51 |
25 |
0.27 |
26 |
0.38 |
11 |
0.46 |
|
|
| 29 |
-0.55 |
4 |
0.04 |
18 |
-1.10 |
30 |
0.36 |
26 |
0.01 |
27 |
-0.21 |
13 |
-0.30 |
|
|
| Oct. 1998 |
5 |
-0.19 |
19 |
-1.01 |
July 2000 |
30 |
-0.10 |
28 |
-0.45 |
14 |
-0.27 |
|
|
| 2 |
-0.20 |
6 |
-0.38 |
23 |
0.96 |
1 |
0.97 |
31 |
0.38 |
June 2001 |
15 |
0.14 |
|
|
| 6 |
0.38 |
7 |
-0.25 |
24 |
0.61 |
2 |
1.04 |
Nov. 2000 |
3 |
-0.42 |
16 |
0.19 |
|
|
| 8 |
-0.09 |
8 |
-0.03 |
25 |
0.27 |
3 |
1.57 |
1 |
0.69 |
4 |
-0.38 |
17 |
-0.39 |
|
|
| 9 |
-0.22 |
9 |
-0.26 |
29 |
-0.89 |
4 |
0.85 |
2 |
0.64 |
8 |
-0.67 |
18 |
-0.40 |
|
|
| 10 |
-0.33 |
10 |
0.19 |
Nov. 1999 |
5 |
0.55 |
4 |
0.66 |
9 |
0.05 |
19 |
-0.54 |
|
|
| 12 |
-0.46 |
11 |
-0.29 |
3 |
0.46 |
6 |
0.45 |
5 |
0.09 |
10 |
-0.05 |
20 |
-0.64 |
|
|
| 17 |
0.35 |
12 |
-0.18 |
4 |
0.69 |
7 |
0.22 |
8 |
-1.60 |
11 |
0.03 |
21 |
-0.25 |
|
|
| 18 |
0.84 |
13 |
0.04 |
5 |
1.14 |
8 |
0.81 |
9 |
-1.76 |
12 |
-0.02 |
22 |
-0.06 |
|
|
| 20 |
0.69 |
14 |
-0.18 |
6 |
1.26 |
9 |
0.54 |
10 |
-1.60 |
13 |
-0.28 |
23 |
0.25 |
|
|
| 22 |
0.14 |
15 |
-0.06 |
7 |
1.45 |
10 |
0.64 |
11 |
-1.18 |
14 |
0.14 |
24 |
0.55 |
|
|
| 23 |
-0.18 |
16 |
-0.13 |
9 |
1.61 |
11 |
0.25 |
13 |
0.46 |
15 |
0.30 |
27 |
0.93 |
|
|
| 24 |
-0.52 |
20 |
0.83 |
10 |
1.32 |
12 |
-0.13 |
14 |
1.09 |
18 |
0.67 |
Oct. 2001 |
|
|
| Nov. 1998 |
21 |
0.94 |
11 |
0.64 |
13 |
-0.43 |
15 |
1.26 |
19 |
0.80 |
2 |
-0.09 |
|
|
| 3 |
0.24 |
22 |
1.07 |
12 |
-1.88 |
14 |
-0.26 |
16 |
1.05 |
20 |
0.30 |
3 |
0.27 |
|
|
| 4 |
-0.36 |
23 |
1.01 |
18 |
0.37 |
15 |
-0.25 |
17 |
0.70 |
23 |
-0.76 |
4 |
0.24 |
|
|
| April 1999 |
24 |
0.70 |
22 |
0.30 |
16 |
-0.64 |
18 |
0.18 |
29 |
-0.85 |
5 |
0.12 |
|
|
| 10 |
0.67 |
25 |
0.45 |
March 2000 |
17 |
-0.93 |
20 |
-0.22 |
30 |
-1.35 |
8 |
-0.60 |
|
|
| 15 |
0.57 |
26 |
-0.23 |
29 |
-0.95 |
18 |
-1.06 |
30 |
0.86 |
July 2001 |
9 |
-0.41 |
|
|
| 16 |
0.51 |
27 |
-0.45 |
30 |
-1.28 |
19 |
-1.04 |
|
5 |
0.40 |
10 |
-0.58 |
|
|
Table 2:
Summary of MMFS data of four observatories.
| Observatory |
Interval, yrs |
N |
S, Gs |
k |
References |
|
CrAO (Crimea) |
1968-2001 |
1945 |
0.665 |
0.948 |
Kotov & Severny (1983), Kotov et al. (1999, 1998a), Kotov & Tsap (1999) |
| MWO (Mount Wilson) |
1970-1982 |
2457 |
0.670 |
0.940 |
Kotov et al. (1998b) |
| WSO* (Stanford) |
1975-2001 |
7713 |
0.412 |
1.531 |
Solar-Geophysical Data Prompt Report 1977-2001 |
| SO (Irkutsk) |
1982-1993 |
313 |
0.775 |
0.814 |
Grigoryev et al. (1983), Grigoryev & Demidov (1987), Kotov et al. (1998a) |
|
Total** |
1968-2001 |
12 428 |
0.631 |
|
|
* WSO data for the interval May 16, 1975 - March 31, 2001.
** The total normalized dataset (see text).
|
In each of four observatories the MMFS was registered by the solar magnetograph
using the Zeeman effect of the photospheric absorption line Fe I
 525.02 nm.
The magnetograph signal represents the mean strength of the longitudinal
magnetic field B, measured in total light flux from the visible hemisphere of the Sun.
The limb darkening enters B as a weighting function, together with
additional coefficients responsible for rotation, red shift of the spectral
line near the limb, correlation of field strength with the line contour
variations and photosphere brightness, etc. (see details in Scherrer
1973; Grigoryev et al. 1983; Grigoryev & Demidov
1987; Kotov et al. 1998b).
One single measurement of MMFS gives the B value obtained by one of the
instruments during the current UT-day. This is a magnetic disequilibrium
of the visible hemisphere of the Sun which is proportional to the
dominance of the magnetic flux of a given polarity over the opposite one.
The standard deviation S was calculated for data set of each observatory,
and then, using four S values, the mean value
 = 0.635 Gs
was determined. Then the B values of each observatory were multiplied by a
factor k =
= 0.635 Gs
was determined. Then the B values of each observatory were multiplied by a
factor k =
 (see Table 2). No additional
coefficients, including the factor caused by the so-called "saturation'' effect
of magnetograph signal in the fine-structured magnetic elements (Howard
& Stenflo 1972), were introduced.
(see Table 2). No additional
coefficients, including the factor caused by the so-called "saturation'' effect
of magnetograph signal in the fine-structured magnetic elements (Howard
& Stenflo 1972), were introduced.
After merging the normalized datasets we obtained the combined time
series of the MMFS, 1968-2001, with the total number of daily values
N = 12 428 and standard deviation S = 0.63 Gs. This time series, if there is
no special indication, is analysed below. The negative values of Bcorresponds to the southern (S) polarity, errors correspond to a standard
 deviation, and initial (0) phase to the UT moment 00
 00
00 on 1 January, 1968.
In the Fig. 1 the original MMFS measurements of the CrAO and the
WSO, carried out from June 1 through August 15, 1999, are plotted. We can see
more or less satisfactory qualitative agreement between variations of the two
observatories. In general, the CrAO variations are essentially larger than
those of the WSO. The agreement improves if one introduces the coefficient
 = 0.62, equal to the ratio of the standard deviations of the two time
series (see Table 2). For several days, or during a few consecutive
days, however, large differences in B values, exceeding errors of
measurements, will still exist; they cannot be corrected by the factor
(the typical errors are: 0.15 Gs for CrAO and 0.05 Gs for WSO; on the accuracy of measurements see Grigoryev & Demidov
1987; Kotov et al. 1998a, 1999).
= 0.62, equal to the ratio of the standard deviations of the two time
series (see Table 2). For several days, or during a few consecutive
days, however, large differences in B values, exceeding errors of
measurements, will still exist; they cannot be corrected by the factor
(the typical errors are: 0.15 Gs for CrAO and 0.05 Gs for WSO; on the accuracy of measurements see Grigoryev & Demidov
1987; Kotov et al. 1998a, 1999).
![\begin{figure}
\par\includegraphics[width=7.8cm,clip]{3134f1.eps}\end{figure}](/articles/aa/full/2003/21/aa3134/Timg16.gif) |
Figure 1:
Comparison of the MMFS data obtained from June 1 through August 15,
1999, at CrAO and WSO. |
The equation of linear regression for n = 51 pairs of the MMFS values
obtained "simultaneously'', i.e. on the same UT-day (Fig. 1), is:
 |
(1) |
(B is in Gs, errors are indicated in parentheses). It follows that during
the time span considered, the CrAO values, on average, were nearly three times
larger than the WSO values. The correlation coefficient between these two sets
is r = 0.59. Earlier, Kotov et al. (1998a) reported that in 1991
the parameters of linear regression between the same pair of observatories
revealed significantly different values:
 |
(2) |
with the number of pairs of data n = 25 and r = 0.94.
The main causes of these discrepancies are displacement of the zero level of
magnetographs, uncertainties in calibration, influence of instrumental
polarization, inaccuracy of adjustment of optical elements and possible
vignetting of the solar disk image.
Large scatter in MMFS measurements performed by different instruments might be
also connected to the fact that we measure magnetic disequilibrium
of the Sun. The main contribution to the MMFS signal is due to
extended unipolar regions of background fields that have different weights.
Those weights, together with instrumental effects, may substantially vary
from day to day and from one instrument to another; these differences may
also be caused by evolution of magnetic regions and solar rotation. Good
approximation to real B values can be attained, in our opinion, by merging
data sets from different instruments - to get, as a result, the merged
normalized MMFS series.
This question, however, needs special consideration. A wide-spreaded opinion
that data obtained by some intruments are more accurate than those from other
instrument (see Grigoryev & Demidov 1987; Kotov et al.
1998a) seems to be questionable. Notice for instance that the S values of three observatories - CrAO, MWO and SO (see Table 2) -
are very close to each other and to their average value 0.70 Gs, whereas
the Stanford measurements show S = 0.41 Gs, i.e. 1.7 times lower.
During the last two decades, the interest in solar rotation has been related
to the progress of helioseismology which collects much observational data and
uses sophisticated methods to solve the problem of solar neutrino deficit and
to study dynamics of convection and radiative zones of the Sun.
Sturrock & Weber (2002), for example, found that solar neutrino
flux varies with a synodic period  = 26.88 days. The latest
interpretation of such a variation may be that the neutrinos possibly can
have simultaneous precession of both spin and flavor in the magnetic field
(SPF-effect). For a given neutrino energy and density this effect may be
enhanced due to the resonance process making "resonant spin flavor
precession'' (RSFP). Under these conditions the neutrino flux might be
noticeably modulated by both inertial oscillations (r-modes) in the
radiation zone and rotation of the deep-seated magnetic field of the Sun.
= 26.88 days. The latest
interpretation of such a variation may be that the neutrinos possibly can
have simultaneous precession of both spin and flavor in the magnetic field
(SPF-effect). For a given neutrino energy and density this effect may be
enhanced due to the resonance process making "resonant spin flavor
precession'' (RSFP). Under these conditions the neutrino flux might be
noticeably modulated by both inertial oscillations (r-modes) in the
radiation zone and rotation of the deep-seated magnetic field of the Sun.
Now we can directly determine the value of the main period of "rigid''
rotation of the global magnetic field of the Sun using the MMFS data of 34 years. This period may reflect rotation of solar plasma near Sun's equator
as well. Similar results based on a lesser amount of MMFS data were already
obtained, e.g., by Kotov & Tsap (1999), Kotov et al.
(1999, 1998b), Haneychuk (1999).
![\begin{figure}
\par\includegraphics[width=7.8cm]{3134f2.eps}\end{figure}](/articles/aa/full/2003/21/aa3134/Timg20.gif) |
Figure 2:
Power spectrum of the 1968-2001 normalized MMFS data for a) the wide frequency range and b)
domain near solar rotation frequencies. Power is
represented by a square of harmonic amplitude, in Gs2 (left axis) and in normalized power units (right axis,
see detail in Sturrock & Weber 2002). The bottom axis
is frequency in  Hz while the top one gives cycles per year.
Main periods of rotation are indicated by numbers associated with
the most prominent peaks. Hz while the top one gives cycles per year.
Main periods of rotation are indicated by numbers associated with
the most prominent peaks. |
The power spectrum calculated for the wide frequency range is shown in
Fig. 2a, where major synodic periods, in days, are marked by numbers.
Spectra are calculated both by direct Fourier transform and by the more
complicated method of Scarge's (1982) periodogram that takes into
account the irregularities in time series. Our data have a relatively small
number of gaps in the time series, so the results of both spectra are
practically identical. The left axis in Fig. 2 is power in Gs2,
while the right axis is expressed in normalized power units
 ,
where
,
where  is the standard deviation of the time series;
see also Sturrock & Weber (2002). The bottom axis is frequency
in Hz while the top one is expressed in cycles per year using the simple
relationship
is the standard deviation of the time series;
see also Sturrock & Weber (2002). The bottom axis is frequency
in Hz while the top one is expressed in cycles per year using the simple
relationship
 |
(3) |
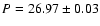
It is clearly seen that there are three groups of peaks, and the highest one
corresponds to the Sun's rotation with a maximum value at 26.93 days. Two
other groups correspond to second and third overtones with the peak maxima near 13.63 days and 9.03 days, correspondingly (see details also in
Haneychuk 1999). Some noticeable peaks are seen also in the
low-frequency region, e.g. that associated with a nearly 1 year period.
These periodicities were discussed earlier by Kotov & Levitsky
(1983), Haneychuk (1995), Kotov et al.
(1998a,b, 2002). Note that there are no substantial peaks
within the high-frequency region up to the Nyquist limit  5.8 Hz.
The periodicities marked in Fig. 2 are seen by eye in the
original time series; as a result, the significance of each of those peaks
is extremely high due to the low level of noise in the power spectrum
(mean level,
 Gs2).
Using Scargle's (1982) technique, we can formally estimate,
for example, a probability to get by chance the peak with a period of 9.03 days
as
Gs2).
Using Scargle's (1982) technique, we can formally estimate,
for example, a probability to get by chance the peak with a period of 9.03 days
as
 ,
which corresponds to the confidence level
,
which corresponds to the confidence level
 of a normal distribution.
Possible influence of the window function on the results is also negligible,
as was shown previously by Kotov et al. (1998b).
of a normal distribution.
Possible influence of the window function on the results is also negligible,
as was shown previously by Kotov et al. (1998b).
The power spectrum of MMFS computed for the frequency range near the solar
rotation frequency is shown in Fig. 2b, where the maximal peak
corresponds to the synodic period
 |
(4) |
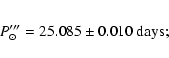
The corresponding sidereal period is
 = 25.080 0.015 days. In Fig. 2 we marked with numbers also the prominent peaks
connected with differential rotation: 27.144, 27.420 and 28.140 days. One can see that main periodicity of the mean magnetic field
of the Sun
coincides within the error limits with the potential
"neutrino'' period = 26.88
0.05 days, presumably discovered in
the GALLEX-GNO experimental data, 1991-2000, by Sturrock & Weber
(2002). Using the results of helioseismology, the authors also
located the region in convective zone of the Sun that rotates with the same
rate, see Fig. 8 in Sturrock & Weber (2002).
This is the lower region of the convective zone near the equator and a
region near the surface at latitude 15
= 25.080 0.015 days. In Fig. 2 we marked with numbers also the prominent peaks
connected with differential rotation: 27.144, 27.420 and 28.140 days. One can see that main periodicity of the mean magnetic field
of the Sun
coincides within the error limits with the potential
"neutrino'' period = 26.88
0.05 days, presumably discovered in
the GALLEX-GNO experimental data, 1991-2000, by Sturrock & Weber
(2002). Using the results of helioseismology, the authors also
located the region in convective zone of the Sun that rotates with the same
rate, see Fig. 8 in Sturrock & Weber (2002).
This is the lower region of the convective zone near the equator and a
region near the surface at latitude 15 .
It should be noted here that this coincides with results of Antonucci et al.
(1990) who analysed rotation of the photospheric magnetic
field using solar magnetograms and found that main rotation period in
the northern hemisphere of the Sun is 26.9 days and is located in a zone with
its center near 15.
.
It should be noted here that this coincides with results of Antonucci et al.
(1990) who analysed rotation of the photospheric magnetic
field using solar magnetograms and found that main rotation period in
the northern hemisphere of the Sun is 26.9 days and is located in a zone with
its center near 15.
Period
 days is also known as the
equatorial rotation of solar plasma, the solar corona,
photospheric magnetic field and interplanetary magnetic field (Wilcox et al.
1970; Antonucci & Svalgaard 1974;
Kotov et al. 1998b, 1999). According to Doppler
measurements of Scherrer et al. (1980) the solar equator rotates
with a synodic period of 26.96
0.17 days which is in fair agreement with
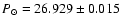
our value for MMFS. We may therefore conclude that the most precise value of
this period is 26.929
0.015 days: using the total 34-year MMFS data we
reduced its error by more than 10 times. One must note also that the main
period of the solar magnetic rotation appears to be stable over more than three
solar cycles, in spite of changing solar activity and polar magnetic field
reversals. This long-term phase stability of rotation is probably connected to
the phenomenon of so-called "active longitudes'' of the Sun. It is then worth
mentioning the results of Benevolenskaya et al. (1999) who found
that magnetic fluxes of the "old'' and "new'' cycles are non-randomly
distributed relative to "active longitudes''.
days is also known as the
equatorial rotation of solar plasma, the solar corona,
photospheric magnetic field and interplanetary magnetic field (Wilcox et al.
1970; Antonucci & Svalgaard 1974;
Kotov et al. 1998b, 1999). According to Doppler
measurements of Scherrer et al. (1980) the solar equator rotates
with a synodic period of 26.96
0.17 days which is in fair agreement with
our value for MMFS. We may therefore conclude that the most precise value of
this period is 26.929
0.015 days: using the total 34-year MMFS data we
reduced its error by more than 10 times. One must note also that the main
period of the solar magnetic rotation appears to be stable over more than three
solar cycles, in spite of changing solar activity and polar magnetic field
reversals. This long-term phase stability of rotation is probably connected to
the phenomenon of so-called "active longitudes'' of the Sun. It is then worth
mentioning the results of Benevolenskaya et al. (1999) who found
that magnetic fluxes of the "old'' and "new'' cycles are non-randomly
distributed relative to "active longitudes''.
Gilman & Fox (1999) obtained a solution of dynamo equations taking
into account the instability of the coexistence of differential rotation and a
toroidal field near the base of the convective zone. According to their
simulations we must observe sudden phase shifts of magnetic structures in the
longitudinal direction in one or both hemispheres during the solar cycle, or
essential changes in rotation of magnetic structures. Hence, the phase
stability - over a few solar cycles - of the major rotation period
of the Sun cannot be explaned by this theoretical approach.
Evidences in favour of time changes of solar rotation reported sometimes in the
literature are connected usually with the phase of the solar 11-year cycle. It
is possible to determine the rotation rate of the Sun for the first and
second portions of the MMFS series separately, i.e. for the time spans
1968-1984 and 1985-2001. The corresponding two power spectra are
similar to that plotted in Fig. 2 and are not shown here. As a
result, we found that the same rotation period, within the error limits,
dominated both time intervals:
1968-1984, N = 7157:
 days,
days,
1985-2001, N = 5271:
 days.
days.
One can conclude therefore that the equatorial rate of the MMFS rotation and,
probably, that of the whole Sun did not change over three cycles of solar
activity covered by MMFS observations.
![\begin{figure}
\par\includegraphics[width=7.8cm]{3134f3.eps}\end{figure}](/articles/aa/full/2003/21/aa3134/Timg34.gif) |
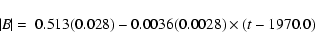
Figure 3:
Phase diagram conctructed with the test period
 =
27.000 days. Phases =
27.000 days. Phases  are shown by points in the interval
0-1 and are repeated for interval 1-2; the vertical bar indicates
the typical error of the phase. Sloping dashed lines with negative
slope correspond to the real period of = 26.92
0.02 days, while dotted lines with small positive slope correspond
to the period 27.02
0.02 days.
are shown by points in the interval
0-1 and are repeated for interval 1-2; the vertical bar indicates
the typical error of the phase. Sloping dashed lines with negative
slope correspond to the real period of = 26.92
0.02 days, while dotted lines with small positive slope correspond
to the period 27.02
0.02 days. |
Another way to get the precise value of periodicity is the phase diagram
method. For each successive 5-year time interval we calculated the average
phase curves for the test period
= 27.000 days which is close
to the main period in Fig. 2. Then the best-fit sinusoids were
calculated for each curve, and amplitudes A and phases
of harmonic
maxima were determined.
The distribution of phases
with time is plotted in the Fig. 3
by dots (the average curve for the 1995-1999 interval with the mean time near
1997 happened to be insignificant and the
corresponding dot is absent on the plot). The straight dotted lines of linear
regression, calculated by the least-square method, shows that the best
value of the period in question is equal to = 26.92
0.02 days,
which coincides within the error limits with the previous value (4), obtained from the power spectrum analysis.
One can also note that the phase of -rotation appears to be stable,
on average, over the total 34-year interval in spite of some deviations caused
mainly by the 11-year cycle.
The phase diagram indicates however the presence of yet
another periodicity, close to 27 days, too. The small positive run
of phases (dots) can be seen within the intervals 1970-1976 and 1987-1993.
Just for these intervals (14 data points only) the best-fit period is
27.03 days while for all data the period value is 27.02 days (corresponding
dotted lines are shown in Fig. 3).
As we can see, this period is present on the phase diagram, but it is
practically absent in the power spectrum of Fig. 2b. Its
value is very close to the mean value between the two most prominent peaks,
of 27.14 and 26.93 days. The frequency difference between those two periods
corresponds to 9.5
0.8 years, which is close to the length of the 11-year
cycle (the average length of the last 3 cycles is approximately 10.1 years).
Probably, we have modulation of the main rotation period by the 11-year
solar cycle. To answer this question we must have more data and make
more specific analyses.
It is interesting to compare the solar rotation rate (4) obtained
for MMFS 1968-2001 with the characteristic rate for previous years. For this
we can take results obtained earlier for the interplanetary magnetic field
(IMF) as an indicator of rotation of the MMFS. It is well-known (Scherrer
1973; Scherrer et al. 1977a) that the sector structure
of IMF is formed mainly by large-scale magnetic fields and thus correlates well
with the sector structure of MMFS. The power spectrum of polarity of the IMF,
published by Kotov (1987), shows that in 1926-1983 the structure of
IMF near the ecliptic plane rotated preferably with two main periods: 28.20 and
26.94 days (rotation of the IMF over five solar cycles has been analysed also
by Svalgaard & Wilcox 1975). The first period, 28.20 days,
characterizes probably rotation of the photospheric field at middle
heliolatitudes or near the base of the convective zone. The second period we
may compare with our value of :
IMF rotation, 1926-1983: period 26.940
0.010 days,
SMMF rotation, 1968-2001: period 26.929
0.015 days.
Hence we may conclude that rotation of the MMFS and, as a consequence of the
magnetic field freezing, that of the whole Sun at the equator, within the error
limits, did not vary over the 76 year time span. The average value of these
two periods which reflects the rotation of the Sun at the equator is
The corresponding sidereal period is
 = 25.085
0.010 days. We must note that such long-term stability of the
photospheric field is difficult to explain in terms of the present conceptions
about the origin of solar cyclicity where reversals of predominant polarity
must be observed each 11-year interval, as well as disappearance of the "old''
polarity pattern being replaced by fields of a "new'' cycle.
= 25.085
0.010 days. We must note that such long-term stability of the
photospheric field is difficult to explain in terms of the present conceptions
about the origin of solar cyclicity where reversals of predominant polarity
must be observed each 11-year interval, as well as disappearance of the "old''
polarity pattern being replaced by fields of a "new'' cycle.
![\begin{figure}
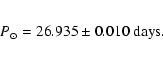
\par\includegraphics[width=7.8cm]{3134f4.eps}\end{figure}](/articles/aa/full/2003/21/aa3134/Timg37.gif) |
Figure 4:
The mean phase curve of the MMFS, 1968-2001, plotted with a period of
= 26.929 days; the total number of MMFS measurements N =
12 428. The points represent the MMFS averages within phase bins of
 ;
the vertical error bar indicates the typical standard
error, and the dotted curve represents the best-fit sinusoid. ;
the vertical error bar indicates the typical standard
error, and the dotted curve represents the best-fit sinusoid. |
The phase and general view of the MMFS average curve might be interesting for
solution of the problem of "active longitudes'' of the Sun, and also for
comparison with future solar observations. It is plotted in Fig. 4,
where it seems worthwhile to note its non-harmonic form and asymmetry between
positive and negative halfwaves. The latter might be associated with (a)
quadrupole component of global solar magnetic field which can be comparable
sometimes, in magnitude, with dipole component and can introduce significant
deviations from a pure harmonic curve, and (b) the magnetic asymmetry
of the Sun as a whole (see Severny 1968; Wilcox 1972;
Kotov & Levitsky 1985; Grigoryev & Demidov 1989).
Parameters of the plotted curve are following:
A = 0.22
0.03 Gs,
= 0.85
0.02.
The MMFS is one of physical parameters which characterizes the solar cyclic
activity equally with sunspot number. Is there some slow trend, up or down, of
the MMFS absolute strength?
Lockwood et al. (1999) reported recently that the mean magnetic
field of the solar corona increased almost by two times during the last 100 years. Kotov & Kotova (2001) however, using direct measurements of
Zeeman-effect of solar photosphere (i.e., the MMFS measurements) showed that
any significant increase of the SMMF strength is absent. Using the full time
series of the MMFS we can answer the question about long-term variation of
the photospheric magnetic field of the Sun.
One should note that the study of various aspects of slow variations of the Sun
as a star - both its radiation and magnetic field - appears to be important
for solar-terrestrial relations, and also for the current problem of "global
warming'' of the Earth's climate (Parker 1999).
![\begin{figure}
\par\includegraphics[width=7.8cm]{3134f5.eps}\end{figure}](/articles/aa/full/2003/21/aa3134/Timg39.gif) |
Figure 5:
Variations of the half-year averaged values of
 during last 34 years (N = 12428). Vertical error bar shows the
typical error, dotted line is the linear trend, obtained by the
least-square method.
during last 34 years (N = 12428). Vertical error bar shows the
typical error, dotted line is the linear trend, obtained by the
least-square method. |
The normalized time series of the MMFS was converted to the series of absolute
values
(1968-2001, N = 12 428), with the resultant mean
value
 = 0.453 Gs. We calculated then the running-mean
values of
for each half-year interval of the new time
series. The behaviour of these half-year averages during last 34 years is shown
in Fig. 5. Besides the main variation connected with the 11-year
cycle, one can see the presence of an absolute maximum that occured in 1991.
= 0.453 Gs. We calculated then the running-mean
values of
for each half-year interval of the new time
series. The behaviour of these half-year averages during last 34 years is shown
in Fig. 5. Besides the main variation connected with the 11-year
cycle, one can see the presence of an absolute maximum that occured in 1991.
The linear regression line
 |
(5) |
shows that there is a slow decrease of
by 23
18%
(
is in Gs, time t is in years). The full amplitude of
the decreasing effect is greater than one standard error, but its significance
is quite low, with a confidence level of about 80%. Since the MMFS measurements
were made in four observatories, it seems unlikely that this slow trend of
might be caused by some instrumental causes.
As we see from Fig. 5, the decrease of MMFS strength (and, consequently, of
the average intensity of the Sun's global magnetic field) can be explained, in
part, by a decrease of the MMFS strength in the cycle 23, in spite of
relatively large sunspot numbers in this new cycle.
The long-term measurements of the MMFS give the unique possibility to determine
with high accuracy the rotation rate of the photospheric field and, therefore,
of the atmosphere at/near solar equator. Using MMFS data for 34 years, also the
data on polarity patterns of the IMF since 1926 (Svalgaard & Wilcox
1975; Kotov 1987) we determined that the main sidereal
period of Sun's rotation at the equator is
this value did not vary, within the error limits, over last 76 years.
That fact that main rotation period of the magnetic field of the Sun
coincides within error limits with the major variation of solar neutrino flux,
detected by Sturrock & Weber (2002), indicates the reality
of solar neutrino deviations in the strong magnetic field inside the
convective zone. This fact may also suggest that below the convective zone
the magnetic field is relatively small.
The fact that dominating - in rotation - magnetic structure did not
"dissipate'', and the corresponding peak in the power spectrum is not split,
arises the important question of the actual processes of generation and
rotation of the global solar magnetic field which appears to be invariable with
respect to the phase of the 11-year cycle. It seems hard to find a simple
explanation of this phenomenon in terms of the present dynamo theory.
The average strength of the MMFS decreased by nearly 4.5% during the last 34 years. This decrease however has low (about 80%) statistical significance,
and must be verified by new measurements. If real, it might be caused by
the long-term solar variabiliy cycle, with a quasi-period near or larger than 90 years.
Acknowledgements
We are very grateful to N. P. Rusak for the technical work at the CrAO telescope
STT-1 and with the solar magnetograph, and also to N. G. Sunitza for the help in
MMFS data reduction. We thank M. L. Demidov for exchange of the MMFS data and to
J. Staude and J. O. Stenflo for the fruitful discussions of problems of the MMFS
measurements and magnetic variability of the Sun. The authors also are very
thankful to the referee Peter Sturrock for his helpful comments and suggestions
which essentially improved the paper. Our special thanks to the anonymous staff
of A&A for numerous corrections in English.
This work was supported in part by the INTAS grant No. 2000-840.
-
Antonucci, E., & Svalgaard, L. 1974, Sol. Phys., 34, 3
NASA ADS
-
Antonucci, E., Hoeksema, J. T., & Scherrer, P. H. 1990, ApJ, 360, 296
NASA ADS
-
Benevolenskaya, E. E., Hoeksema, J. T., Kosovichev, A. G., & Scherrer, P. H. 1999, ApJ, 517, L163
NASA ADS
-
Gilman, P. A., & Fox, P. A. 1999, ApJ, 522, 1167
NASA ADS
-
Grigoryev, V. M., & Demidov, M. L. 1987, Sol. Phys., 114, 147
NASA ADS
-
Grigoryev, V. M., & Demidov, M. L. 1989, in Solar Magnetic Fields and Corona, 1 (Novosibirsk, Nauka), 108
-
Grigoryev, V. M., Demidov, M. L., & Osak, B. F. 1983, Issled. po geomagnetizmu, aeronomii i fizike Solntsa, 65, 13 (in russian)
-
Haneychuk, V. I. 1995, Bull. Crimean Astrophys. Obs., 92, 84
-
Haneychuk, V. I. 1999, AZh, 76, 385
-
Howard, R. 1974, Sol. Phys., 38, 283
NASA ADS
-
Howard, R., & Stenflo, J. O. 1972, Sol. Phys., 22, 402
NASA ADS
-
Kotov, V. A. 1987, Bull. Crimean Astrophys. Obs., 77, 39
-
Kotov, V. A., & Kotova, I. V. 2001, Soviet Astron. Lett., 27, 302
-
Kotov, V. A., & Levitsky, L. S. 1983, Bull. Crimean Astrophys. Obs., 66, 110
-
Kotov, V. A., & Levitsky, L. S. 1985, Bull. Crimean Astrophys. Obs., 71, 32
-
Kotov, V. A., & Severny, A. B. 1983, Mean Magnetic Field of the Sun as a star. Catalogue 1968-1976, Soviet Geophysical Committee, Moscow (in russian)
-
Kotov, V. A., & Tsap, T. T. 1999, Kinematics and Physics of Cel. Bodies, 15, 1
-
Kotov, V. A., Demidov, M. L., Haneychuk, V. I., & Tsap, T. T. 1998a, Bull. Crimean Astrophys. Obs., 94, 110
-
Kotov, V. A., Scherrer, P. H., Howard, R. F., & Haneychuk, V. I. 1998b, ApJS, 116, 103
NASA ADS
-
Kotov, V. A., Haneychuk, V. I., & Tsap, T. T. 1999, AZh, 76, 218
-
Kotov, V. A., Haneychuk, V. I., & Tsap, T. T. 2002, Kinematics and Physics of Cel. Bodies, 18, 205
-
Lockwood, M., Stamper, R., & Wild, M. N. 1999, Nature, 399, 437
NASA ADS
-
Parker, E. N. 1999, Nature, 399, 416
-
Scargle, J. D. 1982, ApJ, 263, 835
NASA ADS
-
Scherrer, P. H. 1973, Stanford Univ. Inst. Plasma Res. Rep., 554
-
Scherrer, P. H., Wilcox, J. M., Kotov, V., Severny, A. B., & Howard, R. 1977a, Sol. Phys., 52, 3
NASA ADS
-
Scherrer, P. H., Wilcox, J. M., Svalgaard, L., et al. 1977b, Sol. Phys., 54, 353
NASA ADS
-
Scherrer, P. H., Wilcox, J. M., & Svalgaard, L. 1980, ApJ, 241, 811
NASA ADS
-
Severny, A. B. 1968, Bull. Crimean Astrophys. Obs., 38, 3
-
Severny, A. 1969, Nature, 224, 53
-
Sturrock, P. A., & Weber, M. A. 2002, ApJ, 565, 1366
NASA ADS
-
Svalgaard, L., & Wilcox, J. M. 1975, Sol. Phys., 41, 461
NASA ADS
-
Wilcox, J. M. 1972, Comm. Astrophys. Space Phys., 4, 141
-
Wilcox, J. M., Schatten, K. H., Tanenbaum, A. S., & Howard, R. 1970, Sol. Phys., 14, 255
NASA ADS
Copyright ESO 2003
![\begin{figure}
\par\includegraphics[width=7.8cm,clip]{3134f1.eps}\end{figure}](/articles/aa/full/2003/21/aa3134/img16.gif)
![\begin{figure}
\par\includegraphics[width=7.8cm]{3134f2.eps}\end{figure}](/articles/aa/full/2003/21/aa3134/img20.gif)
![\begin{figure}
\par\includegraphics[width=7.8cm]{3134f3.eps}\end{figure}](/articles/aa/full/2003/21/aa3134/img34.gif)
![\begin{figure}
\par\includegraphics[width=7.8cm]{3134f4.eps}\end{figure}](/articles/aa/full/2003/21/aa3134/img37.gif)
![\begin{figure}
\par\includegraphics[width=7.8cm]{3134f5.eps}\end{figure}](/articles/aa/full/2003/21/aa3134/img39.gif)