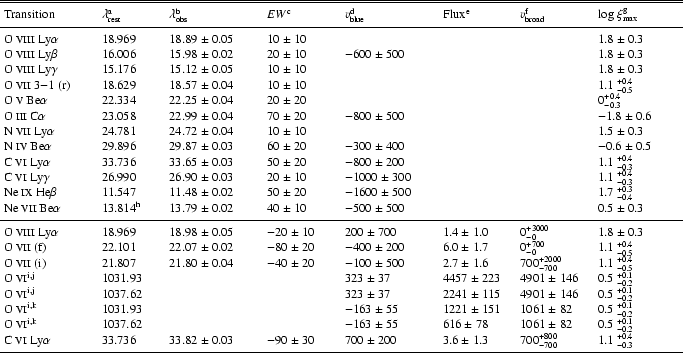
Table 3:
The rest wavelengths (
 ), observed wavelengths (
 ), equivalent widths ( EW), blueshifts (
 ), fluxes, velocity widths (
 ,
FWHM) and range of log
,
FWHM) and range of log  (log
(log
 )
where the ion is most abundant of absorption (top section) and emission lines (bottom section) in the RGS spectrum of NGC 7469; rms errors are quoted throughout, except for log
where the error bars give the range where the ion has a higher relative abundance than adjacent ionisation states. Blueshifts are not given for lines whose equivalent width is consistent with zero. Also listed are rest wavelengths, blueshifts, fluxes, velocity widths and log
for the broad and narrow O VI emission lines observed by FUSE (Kriss et al. 2003).
)
where the ion is most abundant of absorption (top section) and emission lines (bottom section) in the RGS spectrum of NGC 7469; rms errors are quoted throughout, except for log
where the error bars give the range where the ion has a higher relative abundance than adjacent ionisation states. Blueshifts are not given for lines whose equivalent width is consistent with zero. Also listed are rest wavelengths, blueshifts, fluxes, velocity widths and log
for the broad and narrow O VI emission lines observed by FUSE (Kriss et al. 2003).
 |
 Rest wavelength in
  . .
 Observed wavelength in .
 Equivalent width in m.
 Blueshifted velocity in km s
 . .
 Observed flux of line in 10
 photons cm
 s.
s.
 Velocity broadening (FWHM) in km s.
 log
where the ion is at its maximum relative abundance;
has the units erg cm s,
and the error
log
where the ion is at its maximum relative abundance;
has the units erg cm s,
and the error
bars give the range where the ion has a higher relative abundance than adjacent ionisation states.
 From Behar & Netzer (2002).
 Measured in the UV by FUSE (Kriss et al. 2003).
 From the Broad Line Region.
 From the Narrow Line Region.
 |
Source LaTeX |
All tables |
In the text