A&A 402, L17-L20 (2003)
DOI: 10.1051/0004-6361:20030448
T. J. Wang - S. K. Solanki - D. E. Innes - W. Curdt - E. Marsch
Max-Planck-Institut für Aeronomie, 37191 Katlenburg-Lindau, Germany
Received 12 March 2003 / Accepted 25 March 2003
Abstract
We report the first detection of postflare loop oscillations seen in both
Doppler shift and intensity. The observations were recorded in an
Fe XIX line by the SUMER spectrometer on SOHO in the corona about 70 min after an M-class flare on the solar limb. The oscillation has a period
of about 17 min in both the Doppler velocity and the intensity, but their decay
times are different (i.e., 37 min for the velocity and 21 min for
the intensity). The fact that the velocity and the intensity oscillations
have exactly a 1/4-period phase difference points to the existence
of slow-mode standing waves in the oscillating loop. This interpretation is also
supported by two other pieces of evidence: (1) the wave period and
(2) the amplitude relationship between the intensity and velocity are as
expected for a slow-mode standing wave.
Key words: Sun: corona - flares - oscillations - UV radiation
In recent years, high temporal and spatial resolution space telescopes have led to significant progress in observations of coronal MHD waves. For example, kink mode oscillations excited by flares in coronal loops were detected by TRACE in EUV radiation (Nakariakov et al. 1999; Aschwanden et al. 1999; Aschwanden et al. 2002). Slow magnetosonic waves were observed in cool coronal loops by SOHO/EIT (e.g. Berghmans & Clette 1999; De Moortel et al. 2002). These observations allow MHD waves to be used for coronal seismology (e.g. Nakariakov & Ofman 2001) and are important for developing wave-based theories of coronal heating.
Very recently, the Solar Ultraviolet Measurements of Emitted Radiation
(SUMER) spectrometer on SOHO discovered damped oscillations of hot coronal
loops in Doppler shift (Kliem et al. 2002; Wang et al. 2002a-c, 2003).
Observations of 27 flare-like events show that the oscillations have
periods in the range of P=7-31 min and decay times of
![]() min. The observed strong decay has been explained
in the context of a 1D MHD model as a consequence of thermal
conduction acting on the slow mode oscillations by Ofman & Wang (2002).
In this study, we report convincing evidence that
these Doppler oscillations are caused by slow-mode standing waves in
coronal loops.
min. The observed strong decay has been explained
in the context of a 1D MHD model as a consequence of thermal
conduction acting on the slow mode oscillations by Ofman & Wang (2002).
In this study, we report convincing evidence that
these Doppler oscillations are caused by slow-mode standing waves in
coronal loops.
The flare was observed by EIT in the 195 Å channel. There were a few images around flare onset, and then a data gap of 2 hours. EIT observing resumed again around 2:00 UT. SUMER observations were continuous and registered the cooling of postflare loops from 6.3 MK (Fe XIX) to 0.03 MK (S III). Similar cooling features are also observed in another event by TRACE and SUMER (Wang et al. 2002d). There were two distinct loop systems (marked A and B in Fig. 1). Figures 1a,b show the evolution of Fe XIX and S III intensity at the height of the SUMER observations. For both loop systems the S III emission appears several hours later at the same location as the Fe XIX, indicating that the magnetic structure in the coronal arcades remains unchanged as the plasma cools. This is also supported by the fact that twice transient northward-moving brightenings (marked M1 and M2 in Fig. 1b) occurred at the same location along the slit as system A. The EIT image at 2:03 UT (Fig. 1c) shows that the SUMER observations of system A were taken about half way up the loop arcade. The plasma in system B was not observed in the EIT 195 Å channel until about 3:00 UT. SUMER was observing near the top of this system (Fig. 1d).
Doppler oscillation events are found to occur twice at two regions near the cuts A and B, respectively (see Fig. 2a). At the start of both oscillation events cool plasma ejection was seen in S III (Fig. 1b). This suggests that the oscillations are probably excited by small aftermath events near a loop footpoint. We will study in detail the trigger of these events in the next paper.
In this study, we concentrate only on the oscillation features at region B.
The geometrical parameters of loop B can be determined from the EIT image
in Fig. 1d, assuming a loop with a circular shape
and using the same method as in Aschwanden et al. (2002).
The azimuth angle of the loop baseline to the east-west direction is
![]() .
The inclination angle of the loop plane
southward to the vertical is
.
The inclination angle of the loop plane
southward to the vertical is
![]() .
The loop length is derived as
L=191 Mm and the length of the segment BF2 is
.
The loop length is derived as
L=191 Mm and the length of the segment BF2 is
![]() Mm, i.e.
Mm, i.e.
![]() .
The angle between the line-of-sight and the magnetic
field (assuming it to point toward the footpoint F1) near cut B
is
.
The angle between the line-of-sight and the magnetic
field (assuming it to point toward the footpoint F1) near cut B
is
![]() .
.
The first oscillation event began at about 23:30 UT, still during the Fe XIX brightening phase. This oscillation is strongly damped with a period of 16 min and a decay time of 11.4 min. The later event began at 0:50 UT in the flare decay phase. Strikingly, the line-integrated intensity around cut B shows periodic fluctuations overlaid on a decreasing background (see Fig. 2c). In order to see the intensity oscillation more clearly, we subtract the background trend, obtained by temporally smoothing the intensity series (see Fig. 2b).
Of particular interest is the second oscillatory event, which lasted for about
100 min. During this time more than 5 periods of Doppler and intensity
oscillations were detected (see Figs. 3a,b). We measure
physical parameters of the oscillations from the best fit damped sine
function (see Eq. (1)). For the Doppler oscillation we obtain an
amplitude of
![]() km s-1, a period of
km s-1, a period of
![]() min,
and a decay time of
min,
and a decay time of
![]() min. A ratio of
min. A ratio of
![]() is unique among the coronal oscillations seen by SUMER so far,
is unique among the coronal oscillations seen by SUMER so far,
![]() being more typical (Wang et al. 2003). For the intensity
oscillation we analyze the difference profile (see Fig. 3b), which is
derived by subtracting a 20-pixel (
being more typical (Wang et al. 2003). For the intensity
oscillation we analyze the difference profile (see Fig. 3b), which is
derived by subtracting a 20-pixel (![]() 17 min) smooth background trend.
In this way we can separate the variation in intensity due to the oscillation
from that due to the flare. Of advantage for this is the fact that the brightening
due to the flare lasts much longer than the oscillation period. This is unusual
for the brightenings associated with SUMER oscillations. We obtain an amplitude
of
17 min) smooth background trend.
In this way we can separate the variation in intensity due to the oscillation
from that due to the flare. Of advantage for this is the fact that the brightening
due to the flare lasts much longer than the oscillation period. This is unusual
for the brightenings associated with SUMER oscillations. We obtain an amplitude
of
![]() W m-2 sr-1 and a relative
amplitude of
W m-2 sr-1 and a relative
amplitude of
![]() (where I(t0) is the background
intensity at the start of the modeled time series). The intensity oscillation has
a period of
(where I(t0) is the background
intensity at the start of the modeled time series). The intensity oscillation has
a period of
![]() min and a decay time of
min and a decay time of
![]() min. Within the errors the velocity and intensity periods are identical,
but their decay times differ by a factor of about 2.
Comparing the phase relation between the Doppler and intensity oscillations,
we find that except for the first peak their phases differ by exactly
a quarter of a period. This relation is characteristic of compressive standing
waves (Sakurai et al. 2002; Ofman & Wang 2002). Figure 3c shows that in spite of considerable
noise the continuum intensity shows quasi-periodic fluctuations, roughly
in phase with the intensity oscillation in Fe XIX,
giving further evidence for a compressive wave. Its peak at 01:06 UT
displays a relative amplitude of about 0.08.
min. Within the errors the velocity and intensity periods are identical,
but their decay times differ by a factor of about 2.
Comparing the phase relation between the Doppler and intensity oscillations,
we find that except for the first peak their phases differ by exactly
a quarter of a period. This relation is characteristic of compressive standing
waves (Sakurai et al. 2002; Ofman & Wang 2002). Figure 3c shows that in spite of considerable
noise the continuum intensity shows quasi-periodic fluctuations, roughly
in phase with the intensity oscillation in Fe XIX,
giving further evidence for a compressive wave. Its peak at 01:06 UT
displays a relative amplitude of about 0.08.
![\begin{figure}
\par\includegraphics[width=8cm,clip]{Fc124_f3.eps}
\end{figure}](/articles/aa/full/2003/17/aafc124/img27.gif) |
Figure 3: a) Evolution of Doppler shift and b) of line-integrated intensity in the Fe XIX line for cut B. The thick solid curves are the best fits with a damped sine function. For the curves in a) and b), the background shift (V0 in Eq. (1)) and the background intensity have been removed, respectively. The error bars represent the standard deviation of shifts or intensities along the slit for cut B. c) Evolution of continuum intensity (thin solid curves), obtained by integration at the line wings of both S III and Ca X for cut B, and background removal similar as in b). The thick solid curve is the 3-pixel smoothing of the thin one. As a comparison, the intensity curve of Fe XIX shown in b) is also plotted (dotted line). |
We report several Doppler shift oscillation events in high (>6 MK) temperature postflare loops produced by a M-class flare recorded in an Fe XIX line by SUMER. We have analyzed in detail one of these cases, which was associated with periodic intensity fluctuations.
A large number of Doppler oscillation events were detected by SUMER (Wang et al. 2002b,c, 2003). Although some lines of evidence suggested slow standing waves as the cause of these oscillations, the absence of clear brightness fluctuations with the wave period argued against such an interpretation. The discovery of Doppler and intensity oscillations with the same period and an exact 1/4-period phase difference in this study gives us for the first time strong evidence in support of this idea.
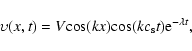
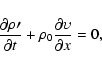
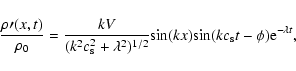
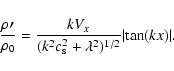
For a standing slow mode wave
![]() (Roberts et al. 1984),
where L is the loop length and
(Roberts et al. 1984),
where L is the loop length and ![]() the sound speed. If we regard the loop seen by EIT as the oscillating loop,
and assume that its geometry did not change much during its cooling, we obtain
the sound speed. If we regard the loop seen by EIT as the oscillating loop,
and assume that its geometry did not change much during its cooling, we obtain
![]() min for this loop of L=191 Mm with T=6.3 MK
(giving
min for this loop of L=191 Mm with T=6.3 MK
(giving
![]() km s-1). This result matches the observed period
rather well.
km s-1). This result matches the observed period
rather well.
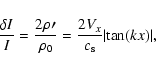
To analyze the amplitude relationship between the velocity and
intensity oscillations on the basis of the slow-mode waves, we consider
a damped standing wave of the following form for the velocity,
The loop oscillation discussed in the present paper is particularly suited to reveal intensity oscillations, although we expect that they are present in other hot loop oscillations as well (the level relative to the velocity oscillations may change, however, as discussed above). Bumps in the intensity signal, which may be associated with the oscillations, are seen in many events (Wang et al. 2003). However, the combination of rapid damping of the oscillation and rapid change of the background intensity makes it extremely difficult to distill the intensity signal of the oscillations from the observations.
On the other hand, a kink-mode motion of the loop may also produce intensity
and Doppler oscillations with possibly a 1/4-period phase difference when the
slit is located at the loop top (see Fig. 1d). However, such an
assumption will lead to a plasma ![]() in the loop of about 2.4, which would be
inconsistent with the usual coronal condition of low
in the loop of about 2.4, which would be
inconsistent with the usual coronal condition of low ![]() .
The same
arguments against the kink wave interpretation for some other cases are also given
by Wang et al. (2002a,c, 2003).
.
The same
arguments against the kink wave interpretation for some other cases are also given
by Wang et al. (2002a,c, 2003).
Wang et al. (2003) measured 54 Doppler oscillation cases in 27 events and found
that the oscillations generally have a strong damping with
![]() and the number of visible periods is less than 3. In this paper, however, the
studied case is a unique one of the weakest damping (with 5 clearly visible
periods and
and the number of visible periods is less than 3. In this paper, however, the
studied case is a unique one of the weakest damping (with 5 clearly visible
periods and
![]() )
among all cases seen by SUMER so far. Based on MHD equations in Ofman & Wang (2002), we suggest that the weaker damping in this flare loop
may be due to higher plasma density, possibly 1-2 orders of
magnitude larger than that (
)
among all cases seen by SUMER so far. Based on MHD equations in Ofman & Wang (2002), we suggest that the weaker damping in this flare loop
may be due to higher plasma density, possibly 1-2 orders of
magnitude larger than that (![]() 109 cm-3) in usual active region loops.
109 cm-3) in usual active region loops.
Acknowledgements
We would like to thank the referee Markus J. Aschwanden for his valuable comments. SUMER is financially supported by DLR, CNES, NASA and the ESA PRODEX programme. SOHO is a project of international co-operation between ESA and NASA.
![\begin{figure}
\par\includegraphics[width=14.5cm,clip]{Fc124_f1.eps}
\end{figure}](/articles/aa/full/2003/17/aafc124/img4.gif)
![\begin{figure}
\par\includegraphics[width=8cm,clip]{Fc124_f2.eps}
\end{figure}](/articles/aa/full/2003/17/aafc124/img16.gif)