

GD 358, also called V777 Herculis, is the prototype of the DBV class of white dwarf pulsators. It was the first pulsating star detected based on a theoretical prediction (Winget et al. 1985), and is the pulsating star with the largest number of periodicities detected after the Sun. Detecting as many modes as possible is important, as each periodicity detected yields an independent constraint on the star's structure. The study of pulsating white dwarf stars has allowed us to measure the stellar mass and composition layers, to probe the physics at high densities, including crystallization, and has provided a chronometer to measure the age of the oldest stars and consequently, the age of the Galaxy.
Robinson et al. (1982) and Kepler (1984) demonstrated that
the variable white dwarf stars pulsate in non-radial gravity modes.
Beauchamp et al. (1999) studied the spectra of the pulsating DBs
to determine their instability strip at
 K, and found
 K,
K,
 for
the brightest DBV,
GD 358 (V= 13.85),
assuming no photospheric H, as confirmed by Provencal et al. (2000).
Provencal et al. studied the HST and EUVE spectra, deriving
for
the brightest DBV,
GD 358 (V= 13.85),
assuming no photospheric H, as confirmed by Provencal et al. (2000).
Provencal et al. studied the HST and EUVE spectra, deriving
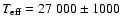 K, finding traces of
carbon in the atmosphere [
K, finding traces of
carbon in the atmosphere [
![$\log({{\rm C/He}})=-5.9\pm 0.3]$](/articles/aa/full/2003/14/aa3375/img13.gif) and
a broadening corresponding to
and
a broadening corresponding to
 km s-1. They also detected Ly
 that is probably interstellar.
Althaus & Benvenuto (1997) demonstrated that the
Canuto et al. (1996, hereafter CGM) self consistent theory of
turbulent convection is consistent with the
that is probably interstellar.
Althaus & Benvenuto (1997) demonstrated that the
Canuto et al. (1996, hereafter CGM) self consistent theory of
turbulent convection is consistent with the
 K
determination,
as GD 358 defines the blue edge of the DBV instability strip.
Shipman et al. (2002) extended the blue edge of the DBV instability strip
by finding that the even hotter star PG0112+104 is a pulsator.
K
determination,
as GD 358 defines the blue edge of the DBV instability strip.
Shipman et al. (2002) extended the blue edge of the DBV instability strip
by finding that the even hotter star PG0112+104 is a pulsator.
Winget et al. (1994) reported
on the analysis of 154 hours of nearly continuous time series
photometry on GD 358, obtained during
the Whole Earth Telescope (WET) run of May 1990. The Fourier
temporal spectrum
of the light curve is dominated by periodicities in the range
1000-2400  Hz,
with more than 180 significant peaks.
They identify all of the triplet frequencies as
having degree
Hz,
with more than 180 significant peaks.
They identify all of the triplet frequencies as
having degree  and, from
the details of their triplet (k) spacings, from which
Bradley & Winget (1994)
derived the total stellar mass
as
and, from
the details of their triplet (k) spacings, from which
Bradley & Winget (1994)
derived the total stellar mass
as

 ,
the mass of the outer helium envelope as
,
the mass of the outer helium envelope as
 M*, the luminosity as
 and,
deriving a temperature and bolometric correction,
the distance as
and,
deriving a temperature and bolometric correction,
the distance as  pc.
Winget et al. (1994) found changes in the m spacings among the
triplet modes, and by assuming the rotational splitting coefficient
pc.
Winget et al. (1994) found changes in the m spacings among the
triplet modes, and by assuming the rotational splitting coefficient
 depends only on
radial overtone k and the
rotation angular velocity
depends only on
radial overtone k and the
rotation angular velocity
 ,
interpret the
observed spacing as strong evidence of radial differential rotation,
with the outer envelope rotating some 1.8 times faster than the core.
However, Kawaler et al. (1999) find that the core rotates
faster than the envelope when they perform rotational splitting
inversions of the observational data. The apparently contradictory
result is due to the presence of mode trapping and the behavior of the
rotational splitting kernel in the core of the model.
Winget et al. also found
significant power at the sums and differences of the dominant frequencies,
indicating that non-linear processes are significant, but with
a richness and complexity that rules out
resonant mode coupling as a major cause.
,
interpret the
observed spacing as strong evidence of radial differential rotation,
with the outer envelope rotating some 1.8 times faster than the core.
However, Kawaler et al. (1999) find that the core rotates
faster than the envelope when they perform rotational splitting
inversions of the observational data. The apparently contradictory
result is due to the presence of mode trapping and the behavior of the
rotational splitting kernel in the core of the model.
Winget et al. also found
significant power at the sums and differences of the dominant frequencies,
indicating that non-linear processes are significant, but with
a richness and complexity that rules out
resonant mode coupling as a major cause.
We show that in the WET data set reported here
(acquired in 2000), only 12 of the periodicities can be identified as
independent g-mode pulsations,
probably all different radial overtones (k) with same spherical
degree ,
plus the azimuthal m components for k=8 and 9.
The high amplitude with a period of 796 s is identified as an
 mode; it was not present in the previous data sets.
Most, if not all, of the
remaining periodicities are linear
combination peaks of these pulsations.
Considering there are many more observed combination frequencies
than available eigenmodes,
we interpret the linear
combination peaks as caused by non-linear effects, not real pulsations.
This interpretation is consistent with the proposal by Brickhill
(1992) and Wu (2001) that the combination frequencies appear by the non-linear
response of the medium.
Recently, van Kerkwijk et al. (2000) and Clemens et al. (2000) show that
most linear combination peaks for the DAV G29-38 do not show any
velocity variations, while the eigenmodes do.
However, Thompson et al. (2003)
argue that some combination peaks do show velocity variations.
mode; it was not present in the previous data sets.
Most, if not all, of the
remaining periodicities are linear
combination peaks of these pulsations.
Considering there are many more observed combination frequencies
than available eigenmodes,
we interpret the linear
combination peaks as caused by non-linear effects, not real pulsations.
This interpretation is consistent with the proposal by Brickhill
(1992) and Wu (2001) that the combination frequencies appear by the non-linear
response of the medium.
Recently, van Kerkwijk et al. (2000) and Clemens et al. (2000) show that
most linear combination peaks for the DAV G29-38 do not show any
velocity variations, while the eigenmodes do.
However, Thompson et al. (2003)
argue that some combination peaks do show velocity variations.
As a clear demonstration of the power of asteroseismology,
Metcalfe et al. (2001)
and Metcalfe et al. (2002)
used GD 358 observed periods from Winget et al. (1994)
and a genetic algorithm to search for
the optimum theoretical model
with static diffusion envelopes,
and constrained the
 cross section, a crucial parameter for many fields in astrophysics
and difficult to constrain in terrestrial laboratories.
Montgomery et al. (2001)
also used the observed pulsations
to constrain the diffusion of
cross section, a crucial parameter for many fields in astrophysics
and difficult to constrain in terrestrial laboratories.
Montgomery et al. (2001)
also used the observed pulsations
to constrain the diffusion of
 in white dwarf stars.
They show their best model for GD 358 has O/C/
in white dwarf stars.
They show their best model for GD 358 has O/C/
 structure,
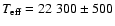 K,
K,
 ,
a thick He layer,
,
a thick He layer,
 ,
distinct from the thin layer,
,
distinct from the thin layer,
 ,
proposed by
Bradley & Winget (1994).
Montgomery, Metcalfe, & Winget's
model had
,
proposed by
Bradley & Winget (1994).
Montgomery, Metcalfe, & Winget's
model had
 ,
but Wolff et al. (2002) did not detect any
in the spectra of all the DBs they observed.
On the other hand,
Dehner & Kawaler (1995),
Brassard & Fontaine (2002), and
Fontaine & Brassard (2002) show that a thin helium
envelope is consistent with the evolutionary models starting
at PG1159 models and ending as DQs, as diffusion is still
ongoing around 25 000 K and lower temperatures.
Therefore there could be two transition
zones in the envelope, one between the He envelope and the He/C/O layer,
where diffusion is still separating the elements, and another
transition between this layer and the C/O core.
,
but Wolff et al. (2002) did not detect any
in the spectra of all the DBs they observed.
On the other hand,
Dehner & Kawaler (1995),
Brassard & Fontaine (2002), and
Fontaine & Brassard (2002) show that a thin helium
envelope is consistent with the evolutionary models starting
at PG1159 models and ending as DQs, as diffusion is still
ongoing around 25 000 K and lower temperatures.
Therefore there could be two transition
zones in the envelope, one between the He envelope and the He/C/O layer,
where diffusion is still separating the elements, and another
transition between this layer and the C/O core.
Gautschy & Althaus (2002) calculated nonadiabatic pulsation
properties of DB pulsators using evolutionary
models including the CGM full-spectrum
turbulence theory of convection and time-dependent element diffusion.
They show that up to 45 dipole modes should be excited, with periods
between 335 s and 2600 s depending on the mass of the star, though
their models did not include pulsation-convection coupling.
They obtain a trapping-cycle length of
 ,
and the quadrupole modes showed instabilities comparable to the
dipole modes.
,
and the quadrupole modes showed instabilities comparable to the
dipole modes.
Buchler et al. (1997) show that if there is a resonance between pulsation modes, even if the mode is stable, its amplitude will be necessarily nonzero. They also point out that in case of amplitude saturation, it is the smaller adjacent modes that show the largest amplitude variation, not the main modes. However, if the combination peaks are not real modes in a physical sense, just non-linear distortion by the medium, it is not clear that one would have resonant (mode-coupling) between the combination peaks and real modes.
When the Whole Earth Telescope observed GD 358 in 1990, 181
periodicities were detected, but only modes from radial order k=8to 18 were identified, most of them showing triplets, consistent with
the degree
identification.
In fact, the observed period spacing is consistent with the
measured parallax only if the
observed pulsations have degree
(Bradley & Winget 1994).
Vuille et al. (2000) studied the 342 hours of Whole Earth Telescope data obtained in 1994, showing again modes with k=8 to 18, and discovered up to 4th-order cross-frequencies in the power spectra. They compared the amplitudes and phases observed with those predicted by the pulsation-convection interaction proposed by Brickhill (1992), and found reasonable agreement.
Note that the number of nodes in the radial direction k cannot be determined observationally and rely on a detailed comparison of the observed periods with those predicted by pulsation models.
![\begin{figure}
\par\includegraphics[width=15cm,clip]{2000dft.ps}
\end{figure}](/articles/aa/full/2003/14/aa3375/img33.gif) |
Figure 1:
Fourier transform of the 2000 data set. The main power is
concentrated
in the region between 1000 Hz and 2500 Hz. The marks on top of the
graph are the asymptotic equally spaced periods prediction, and the numbers
represent the radial order k value, with Winget et al. (1994)
identification.
The vertical scale on each panel are adjusted to accommodate the large range
of amplitudes shown, and the noise level which decreases from 0.29 mma
up to 3000 Hz to 0.19 mma upwards. |
Copyright ESO 2003