A&A 387, 179-186 (2002)
DOI: 10.1051/0004-6361:20020290
V. Minier 1,2 - R. S. Booth 2
1 - Department of Astrophysics and Optics, School of Physics,
University of New South Wales, NSW 2052, Australia
2 - Onsala Space Observatory, 439 92 Onsala, Sweden
Received 7 January 2002 / Accepted 14 February 2002
Abstract
We present the results of a search for methanol maser and thermal lines
in 11 transitions in the range 85-112 GHz toward 23 star-forming regions
exhibiting class I and class II methanol masers.
The selected frequencies are 85.5, 86.6, 94.5, 95.1, 96.7 (quartet line
series), 107.0, 108.8 and 111.2 GHz. Five masers were confirmed at
107.0 GHz while new masers were found at 85.5, 86.6 and 108.8 GHz.
Many detected emission lines have a quasi-thermal origin. The detection
rates of methanol emission are high at 95.1 GHz (87%) and 96.7 GHz
(96%), satisfactory at 107.0 and 108.9 GHz (![]()
![]() )
while the
detection rates at 85.5, 94.5 and 111.3 GHz are low (
)
while the
detection rates at 85.5, 94.5 and 111.3 GHz are low (![]()
![]() ). Most
reported 95.1 GHz emission is masing.
). Most
reported 95.1 GHz emission is masing.
Key words: masers - stars: formation - stars: circumstellar matter
Methanol masers are classified in two categories based on their location
in star-forming regions (Menten 1991a) and their pumping mechanism
(Sobolev 1993). Class I methanol masers are generally observed far away
(![]() 104 AU) from the young massive stars and they are believed to
arise at the shocked interface between the outflows and the interstellar
medium. Class I methanol masers have been detected at 25.0, 36.1, 44.0,
84.5, 95.1 and 146.6 GHz (e.g. Turner et al. 1972; Haschick et al. 1990;
Plambeck & Wright 1988).
More recently, Kalenskii et al. (2001) discovered using the Onsala-20 m
telescope two class I methanol masers at 84.5 and 95.1 GHz in the
low-mass star region L-1157 mm. It might be the first detection of
a methanol maser associated with an outflow from a low-mass star.
In contrast, class II methanol masers lie in the near vicinity
(within 2000 AU) of young massive stars. For instance, the two brightest
class II methanol masers at 6.7 and 12.2 GHz (Menten
1991b; Batrla et al. 1987) are directly associated with very early
signposts of massive star formation such as the hot molecular cores, the
inner ionised part of jets and the hyper compact H II regions
(Minier et al. 2001).
104 AU) from the young massive stars and they are believed to
arise at the shocked interface between the outflows and the interstellar
medium. Class I methanol masers have been detected at 25.0, 36.1, 44.0,
84.5, 95.1 and 146.6 GHz (e.g. Turner et al. 1972; Haschick et al. 1990;
Plambeck & Wright 1988).
More recently, Kalenskii et al. (2001) discovered using the Onsala-20 m
telescope two class I methanol masers at 84.5 and 95.1 GHz in the
low-mass star region L-1157 mm. It might be the first detection of
a methanol maser associated with an outflow from a low-mass star.
In contrast, class II methanol masers lie in the near vicinity
(within 2000 AU) of young massive stars. For instance, the two brightest
class II methanol masers at 6.7 and 12.2 GHz (Menten
1991b; Batrla et al. 1987) are directly associated with very early
signposts of massive star formation such as the hot molecular cores, the
inner ionised part of jets and the hyper compact H II regions
(Minier et al. 2001).
Following the discovery of 6.7 and 12.2 GHz methanol masers, Sobolev et al. (1997) have proposed a model that predicts several other maser lines in the range 6-250 GHz. Many of these predicted transitions are effectively masing and were detected in the past ten years at 23.1, 37.7, 38.2, 38.4, 85.5, 86.6, 86.9, 107.0, 108.8, 156.6, 157.2 GHz (e.g. Menten & Batrla 1989; Haschick et al. 1989; Val'tts et al. 1995; Caswell et al. 2000) and maser lines are predicted at for example 94.5 and 111.2 GHz. New maser lines at 85.5, 86.6, 86.9 and 108.8 GHz have been detected very recently by Cragg et al. (2001) in G9.62+0.20, by Sutton et al. (2001) in W3(OH), and by Val'tts et al. (1999) in G345.01+1.79, respectively.
In the present paper, the results of a large search for new class II
maser lines toward 23 sources are given. These sources are believed to
harbour young massive stars at the earliest stage of their lives. The
frequency selection is based on Sobolev et al.'s predictions of intense
maser lines and the selected frequencies for this search are listed in
Table 1. The secondary purpose of this work is to derive the
rotational temperature and the column density of the methanol clouds
using the 96.7 GHz quartet line series as a probe. Finally, a class I
methanol maser at 95.1 GHz has also been searched in order to further
investigate the connection between the two distinct classes of masers.
All the observed transitions are listed in Table 1.
| Transition | Frequency | Eu/k | Maser (M) or |
| (MHz) | (K) | Thermal (T) | |
|
|
85568.084 | 74.7 | M |
|
|
86615.602 | 102.7 | M |
|
|
94541.778 | 131.3 | M |
|
|
95169.440 | 83.6 | M |
|
|
96739.39 | 12.6 | T |
|
|
96741.42 | 7.0 | T |
|
|
96744.58 | 20.1 | T |
|
|
96755.51 | 28.0 | T |
|
|
107013.812 | 28.3 | M |
|
|
108893.948 | 13.1 | M |
|
|
111289.515 | 102.7 | M |
The observations were carried out in November 1997, February 1998, May
1998 and November 1998 using the Onsala-20 m telescope. Only transitions
in the frequency range 85-112 GHz were observed. About
one hour per transition was spent for each source, including calibration
and integration time on source in a dual-beam switching mode. For these
observations, both the filter bank (64 MHz bandwidth and velocity
resolution of ![]() 0.75 km s-1) and the autocorrelator (40 and
80 MHz bandwidths and velocity resolutions of 0.07 and 0.15 km s-1,
respectively) were used. Due to different observing epochs and thus
weather conditions, the rms of the noise level varies from 10 to 200 mK
and is generally lower than 80 mK. Complementary observations of
C18O(1-0) and NH3(1, 1) were also carried out toward a limited
number of sources. The goal of these observations was to compare the
line-of-sight velocity of the methanol spectral features with those of
other species. The gain of the Onsala-20 m telescope is
0.75 km s-1) and the autocorrelator (40 and
80 MHz bandwidths and velocity resolutions of 0.07 and 0.15 km s-1,
respectively) were used. Due to different observing epochs and thus
weather conditions, the rms of the noise level varies from 10 to 200 mK
and is generally lower than 80 mK. Complementary observations of
C18O(1-0) and NH3(1, 1) were also carried out toward a limited
number of sources. The goal of these observations was to compare the
line-of-sight velocity of the methanol spectral features with those of
other species. The gain of the Onsala-20 m telescope is ![]() 20
Jy K-1 in the range 85-112 GHz.
20
Jy K-1 in the range 85-112 GHz.
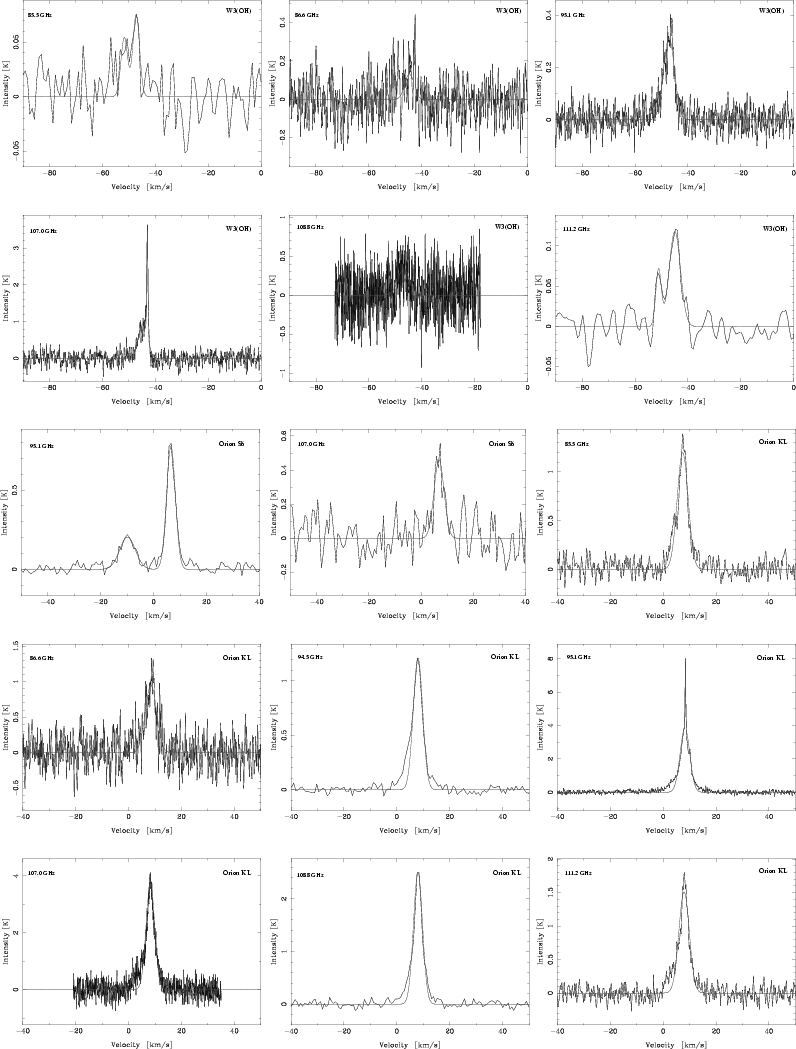
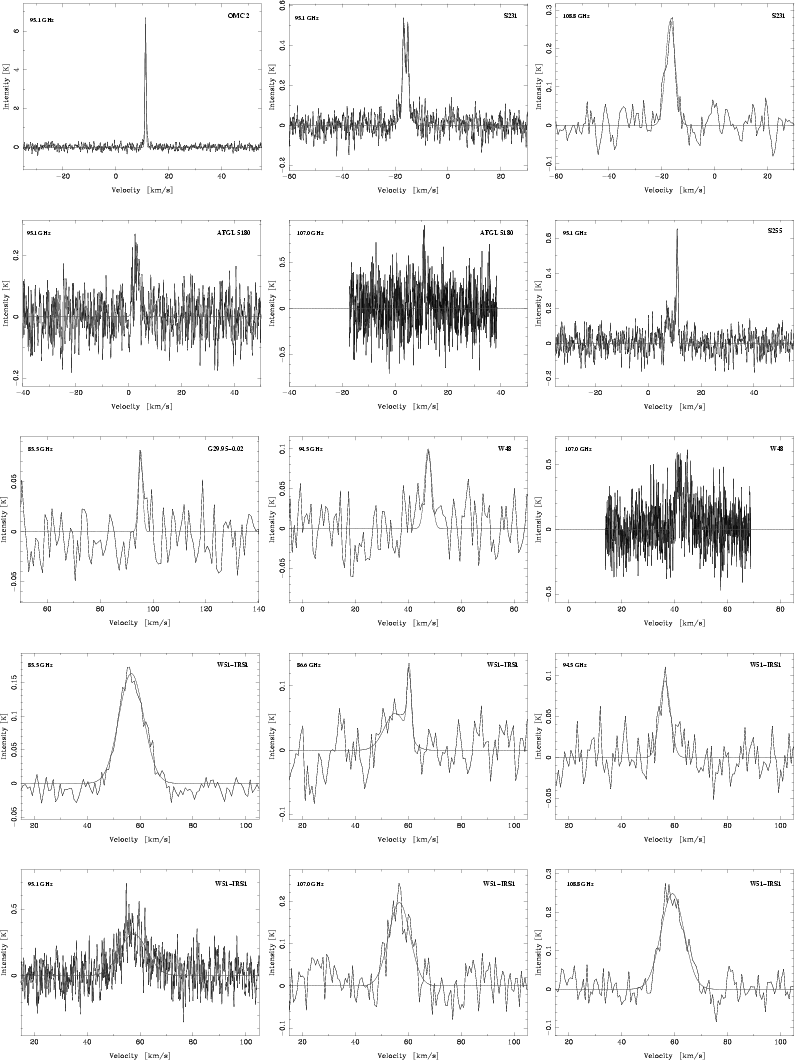
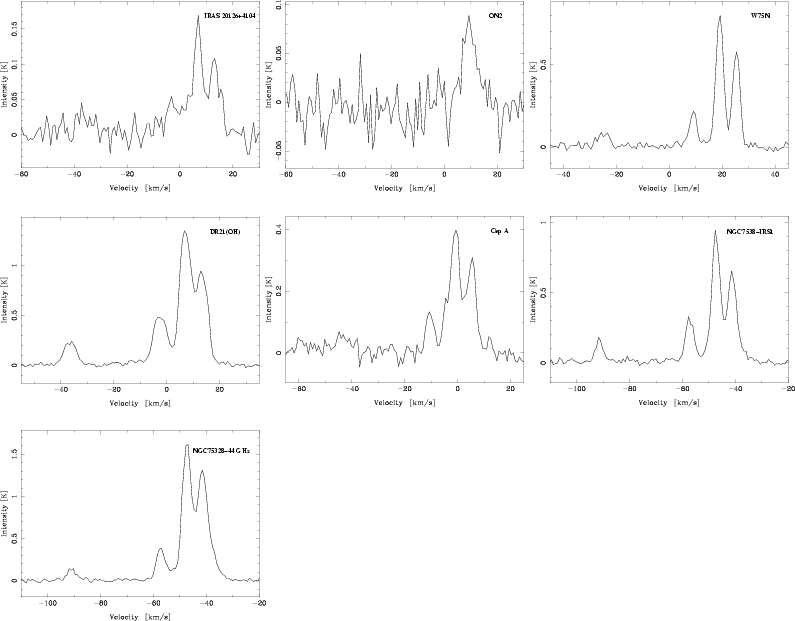
The source sample consists of 23 sources taken from Menten (1991b) and Val'tts et al. (1995). Fifteen of these sources have been imaged at 6.7 and 12.2 GHz using VLBI techniques (Minier et al. 2000, 2001). Many target sources are class II methanol maser sites, while some of them exhibit class I methanol masers. Orion KL is for example the prototypical class I methanol maser source while W3(OH) is the richest object in class II maser transitions. All these sources are believed to be closely connected to high-mass star-forming regions. The source coordinates are listed in Table 2. A summary of the detection is given in Table 2 as well. The derived Gaussian parameters and spectra of the detected lines are presented in Appendix A. Complementary information on the other molecular lines detected toward the selected methanol sources is also given in Table A.1.
Three groups of sources are seen (Table 2). The first group is
composed of sources exhibiting class II masers at one of the predicted
frequencies. They also emit 6.7 GHz masers. Nine of them are typical
class II methanol maser sources: W3(OH), AFGL 5180 (also known as S252 and G188.95+0.89), G29.95-0.02, W48,
W51-IRS1, G59.78+0.06, W75N, CepA and NGC 7538-IRS1. The tenth one,
DR21(OH), is known as a class I methanol maser source.
The second group consists of six sites exhibiting only thermal emission
in one predicted maser line transition, i.e. broad features of
![]() to 11 km s-1. Orion KL and W51e2 are typical
representatives of this group. The third group contains seven sources
without any emission detected at the predicted class II maser
frequencies. Many of these sources, however, exhibit thermal emission at
96.7 GHz. S255, MonR2 and IRAS 20126+4104 are in this group. Finally, many
sources exhibit thermal emission and/or masers at 95.1 GHz.
to 11 km s-1. Orion KL and W51e2 are typical
representatives of this group. The third group contains seven sources
without any emission detected at the predicted class II maser
frequencies. Many of these sources, however, exhibit thermal emission at
96.7 GHz. S255, MonR2 and IRAS 20126+4104 are in this group. Finally, many
sources exhibit thermal emission and/or masers at 95.1 GHz.
The most detected transitions (see Table 2) are at 95.1 GHz
(87%), 96.7 GHz (96%), 107 GHz (48%) and 108.8 GHz (43%). Class
II masers are poorly detected at all frequencies except perhaps at 107.0
GHz with 6 cases. In contrast, strong thermal methanol emission is well
present at 96.7, 107.0 and 108.8 GHz; these lines correspond to low
excitation energies with an upper energy state (
![]() )
lower than 30 K.
Thermal emission at 85.5, 94.5 and 111.2 GHz corresponding to higher
excitation lines (
)
lower than 30 K.
Thermal emission at 85.5, 94.5 and 111.2 GHz corresponding to higher
excitation lines (
![]() K) is poorly detected. Finally, 95.1 GHz
masers are massively observed in both class I and class II methanol maser
sources.
K) is poorly detected. Finally, 95.1 GHz
masers are massively observed in both class I and class II methanol maser
sources.
| Sources | Coordinates (J2000) | Frequency (GHz) | ||||||||
| RA(h m s) | Dec( |
85.5 | 86.6 | 94.5 | 95.1 | 96.7 | 107.0 | 108.8 | 111.2 | |
| W3(OH) | 02 27 04.7 | 61 52 25 | y | y(M) | n | y | y | y(M) | y | y |
| Orion S6 | 05 35 12.2 | -05 24 06 | n | n | n | y | y | y | n | n |
| Orion KL | 05 35 14.5 | -05 22 29 | y | y | y | y(M) | y | y | y | y |
| OMC2 | 05 35 27.5 | -05 09 36 | n | n | n | y(M) | y | n | n | n |
| S231 | 05 39 12.9 | 35 45 54 | n | n | n | y(M) | y | n | y | n |
| MonR2 | 06 07 46.3 | -06 23 09 | n | n | n | n | y | n | n | n |
| AFGL 51801 | 06 08 54.2 | 21 38 37 | n | n | n | y | y | y(M) | n | n |
| S255 | 06 12 56.4 | 17 59 54 | n | n | n | y(M) | y | n | n | n |
| S269 | 06 14 36.5 | 13 49 41 | n | n | n | n | n | n | n | n |
| G29.95-0.02 | 18 46 03.9 | -02 39 21 | y(M) | n | n | NO(M2) | y | n | n | n |
| W48 | 19 01 46.2 | 01 13 41 | n | n | y | NO | y | y(M) | n | n |
| W51-IRS1 | 19 23 42.1 | 14 30 41 | y | y(M) | y | y | y | y | y | n |
| W51e2 | 19 23 43.9 | 14 30 36 | y | y | y | y(M) | y | y | y | y |
| W51met1 | 19 23 43.9 | 14 29 25 | n | n | n | y(M) | y | n | n | n |
| G59.78+0.06 | 19 43 10.9 | 23 44 03 | n | n | n | y(M) | y | n | y(M) | n |
| ON1 | 20 10 09.2 | 31 31 35 | n | n | n | y(M) | y | n | y | n |
| IRAS 20126+4104 | 20 14 26.0 | 41 13 40 | n | n | n | y(M) | y | n | n | n |
| ON2 | 20 21 42.6 | 37 26 08 | n | n | n | y(M) | y | n | n | n |
| W75N | 20 38 36.8 | 42 37 59 | n | n | n | y(M) | y | NO(M1) | n | n |
| DR21(OH) | 22 39 00.7 | 42 22 51 | y(M) | n | n | y(M) | y | y | y | n |
| CepA | 22 56 18.1 | 62 01 49 | n | n | n | y(M) | y | y(M) | n | n |
| NGC 7538-IRS1 | 23 13 45.4 | 61 28 10 | n | y | n | y(M) | y | y(M) | y | n |
| NGC 7538-44GHz | 23 13 46.4 | 61 27 33 | n | n | n | y(M) | y | y | y | n |
| Total | detection | rate (%) | 26 | 22 | 17 | 87 | 96 | 48 | 43 | 13 |
| Maser | detection | rate (%) | 9 | 9 | 0 | 70 | 0 | 26 | 4 | 0 |
In this section, a more detailed analysis of the class II maser line candidates is presented. In order to be identified as maser features, detected spectral lines have to fulfil conditions related to their line width, line-of-sight velocity and intensity.
First an unsaturated maser feature is expected to have a line width
smaller than the thermal line width, i.e. smaller than 0.4 km s-1for methanol. However, a spectral feature of FWHM greater than 0.4
km s-1 could also have a maser origin. A broad spectral line could,
for example, be a blend of unresolved and narrow maser features. Such a
spectral profile has been seen in the 6.7 and
12.2 GHz methanol masers where some maser features have a FWHM of
![]() 2 km s-1 consisting of many partially resolved and narrower
features. An example of such a spectral morphology is the 12.2 GHz
methanol spectrum in NGC 7538 (Minier et al. 2002, hereafter MBC02).
2 km s-1 consisting of many partially resolved and narrower
features. An example of such a spectral morphology is the 12.2 GHz
methanol spectrum in NGC 7538 (Minier et al. 2002, hereafter MBC02).
Secondly, by comparing for a given source the peak velocity and line width of a detected line with those of the 6.7 GHz maser spectral features and thermal emission lines, it is possible to further differentiate between maser candidates and possible thermal emission. For instance, a maser feature is expected to be narrower than a quasi-thermal line.
Finally, a methanol maser is expected to be a bright radiation that
originates from very small structures (e.g. <50 mas for 12.2 GHz
masers, MBC02) seen as point sources in the large beam of a single dish
telescope (
![]() arcsec). Taking the predicted
brightness temperatures (
arcsec). Taking the predicted
brightness temperatures (
![]() K) in Sobolev et al. (1997) and
assuming that all the class II methanol masers arise from structures as
small as those producing the 12.2 GHz masers, the maser candidates could
produce antenna temperatures in the range 0.01 to 10 K. Most of the
masers should be detectable with the sensitivity of these observations
(see rms noise level in Table A.1).
K) in Sobolev et al. (1997) and
assuming that all the class II methanol masers arise from structures as
small as those producing the 12.2 GHz masers, the maser candidates could
produce antenna temperatures in the range 0.01 to 10 K. Most of the
masers should be detectable with the sensitivity of these observations
(see rms noise level in Table A.1).
Using the above criteria and Table A.1 for selecting maser lines,
new possible masers are reported at 85.5, 86.6 and 108.8 GHz while five maser
detections at 107.0 GHz in Val'tts et al. (1995) and one 86.6 GHz maser in W3(OH) (Sutton et al. 2001)
are confirmed. All the detected maser lines agree in velocity with their 6.7 GHz maser
counterparts (Table A.1). The maser spikes have FWHM of 0.11 to
1.88 km s-1.
The new maser detections are two 85.5 GHz masers in G29.95-0.02 and in DR21(OH),
one 86.6 GHz masers in W51-IRS1, and one 108.8 GHz maser in G59.78+0.06.
All these masers have a low intensity from 0.08 to 0.15 K or 1.6 to 3.0 Jy. This
corresponds to detections at a level of 3 to 5-![]() .
They need to be confirmed
and monitored to detect any variability. The detection of weak masers and more generally
the low detection rate of our survey are puzzling as many maser models predict maser
intensities exceeding our sensitivity. Given the large number of targeted sources, it
is for instance surprising that only two sources exhibit masers at 85.5 and 86.6 GHz.
Among the available maser models, new modelling by Cragg et al. (2001) shows that 86.6 GHz masers require low density
(
.
They need to be confirmed
and monitored to detect any variability. The detection of weak masers and more generally
the low detection rate of our survey are puzzling as many maser models predict maser
intensities exceeding our sensitivity. Given the large number of targeted sources, it
is for instance surprising that only two sources exhibit masers at 85.5 and 86.6 GHz.
Among the available maser models, new modelling by Cragg et al. (2001) shows that 86.6 GHz masers require low density
(![]() 108 K for <106 cm-3) while 85.5, 94.5, 108.8 and 111.2 GHz maser intensities reach their maxima
(
108 K for <106 cm-3) while 85.5, 94.5, 108.8 and 111.2 GHz maser intensities reach their maxima
(![]() 107-109 K) for density between 106 and 108 cm-3. Our generally poor detection rate would
imply very low densities in many sources to confirm the recent methanol maser models.
107-109 K) for density between 106 and 108 cm-3. Our generally poor detection rate would
imply very low densities in many sources to confirm the recent methanol maser models.
In four sources (W3(OH), W51-IRS1, G59.78-0.06 and NGC 7538-IRS1), the
masers are observed on the top of broader features that could be thermal
emission lines (Table A.1). However, Sutton et al. (2001) have
interpreted the spectral pedestal components for several methanol lines
observed toward W3(OH) as produced by a blend of weak masers. The
pedestal component would differ from the narrow spike emission through
distinct beaming effects and would originate from more spherical clumps.
If their interpretation is correct, the broad lines seen at 85.5, 86.6,
107.0, 108.8 and 111.2 GHz in W3(OH) are indeed maser lines. Sutton et
al. proposed to investigate the nature of the pedestal component with the
rotation diagram method. A similar method (Nummelin 1998) is used in this
paper to study the pedestal emission for W3(OH), W51-IRS1, G59.78-0.06
and NGC 7538-IRS1. The rotation diagrams are shown in Fig. 1. For
W3(OH), the points corresponding to the emission at 85.5, 96.7, 107.0 and
108.8 GHz fall nicely on a line. They are characterised by a thermal
distribution at a temperature of 42 K. This is similar to the rotation
temperature (
![]() K) derived by Sutton et al. from the
K) derived by Sutton et al. from the
![]() series. In contrast, the points
corresponding to the emission at 86.6, 95.1 and 111.2 GHz are off the
lines. Based on the rotation diagram, the broad components seen at 85.5,
107.0 and 108.8 GHz could have a quasi-thermal origin while those at
86.6, 95.1 and 111.2 GHz could be due to maser action. Note that
additional emission lines at 85.5 and 111.2 GHz are detected around
series. In contrast, the points
corresponding to the emission at 86.6, 95.1 and 111.2 GHz are off the
lines. Based on the rotation diagram, the broad components seen at 85.5,
107.0 and 108.8 GHz could have a quasi-thermal origin while those at
86.6, 95.1 and 111.2 GHz could be due to maser action. Note that
additional emission lines at 85.5 and 111.2 GHz are detected around
![]() km s-1. In the cases of W51-IRS1 and NGC 7538-IRS1, the
spectral pedestal component is seen at 86.6 and 107.0 GHz, respectively.
From the rotation diagrams, the pedestal components in W51-IRS1 and
NGC 7538-IRS1 are likely quasi-thermal lines. The case of G59.78-0.06 is
more complex. It is not clear whether the methanol line observed at 108.8 GHz is purely thermal
(108.8 (M+T) in Fig. 1) or whether it consists of a maser spike
(108.8 (M) in Fig. 1) on a top of a broader pedestal component
(108.8 (T) in Fig. 1).
km s-1. In the cases of W51-IRS1 and NGC 7538-IRS1, the
spectral pedestal component is seen at 86.6 and 107.0 GHz, respectively.
From the rotation diagrams, the pedestal components in W51-IRS1 and
NGC 7538-IRS1 are likely quasi-thermal lines. The case of G59.78-0.06 is
more complex. It is not clear whether the methanol line observed at 108.8 GHz is purely thermal
(108.8 (M+T) in Fig. 1) or whether it consists of a maser spike
(108.8 (M) in Fig. 1) on a top of a broader pedestal component
(108.8 (T) in Fig. 1).
Finally, assuming that all class II methanol masers originate from the
same masing regions in a given site, the angular sizes (
![]() )
of
the masing structures is approximated with those found at 12.2 GHz in
MBC02. Taking for
)
of
the masing structures is approximated with those found at 12.2 GHz in
MBC02. Taking for
![]() a mean value of 10 mas, the brightness
temperature is derived for each detected maser. The results are given in
Table 3. The brightness temperatures range from 106.2 to
107.8 K. The highest
a mean value of 10 mas, the brightness
temperature is derived for each detected maser. The results are given in
Table 3. The brightness temperatures range from 106.2 to
107.8 K. The highest
![]() are found at 107.0 GHz. These values agree with those predicted by
Sobolev et al. (1997).
are found at 107.0 GHz. These values agree with those predicted by
Sobolev et al. (1997).
To sum up the methanol lines at 85.5, 86.6, 107.0 and 108.8 GHz in
W3(OH), AFGL 5180, G29.95-0.02, W48, W51-IRS1, G59.78+0.06, DR 21(OH),
CepA and NGC 7538 and listed in Table 3, are likely maser lines.
![\begin{figure}
\par\includegraphics[width=18cm,clip]{2246fig1.eps}\end{figure}](/articles/aa/full/2002/19/aa2246/img33.gif) |
Figure 1: Rotation diagram for the pedestal components in W3(OH), W51-IRS1, G59.78-0.06 and NGC 7538-IRS1. The angular size used for the source is 34 corresponding to the telescope beam. |
| Sources | Frequency (GHz) | log ( |
| W3(OH) | 86.6 | 6.8 |
| 107.0 | 7.8 | |
| AFGL 5180 | 107.0 | 7.3 |
| G29.95-0.02 | 85.5 | 6.2 |
| W48 | 107.0 | 7.0 |
| W51-IRS1 | 86.6 | 6.4 |
| G59.78+0.06 | 108.8 | 6.4 |
| DR21(OH) | 85.5 | 6.5 |
| CepA | 107.0 | 7.7 |
| NGC 7538 | 107.0 | 6.9 |
96.7 GHz thermal lines are observed in 22 sources out of 23. For each of
these 22 sources, the rotational temperature and the beam averaged column
density of the methanol cloud are derived by applying the rotation
diagram method (Nummelin 1998) to the 96.7 GHz thermal lines only.
Methanol populations are usually separated in two species, a singly
degenerate A-species and a doubly degenerate E-species. Thus, for
excitation purposes the A- and E-species of methanol are independent
populations. However, assuming that there is equal abundance of each
species is reasonable (Blake et al. 1987). In the rotation diagram
analysis, A- and E-species are treated as a single species. The upper
level energies (![]() )
are measured from the A-species ground state and
are derived from Mekhtiev et al. (1999).
The results are given in Table 4. Additionally, the relative
abundance of methanol to molecular hydrogen is estimated. The methanol
density is calculated by dividing the beam-averaged column density by the
size of the source. In all the calculations, a source size of 34 arcsec
is assumed. This corresponds to the beam size, i.e. a beam-filling factor
of 1 is used to derive the brightness temperature (
)
are measured from the A-species ground state and
are derived from Mekhtiev et al. (1999).
The results are given in Table 4. Additionally, the relative
abundance of methanol to molecular hydrogen is estimated. The methanol
density is calculated by dividing the beam-averaged column density by the
size of the source. In all the calculations, a source size of 34 arcsec
is assumed. This corresponds to the beam size, i.e. a beam-filling factor
of 1 is used to derive the brightness temperature (![]() )
from the
antenna temperature (
)
from the
antenna temperature (
![]() ). The molecular hydrogen
density is set to 106 cm-3 or 107 cm-3 depending on the
values of R1,-1 which is the line ratio of the
). The molecular hydrogen
density is set to 106 cm-3 or 107 cm-3 depending on the
values of R1,-1 which is the line ratio of the
![]() E transition to the
E transition to the
![]() E transition (Menten et al. 1988).
E transition (Menten et al. 1988).
![]() ,
the relative methanol abundance, is thus the ratio of the
methanol density to the molecular hydrogen density.
,
the relative methanol abundance, is thus the ratio of the
methanol density to the molecular hydrogen density.
The methanol rotational temperatures are generally lower than 25 K with the exception of those in Orion KL and in W51-IRS1. The temperature values have to be taken with precaution as methanol is believed to be sub-thermally excited (Menten et al. 1988). Thus, the methanol rotational temperature only gives a lower limit of the kinematical temperature in the molecular cloud. The relatively low rotational temperature could mean that the 96.7 GHz transitions trace the outer and cool part of the methanol cloud. Such a result is not surprising. Van Dishoeck & Blake (1998) have shown, for instance, that methanol forms in hot cores around young massive stars after evaporating from the icy dust mantles at 60 K. In contrast, higher excitation methanol lines would trace the inner, dense and hot part of the molecular core as illustrated by Fig. 2. Indeed, if the methanol clouds are directly surrounding young massive stars, temperature gradients are expected in the molecular core from the hot central core to the outer molecular layer of the protostellar envelope. This has been suggested by Cesaroni et al. (1998) who found clear evidence for temperature gradients in three hot cores using NH3 as a temperature probe. For example, the temperature in G29.95-0.02 decreases from 100 K at the core central zone to 20 K at 10 000 AU away from the centre.
The derived beam-averaged column densities vary from 1014 to a few
1015 cm-2 with the exception of that in Orion KL. These values
are beam-averaged over the telescope beam and are probably
underestimated. High-resolution observations of 96.7 GHz thermal emission
in the DR21 complex showed that the typical angular size of the methanol
clouds varied between ![]()
![]() and
and ![]()
![]() at
a distance of 3 kpc (Liechti & Walmsley 1998). Moreover, if methanol
molecules coexist in hot cores with other molecules such as NH3, the
typical size of the methanol cloud can be approximated by the diameter of
hot cores which is
at
a distance of 3 kpc (Liechti & Walmsley 1998). Moreover, if methanol
molecules coexist in hot cores with other molecules such as NH3, the
typical size of the methanol cloud can be approximated by the diameter of
hot cores which is ![]() 10 000 AU. Hence, the derived column density
values have to be multiplied by a corrected factor. Assuming a size of
10 000 AU for the methanol cloud, the corrected column densities are
listed in
Table 4 in the "10 000 AU'' column. In a similar way, the
relative abundance has to be corrected by a large factor
(Table 4). After corrections, the relative abundance of methanol
is generally in the range 10-8 to 10-6.
10 000 AU. Hence, the derived column density
values have to be multiplied by a corrected factor. Assuming a size of
10 000 AU for the methanol cloud, the corrected column densities are
listed in
Table 4 in the "10 000 AU'' column. In a similar way, the
relative abundance has to be corrected by a large factor
(Table 4). After corrections, the relative abundance of methanol
is generally in the range 10-8 to 10-6.
| Sources | D |
|
|
|
R1,-1 | ||
| (kpc) | (K) | 34 | 10 000 AU | 34 | 10 000 AU | ||
| W3(OH) | 2.0 | 18 | 1.2 | 57.8 | 1.2 | 386.7 | 0.37 |
| Orion S6 | 0.5 | 21 | 1.7 | 4.8 | 6.5 | 32.1 | 0.39 |
| Orion KL | 0.5 | 137 | 42.5 | 122.9 | 17 | 821.6 | 0.88 |
| OMC 2 | 0.5 | 15 | 0.2 | 0.6 | 0.8 | 3.7 | 0.38 |
| S231 | 2.5 | 9 | 1.0 | 69.6 | 0.8 | 465.7 | 0.13 |
| MonR2 | 0.8 | 18 | 0.1 | 1.1 | 0.4 | 7.4 | 0.29 |
| AFGL 5180 | 2.2 | 8 | 0.4 | 30.0 | 0.4 | 167.0 | 0.08 |
| S255 | 2.5 | 13 | 0.1 | 10.0 | 0.4 | 67.0 | - |
| S269 | 4.0 | - | - | - | - | - | - |
| G29.95-0.02 | 7.5 | 12 | 0.3 | 178.8 | 0.07 | 1195.6 | 0.22 |
| W48 | 3.4 | 23 | 0.1 | 20.3 | 0.09 | 136.0 | 0.44 |
| W51-IRS11 | 7.5 | 55 | 4.8 | 3140.7 | 1.2 | 20999.0 | - |
| W51 e2 | 7.5 | 14 | 5.7 | 3684.9 | 1.5 | 24637.0 | 0.24 |
| W51 met1 | 7.5 | 6 | 0.5 | 313.1 | 0.1 | 2093.3 | 0.003 |
| G59.78+0.06 | 6.9 | 8 | 0.4 | 216.0 | 0.1 | 1444.0 | 0.10 |
| ON1 | 1.4 | 8 | 1.0 | 21.2 | 1.3 | 141.8 | 0.10 |
| IRAS 20126+4104 | 1.7 | 17 | 0.2 | 31.3 | 0.2 | 209.1 | 0.34 |
| ON2 | 5.0 | - | - | - | - | - | - |
| W75N | 2.0 | 10 | 0.6 | 25.8 | 0.5 | 172.4 | 0.20 |
| DR21(OH) | 3.0 | 13 | 1.9 | 200.2 | 1.3 | 1338.7 | 0.22 |
| Cep A | 0.7 | 12 | 0.4 | 2.0 | 1.0 | 13.5 | 0.22 |
| NGC 7538-IRS1 | 2.7 | 13 | 0.9 | 72.2 | 0.6 | 483.0 | 0.23 |
| NGC 7538-44 GHz | 2.7 | 8 | 1.4 | 116.2 | 1.0 | 776.7 | 0.08 |
![\begin{figure}
\par\includegraphics[width=8.8cm,clip]{2246fig2.eps}\end{figure}](/articles/aa/full/2002/19/aa2246/img38.gif) |
Figure 2: Rotation diagram for W 51e2. Two rotational temperatures are used to fit the data suggesting the presence of cold and hot methanol gas. |
95.1 GHz methanol transition is detected toward 20 sources out of 23. In
16 sources this transition is masing while thermal emission is found in
13 sources. In 9 sources both 95.1 GHz maser and thermal emission are
observed. The
![]() of thermal emission generally corresponds (9 sources out of 13)
to the systemic line-of-sight velocity measured with NH3, CS or
C18O lines (Table A.1). 12 sources exhibit both 6.7 GHz and
95.1 GHz methanol masers (Table A.1). For 7 of them, the 95.1 GHz
maser peaks at velocities within the line-of-sight velocity range of the
6.7 GHz masers. In 9 sources 95.1 GHz masers peak at velocities within 1
km s-1 around the systemic velocity. Finally, the 6.7 GHz maser
velocity is blue shifted or red shifted with respect to systemic velocity
in 6 sources: S231, AFGL 5180, S255, IRAS 20126+4104, W75N and CepA.
According to the classification of methanol masers, class II 6.7 GHz
masers are expected to originate near the young stellar object and thus
at velocities around the systemic velocity. Class I 95.1 GHz masers are
expected to originate in outflows far away from the young star and thus
at velocities blue shifted or red shifted with respect to the systemic
velocity. Our results contradict these expectations in many cases.
of thermal emission generally corresponds (9 sources out of 13)
to the systemic line-of-sight velocity measured with NH3, CS or
C18O lines (Table A.1). 12 sources exhibit both 6.7 GHz and
95.1 GHz methanol masers (Table A.1). For 7 of them, the 95.1 GHz
maser peaks at velocities within the line-of-sight velocity range of the
6.7 GHz masers. In 9 sources 95.1 GHz masers peak at velocities within 1
km s-1 around the systemic velocity. Finally, the 6.7 GHz maser
velocity is blue shifted or red shifted with respect to systemic velocity
in 6 sources: S231, AFGL 5180, S255, IRAS 20126+4104, W75N and CepA.
According to the classification of methanol masers, class II 6.7 GHz
masers are expected to originate near the young stellar object and thus
at velocities around the systemic velocity. Class I 95.1 GHz masers are
expected to originate in outflows far away from the young star and thus
at velocities blue shifted or red shifted with respect to the systemic
velocity. Our results contradict these expectations in many cases.
The fact that 6.7 and 95.1 GHz methanol masers arise at similar
velocities in many sources is really puzzling. Could they both originate in the same region?
New VLBI evidence at 6.7 and 12.2 GHz suggest that class II methanol masers do form in
the inner part of outflows (Minier et al. 2001) which are also the proposed habitat of class I
methanol masers.
Unfortunately, single dish observations do not give any precise information on the position of the
95.1 GHz emission relatively to the 6.7 GHz maser and coincidence in
velocity does not necessarily imply coincidence in position. For
instance, the major 95.1 GHz maser spike in NGC 7538-IRS1 is also seen in
NGC 7538-44 GHz at the same velocity (-57.51 km s-1), but with a
stronger intensity and 40 arcsec south to IRS1. Thus strong emission seen
with a single dish telescope at two nearby positions (within ![]() a telescope beam)
and at a same velocity may originate from only one site.
It is then impossible to bring any firm conclusion on any spatial
relationship between class I and class II masers. Interferometry is needed
to solve this puzzle with higher resolution.
a telescope beam)
and at a same velocity may originate from only one site.
It is then impossible to bring any firm conclusion on any spatial
relationship between class I and class II masers. Interferometry is needed
to solve this puzzle with higher resolution.
In Sect. 4, methanol relative abundances of 10-8 to 10-6 were
derived. These values are in good agreement with recent observational and
theoretical results by Rodgers & Charnley (2001) who have modelled
the chemistry at the earliest stages of massive star formation. Assuming
initial methanol abundance of ![]() 10-6, they showed that methanol
abundance in a molecular core evolves depending on the initial ammonia
abundance and the temperature. Interestingly, their theoretical model
suggests that O-bearing and N-bearing molecules can coexist within dense
molecular cores and that the abundance ratio of specific O-bearing
molecules to N-bearing species could potentially give the age of the core
and thus the age of the associated young stellar object. The most
interesting N-bearing molecules are NH3, HC3N and CH3CN.
Kalenskii et al. (2000) observed CH3CN in many methanol sources
presented in this paper. Using the Gaussian parameters of the 110.3 GHz
CH3CN lines derived by Kalenskii et al., the column density is
estimated with the rotation diagram method (Nummelin 1998). The results are
given in Table 5 for the sources where CH3CN was detected
(see also Table A.1). The column density values are
beam-averaged. If methanol and methyl cyanide are present over the same
regions in hot cores, the ratio of their densities is simply the ratio of
their column densities (Table 5). This ratio is compared to the
results from Rodgers & Charnley with ammonia injected and T=300 K
(Fig. 4 in Rodgers & Charnley 2001) and the deduced ages are given in
Table 5. The ages range between 0.5 and
10-6, they showed that methanol
abundance in a molecular core evolves depending on the initial ammonia
abundance and the temperature. Interestingly, their theoretical model
suggests that O-bearing and N-bearing molecules can coexist within dense
molecular cores and that the abundance ratio of specific O-bearing
molecules to N-bearing species could potentially give the age of the core
and thus the age of the associated young stellar object. The most
interesting N-bearing molecules are NH3, HC3N and CH3CN.
Kalenskii et al. (2000) observed CH3CN in many methanol sources
presented in this paper. Using the Gaussian parameters of the 110.3 GHz
CH3CN lines derived by Kalenskii et al., the column density is
estimated with the rotation diagram method (Nummelin 1998). The results are
given in Table 5 for the sources where CH3CN was detected
(see also Table A.1). The column density values are
beam-averaged. If methanol and methyl cyanide are present over the same
regions in hot cores, the ratio of their densities is simply the ratio of
their column densities (Table 5). This ratio is compared to the
results from Rodgers & Charnley with ammonia injected and T=300 K
(Fig. 4 in Rodgers & Charnley 2001) and the deduced ages are given in
Table 5. The ages range between 0.5 and
![]() years which is
consistent with the expected age of young massive stars. This age
estimate is uncertain. Nonetheless, it is interesting to note that W3(OH)
is older than IRAS 20126+4104 as expected since IRAS 20126+4104 is in an
earlier stage (hot core) than W3(OH) (UC H II). From the
mid-infrared fluxes in Table 5, there is no apparent correlation
between the mid-infrared luminosity and the estimated ages.
years which is
consistent with the expected age of young massive stars. This age
estimate is uncertain. Nonetheless, it is interesting to note that W3(OH)
is older than IRAS 20126+4104 as expected since IRAS 20126+4104 is in an
earlier stage (hot core) than W3(OH) (UC H II). From the
mid-infrared fluxes in Table 5, there is no apparent correlation
between the mid-infrared luminosity and the estimated ages.
| Sources |
|
[CH3OH]/ | Age | Mid-IR fluxes (Jy) | Source | |
| (1015 cm-2) | [CH3CN] | (105 yr) | 6.8-10.8 |
18.2-25.2 |
Type | |
| W3(OH) | 0.12 | 10 | 1.0 | 69 | 57 | UC H II |
| Orion S6 | 0.07 | 23 | 0.7 | NO | NO | ? |
| Orion KL | 0.781 | 54 | 0.5 | NO | NO | HC |
| S231 | 0.02 | 44 | 0.5 | - | 31 | ? |
| W51e2 | 1.56 | 4 | 2.0 | 12 | 294 | HC+UC H II |
| ON1 | 0.01 | 62 | 0.5 | 0.5 | 24 | ? |
| IRAS 20126+4104 | 0.0072 | 25 | 0.7 | 0.8 | 53 | HC |
| W75N | 0.03 | 19 | 0.8 | 15 | 476 | UC H II |
| DR21(OH) | 0.06 | 34 | 0.6 | 9 | 88 | HC |
| CepA | 0.01 | 30 | 0.6 | 5 | 358 | UC H II |
| NGC 7538-IRS1 | 0.02 | 43 | 0.5 | 165 | 1582 | UC H II |
Many assumptions could obviously be sources of errors in our
calculations. First, 96.7 GHz methanol and 110.3 GHz methyl cyanide lines
are assumed to be optically thin for the purpose of the rotation diagram
method. This is uncertain and more refined modelling methods are needed
to derive
![]() and N. Secondly, the sizes of the CH3OH and
CH3CN cores are assumed to be equal. CH3CN could be more confined
in the hot core than CH3OH and then the density ratio would decrease.
Finally, the contamination by other young stellar objects within the
large beam of the single dish telescope certainly affects the data. This
is likely the case for Orion, W51, W75N, CepA and NGC 7538 where many
young massive stars coexist within
and N. Secondly, the sizes of the CH3OH and
CH3CN cores are assumed to be equal. CH3CN could be more confined
in the hot core than CH3OH and then the density ratio would decrease.
Finally, the contamination by other young stellar objects within the
large beam of the single dish telescope certainly affects the data. This
is likely the case for Orion, W51, W75N, CepA and NGC 7538 where many
young massive stars coexist within ![]() 30 arcsec. Clearly, these
results have to be seen as preparatory work to higher resolution
observations.
30 arcsec. Clearly, these
results have to be seen as preparatory work to higher resolution
observations.
23 star-forming regions have been searched for new class II methanol maser lines and thermal emission in eleven transitions. This work gives a coherent and global overview of the methanol lines present in massive star-forming regions within the range 85-112 GHz. Five masers at 107.0 GHz detected by Val'tts et al. (1995) have been confirmed. New masers at 85.5, 86.6, 95.1 and 108.8 GHz have been detected. However, new class II masers are rare phenomena, and most of the sources exhibit thermal emission or no emission at the frequencies of predicted masers.
Finally, assuming that methanol emission originates in molecular cores surrounding
young massive stars, their ages is estimated to ![]() 105 years. Future
interferometric observations are needed to better constrain the size, the maser
brightness temperature, rotational temperature, column densities and ages of the
methanol clouds.
105 years. Future
interferometric observations are needed to better constrain the size, the maser
brightness temperature, rotational temperature, column densities and ages of the
methanol clouds.
Acknowledgements
The authors thank the Onsala-20 m telescope staff as well as Jiyune Yi and Michele Pestalozzi for their help during the observations. We also thank Dinah Cragg for her valuable advice on methanol line analysis.
| Source | Freq. |
|
|
rms |
|
Line | Other molecular lines | ||
| (GHz) | (km s-1) | (K) | (K) | (km s-1) | (K km s-1) | type | Molecule (freq.) |
|
|
| W3(OH) | 85.568 | -51.70 | 0.05 | 0.02 | 3.00 | 0.16 | T | CH3OH(6.7 GHz)1 | -48 to -41 |
| -47.20 | 0.07 | 0.02 | 3.00 | 0.22 | T | CH3OH(44.0 GHz)2 | -46.49 | ||
| 86.615 | -44.65 | 0.13 | 0.10 | 4.04 | 0.56 | T, M? | CS(48.9 GHz)3 | -46.77 | |
| -42.70 | 0.28 | 0.10 | 0.54 | 0.16 | M | NH3(23.7 GHz)3 | -47.59 | ||
| 95.169 | -47.10 | 0.31 | 0.04 | 4.90 | 1.62 | T | C18O(109.8 GHz)4 | -47.40 | |
| 96.755 | -46.31 | 0.27 | 0.01 | 3.94 | 1.13 | T | CH3CN(91.9 GHz)5 | -47.5 | |
| 96.745 | -46.19 | 0.52 | 0.01 | 3.45 | 1.91 | T | CH3CN(110.3 GHz)5 | -47.5 | |
| 96.741 | -46.26 | 1.20 | 0.01 | 3.45 | 4.41 | T | |||
| 96.739 | -46.15 | 0.82 | 0.01 | 3.45 | 3.01 | T | |||
| 107.013 | -44.65 | 0.94 | 0.15 | 4.04 | 4.04 | T | |||
| -42.97 | 2.89 | 0.15 | 0.54 | 1.66 | M | ||||
| 108.893 | -46.90 | 0.33 | 0.25 | 5.11 | 1.79 | T | |||
| 111.289 | -51.10 | 0.07 | 0.03 | 2.45 | 0.18 | T | |||
| -44.95 | 0.12 | 0.03 | 5.05 | 0.65 | T, M? | ||||
| Orion S6 | 95.169 | -9.27 | 0.20 | 0.02 | 6.96 | 1.48 | T | CH3OH(44.0 GHz)2 | 6.70 |
| 6.55 | 0.77 | 0.02 | 3.93 | 3.22 | T | NH3(23.7 GHz)6 | 6.50 | ||
| 96.755 | 6.85 | 0.33 | 0.02 | 4.19 | 1.47 | T | C18O(109.8 GHz)7 | 6.50 | |
| 96.745 | 6.96 | 0.56 | 0.02 | 3.94 | 2.35 | T | CH3CN(91.9 GHz)5 | 6.8 | |
| 96.741 | 6.89 | 1.10 | 0.02 | 3.94 | 4.61 | T | CH3CN(110.3 GHz)5 | 6.9 | |
| 96.739 | 6.39 | 0.80 | 0.02 | 4.43 | 3.77 | T | |||
| 107.013 | 6.88 | 0.46 | 0.10 | 4.52 | 2.21 | T | |||
| Orion KL | 85.568 | 7.39 | 1.20 | 0.08 | 4.89 | 6.25 | T | CH3OH(44.0 GHz)2 | 8.30 to 8.57 |
| 86.615 | 8.44 | 0.95 | 0.13 | 5.03 | 5.09 | T | CS(48.9 GHz)3 | 9.03 | |
| 94.542 | 8.00 | 1.21 | 0.02 | 4.20 | 5.41 | T | NH3(23.7 GHz)3 | 8.23 | |
| 95.169 | 8.24 | 3.86 | 0.08 | 4.29 | 17.63 | T | C18O(109.8 GHz)7 | 8.00 | |
| 8.43 | 4.21 | 0.08 | 0.29 | 1.30 | M | CH3CN(91.9 GHz)8 | 8.00 | ||
| 96.755 | 8.08 | 1.64 | 0.02 | 3.94 | 6.88 | T | |||
| 96.745 | 8.18 | 2.09 | 0.02 | 3.94 | 8.77 | T | |||
| 96.741 | 8.49 | 2.36 | 0.02 | 3.94 | 9.90 | T | |||
| 96.739 | 8.35 | 2.12 | 0.02 | 3.69 | 8.33 | T | |||
| 107.013 | 8.22 | 3.75 | 0.25 | 3.83 | 15.29 | T | |||
| 108.893 | 8.01 | 2.50 | 0.05 | 4.03 | 10.72 | T | |||
| 111.289 | 7.92 | 1.51 | 0.09 | 4.65 | 7.47 | T | |||
| OMC2 | 95.169 | 11.23 | 6.36 | 0.12 | 0.53 | 3.59 | M | CH3OH(44.0 GHz)2 | 11.30,11.67 |
| 96.755 | 11.48 | 0.08 | 0.03 | 2.46 | 0.21 | T | C18O(109.8 GHz)9 | 11.00 | |
| 96.745 | 11.34 | 0.09 | 0.03 | 2.22 | 0.21 | T | CH3CN(110 GHz)5 | 11.20 | |
| 96.741 | 11.52 | 0.38 | 0.03 | 2.22 | 0.90 | T | |||
| 96.739 | 11.51 | 0.23 | 0.03 | 2.22 | 0.54 | T | |||
| S231 | 95.169 | -16.63 | 0.41 | 0.04 | 1.17 | 0.51 | M | CH3OH(6.7 GHz)1 | -15 to -11 |
| -16.00 | 0.10 | 0.04 | 4.00 | 0.43 | T | CH3OH(44.0 GHz)10 | -16.67 | ||
| -15.16 | 0.42 | 0.04 | 0.73 | 0.33 | M | NH3(23.7 GHz)6 | -16.22 | ||
| 96.755 | -15.94 | 0.11 | 0.02 | 4.43 | 0.52 | T | C18O(109.8 GHz)6 | -16.70 | |
| 96.745 | -16.44 | 0.27 | 0.02 | 4.68 | 1.35 | T | CH3CN(91.9 GHz)5 | -15.60 | |
| 96.741 | -16.50 | 1.06 | 0.02 | 4.68 | 5.28 | T | CH3CN(110.3 GHz)5 | -15.90 | |
| 96.739 | -16.89 | 0.77 | 0.02 | 4.92 | 4.03 | T | |||
| 108.893 | -16.72 | 0.27 | 0.03 | 4.33 | 1.24 | T | |||
| MonR2 | 96.755 | 10.54 | 0.09 | 0.02 | 1.23 | 0.12 | T | CH3OH(6.7 GHz)1 | 9 to 14 |
| 96.745 | 9.91 | 0.08 | 0.02 | 3.20 | 0.27 | T | CS(48.9 GHz)3 | 11.15 | |
| 96.741 | 10.94 | 0.19 | 0.02 | 2.21 | 0.45 | T | NH3(23.7 GHz)3 | 11.14 | |
| 96.739 | 10.93 | 0.14 | 0.02 | 2.71 | 0.40 | T | C18O(109.8 GHz)11 | 10.72 | |
| AFGL 5180 | 95.169 | 3.05 | 0.17 | 0.06 | 2.42 | 0.44 | T | CH3OH(6.7 GHz)1 | 8 to 12 |
| 96.755 | 2.72 | 0.07 | 0.02 | 2.21 | 0.16 | T | CS(48.9 GHz)3 | 3.15 | |
| 96.745 | 3.31 | 0.17 | 0.02 | 2.71 | 0.49 | T | NH3(23.7 GHz)11 | 3.70 | |
| 96.741 | 3.23 | 0.87 | 0.02 | 2.95 | 2.73 | T | C18O(109.8 GHz)11 | 3.19 | |
| 96.739 | 3.23 | 0.63 | 0.02 | 2.95 | 1.98 | T | CH3CN(110 GHz)5 | 2.9 | |
| 107.013 | 10.65 | 0.77 | 0.20 | 0.23 | 0.19 | M | |||
| 10.91 | 0.75 | 0.20 | 0.11 | 0.09 | M | ||||
| 11.15 | 0.87 | 0.20 | 0.14 | 0.13 | M | ||||
| 11.39 | 0.51 | 0.20 | 0.24 | 0.13 | M | ||||
| Source | Freq. |
|
|
rms |
|
Line | Other molecular lines | ||
| (GHz) | (km s-1) | (K) | (K) | (km s-1) | (K km s-1) | type | Molecule (freq.) |
|
|
| S255 | 95.169 | 7.51 | 0.17 | 0.05 | 2.04 | 0.37 | T | CH3OH(6.7 GHz)1 | 1 to 6 |
| 11.00 | 0.61 | 0.05 | 0.73 | 0.47 | M | CH3OH(44.0 GHz)2 | 11.18 | ||
| 10.13 | 0.23 | 0.05 | 0.38 | 0.09 | M | CS(48.9 GHz)3 | 7.52 | ||
| 96.745 | 7.32 | 0.09 | 0.02 | 2.46 | 0.24 | T | NH3(23.7 GHz)3 | 7.47 | |
| 96.741 | 7.51 | 0.19 | 0.02 | 3.20 | 0.65 | T | C18O(109.8 GHz)11 | 6.65 | |
| 96.739 | 7.12 | 0.12 | 0.02 | 3.45 | 0.44 | T | |||
| G29.95-0.02 | 85.568 | 95.25 | 0.08 | 0.02 | 1.88 | 0.16 | M | CH3OH(6.7 GHz)1 | 95 to 100 |
| 95.16912 | 96.2 | 0.08 | 0.02 | 0.70 | 0.06 | M | CH3OH(44.0 GHz)10 | 98.5 | |
| 97.1 | 0.09 | 0.02 | 0.70 | 0.07 | M | NH3(23.7 GHz)3 | 97.55 | ||
| 98.7 | 0.08 | 0.02 | 1.10 | 0.09 | M | C18O(109.8 GHz)11 | 97.38 | ||
| 100.4 | 0.07 | 0.02 | 0.90 | 0.07 | M | CH3CN(110.3 GHz)5 | 97.60 | ||
| 96.755 | 97.87 | 0.06 | 0.02 | 3.44 | 0.22 | T | |||
| 96.745 | 97.37 | 0.11 | 0.02 | 3.19 | 0.37 | T | |||
| 96.741 | 98.05 | 0.32 | 0.02 | 3.94 | 1.34 | T | |||
| 96.739 | 97.67 | 0.24 | 0.02 | 3.94 | 1.01 | T | |||
| W48 | 94.542 | 47.54 | 0.10 | 0.03 | 3.08 | 0.33 | T | CH3OH(6.7 GHz)1 | 39 to 47 |
| 96.755 | 41.72 | 0.04 | 0.01 | 3.20 | 0.14 | T | CS(48.9 GHz)3 | 43.08 | |
| 96.745 | 42.81 | 0.06 | 0.01 | 2.95 | 0.19 | T | NH3(23.7 GHz)11 | 42.88 | |
| 96.741 | 43.62 | 0.13 | 0.01 | 2.71 | 0.37 | T | C18O(109.8 GHz)11 | 43.36 | |
| 96.739 | 43.35 | 0.09 | 0.01 | 3.20 | 0.31 | T | CH3CN(110.3 GHz)5 | 43.90 | |
| 107.013 | 40.42 | 0.38 | 0.14 | 0.23 | 0.09 | M | |||
| 40.93 | 0.23 | 0.14 | 0.15 | 0.04 | M | ||||
| 41.38 | 0.36 | 0.14 | 1.30 | 0.50 | M | ||||
| 42.38 | 0.43 | 0.14 | 0.46 | 0.21 | M | ||||
| 44.81 | 0.51 | 0.14 | 0.58 | 0.31 | M | ||||
| 46.20 | 0.30 | 0.14 | 0.64 | 0.20 | M | ||||
| W51-IRS1 | 85.568 | 56.70 | 0.16 | 0.01 | 11.04 | 1.88 | T | C18O(109.8 GHz)11 | 61.46 |
| 86.615 | 55.12 | 0.06 | 0.03 | 9.73 | 0.62 | T | NH3(23.7 GHz)11 | 58.25 | |
| 60.34 | 0.11 | 0.03 | 1.81 | 0.21 | M | ||||
| 94.542 | 56.38 | 0.10 | 0.02 | 4.86 | 0.52 | T | |||
| 95.169 | 57.49 | 0.31 | 0.10 | 11.98 | 3.95 | T | |||
| 96.755 | 57.78 | 0.17 | 0.02 | 9.60 | 1.74 | T | |||
| 107.013 | 56.64 | 0.19 | 0.03 | 9.53 | 1.93 | T | |||
| 108.893 | 59.21 | 0.25 | 0.03 | 10.28 | 2.74 | T | |||
| W51e2 | 85.568 | 55.34 | 0.21 | 0.03 | 9.41 | 2.10 | T | CH3OH(6.7 GHz)13 | 51 to 60 |
| 86.615 | 56.93 | 0.27 | 0.08 | 8.94 | 2.57 | T | CH3OH(44.0 GHz)2 | 48.88,55.40 | |
| 94.542 | 56.19 | 0.22 | 0.04 | 8.94 | 2.09 | T | CS(48.9 GHz)3 | 56.88 | |
| 95.169 | 48.40 | 0.47 | 0.12 | 1.28 | 0.64 | M | NH3(23.7 GHz)3 | 54.80 | |
| 55.79 | 1.65 | 0.12 | 7.45 | 13.08 | T | C18O(109.8 GHz)11 | 61.46 | ||
| 96.755 | 56.03 | 0.63 | 0.02 | 7.39 | 4.96 | T | CH3CN(91.9 GHz)5 | 57.3 | |
| 96.745 | 55.89 | 1.06 | 0.02 | 6.89 | 7.77 | T | CH3CN(110.3 GHz)5 | 56.8 | |
| 96.741 | 56.94 | 2.16 | 0.02 | 9.85 | 22.65 | T | |||
| 96.739 | 54.83 | 2.22 | 0.02 | 8.62 | 20.37 | T | |||
| 107.013 | 56.06 | 0.72 | 0.14 | 8.38 | 6.42 | T | |||
| 108.893 | 55.98 | 0.83 | 0.19 | 8.47 | 7.48 | T | |||
| 111.289 | 56.11 | 0.29 | 0.06 | 10.83 | 3.34 | T | |||
| W51met1 | 95.169 | 53.72 | 0.39 | 0.08 | 0.34 | 0.14 | M | CH3OH(44.0 GHz)2 | 56.00 |
| 55.62 | 0.10 | 0.08 | 1.69 | 0.18 | M | ||||
| 56.02 | 0.19 | 0.08 | 0.21 | 0.04 | M | ||||
| 96.755 | 54.81 | 0.03 | 0.02 | 2.19 | 0.07 | T | |||
| 96.745 | 54.87 | 0.13 | 0.02 | 2.84 | 0.39 | T | |||
| 96.741 | 55.15 | 0.62 | 0.02 | 4.38 | 2.89 | T | |||
| 96.739 | 54.65 | 0.45 | 0.02 | 4.37 | 2.09 | T | |||
| G59.78-0.06 | 95.169 | 21.78 | 0.27 | 0.06 | 0.60 | 0.17 | M | CH3OH(6.7 GHz)1 | 15 to 28 |
| 96.755 | 22.15 | 0.07 | 0.02 | 2.21 | 0.16 | T | NH3(23.7 GHz)11 | 22.58 | |
| 96.745 | 22.57 | 0.21 | 0.02 | 2.21 | 0.49 | T | C18O(109.8 GHz)11 | 23.57 | |
| 96.741 | 22.75 | 0.92 | 0.02 | 2.46 | 2.41 | T | |||
| 96.739 | 22.62 | 0.68 | 0.02 | 2.21 | 1.60 | T | |||
| 108.893 | 21.79 | 0.11 | 0.05 | 2.37 | 0.28 | T | |||
| 22.83 | 0.13 | 0.05 | 0.85 | 0.12 | M | ||||
| Source | Freq. |
|
|
rms |
|
Line | Other molecular lines | ||
| (GHz) | (km s-1) | (K) | (K) | (km s-1) | (K km s-1) | type | Molecule (freq.) |
|
|
| ON1 | 95.169 | 11.29 | 0.14 | 0.05 | 4.98 | 0.74 | T | CH3OH(6.7 GHz)1 | -1 to 16 |
| 11.79 | 0.28 | 0.05 | 0.74 | 0.22 | M | CH3OH(44.0 GHz)2 | 11.42, 12.04 | ||
| 96.755 | 11.85 | 0.13 | 0.02 | 2.95 | 0.41 | T | CS(48.9 GHz)3 | 11.27 | |
| 96.745 | 12.07 | 0.25 | 0.02 | 4.92 | 1.31 | T | NH3(23.7 GHz)3 | 11.00 | |
| 96.741 | 11.15 | 1.00 | 0.02 | 4.92 | 5.24 | T | C18O(109.8 GHz)11 | 11.27 | |
| 96.739 | 10.89 | 0.77 | 0.02 | 4.92 | 4.03 | T | CH3CN(110.3 GHz)5 | 11.90 | |
| 108.893 | 11.37 | 0.21 | 0.02 | 3.81 | 0.85 | T | |||
| IRAS 20126 | 95.169 | -1.32 | 0.23 | 0.05 | 0.31 | 0.08 | M | CH3OH(6.7 GHz)1 | -7 to -5 |
| +4104 | -2.36 | 0.23 | 0.05 | 0.63 | 0.15 | M | CH3OH(44.0 GHz)14 | -2.33 to -4.49 | |
| -3.33 | 0.46 | 0.05 | 0.77 | 0.38 | M | NH3(23.7 GHz)16 | -3.90 | ||
| -4.41 | 0.14 | 0.05 | 0.42 | 0.06 | M | C18O(109.8 GHz)11 | -2.81 | ||
| -4.77 | 0.16 | 0.05 | 0.22 | 0.04 | M | CH3CN(91.9 GHz)15 | -3.50 | ||
| 96.755 | -3.23 | 0.04 | 0.01 | 3.94 | 0.17 | T | |||
| 96.745 | -3.12 | 0.05 | 0.01 | 4.19 | 0.22 | T | |||
| 96.741 | -2.94 | 0.16 | 0.01 | 3.69 | 0.63 | T | |||
| 96.739 | -3.20 | 0.11 | 0.01 | 4.19 | 0.49 | T | |||
| ON2 | 95.169 | -2.36 | 0.24 | 0.04 | 0.49 | 0.13 | M | CH3OH(6.7 GHz)1 | -11 to 3 |
| -1.53 | 0.19 | 0.04 | 0.89 | 0.18 | M | CH3OH(44.0 GHz)10 | -2.00 | ||
| 96.741 | -0.56 | 0.09 | 0.02 | 5.94 | 0.57 | T | CS(48.9 GHz)5 | -0.62 | |
| NH3(23.7 GHz)5 | -0.14 | ||||||||
| W75N | 95.169 | 8.70 | 0.22 | 0.05 | 3.89 | 0.91 | T | CH3OH(6.7 GHz)1 | 3 to 10 |
| 8.77 | 0.54 | 0.05 | 0.22 | 0.13 | M | CH3OH(44.0 GHz)2 | 8.92 | ||
| 96.755 | 8.70 | 0.09 | 0.01 | 4.12 | 0.39 | T | CS(48.9 GHz)3 | 9.49 | |
| 96.745 | 9.05 | 0.22 | 0.01 | 3.20 | 0.75 | T | NH3(23.7 GHz)11 | 10.01 | |
| 96.741 | 9.35 | 0.81 | 0.01 | 3.69 | 3.18 | T | C18O(109.8 GHz)11 | 10.02 | |
| 96.739 | 9.34 | 0.58 | 0.01 | 3.20 | 1.98 | T | CH3CN(110.3 GHz)5 | 9.4 | |
| 107.01317 | 8.40 | 0.25 | 0.02 | 6.20 | 1.64 | T | |||
| DR21(OH) | 85.568 | -2.81 | 0.15 | 0.03 | 0.39 | 0.06 | M | CH3OH(6.7 GHz)1 | -7 to 8 |
| 95.169 | -4.87 | 0.64 | 0.07 | 2.73 | 1.86 | T | CH3OH(44.0 GHz)2 | -4.80, -1.10, 0.36 | |
| -3.31 | 0.41 | 0.07 | 0.95 | 0.41 | M | NH3(23.7 GHz)18 | -5.00 to -0.70 | ||
| -1.47 | 1.24 | 0.07 | 1.79 | 2.36 | M | C18O(109.8 GHz)19 | -2.80 | ||
| 0.15 | 8.18 | 0.07 | 0.81 | 7.05 | M | CH3CN(91.9 GHz)5 | -3.0 | ||
| 96.755 | -2.54 | 0.25 | 0.01 | 5.42 | 1.44 | T | CH3CN(110.3 GHz)5 | -3.1 | |
| 96.745 | -2.43 | 0.49 | 0.01 | 6.40 | 3.34 | T | |||
| 96.741 | -2.62 | 1.36 | 0.01 | 5.66 | 8.19 | T | |||
| 96.739 | -3.12 | 0.94 | 0.01 | 6.40 | 6.40 | T | |||
| 107.013 | -3.05 | 0.14 | 0.04 | 5.70 | 0.85 | T | |||
| 108.893 | -2.83 | 0.36 | 0.14 | 4.96 | 1.90 | T | |||
| CepA | 95.169 | -12.36 | 0.14 | 0.05 | 1.43 | 0.21 | T? | CH3OH(6.7 GHz)1 | -5 to -1 |
| -10.26 | 0.18 | 0.05 | 1.24 | 0.24 | M? | CS(48.9 GHz)3 | -10.68 | ||
| 96.755 | -10.56 | 0.06 | 0.02 | 4.18 | 0.27 | T | NH3(23.7 GHz)11 | -9.55 | |
| 96.745 | -10.58 | 0.13 | 0.02 | 3.94 | 0.55 | T | C18O(109.8 GHz)11 | -10.84 | |
| 96.741 | -10.52 | 0.40 | 0.02 | 4.18 | 1.78 | T | CH3CN(91.9 GHz)5 | -10.3 | |
| 96.739 | -10.78 | 0.31 | 0.02 | 3.69 | 1.22 | T | CH3CN(110.3 GHz)5 | -9.9 | |
| 107.013 | -1.68 | 2.46 | 0.13 | 0.32 | 0.84 | M | |||
| -2.11 | 1.44 | 0.13 | 0.37 | 0.57 | M | ||||
| -2.57 | 1.22 | 0.13 | 0.42 | 0.55 | M | ||||
| Source | Freq. |
|
|
rms |
|
Line | Other molecular lines | ||
| (GHz) | (km s-1) | (K) | (K) | (km s-1) | (K km s-1) | type | Molecule (freq.) |
|
|
| NGC 7538 | 86.615 | -57.17 | 0.16 | 0.10 | 3.27 | 0.56 | T | CH3OH(6.7 GHz)1 | -62 to -55 |
| -IRS1 | 95.169 | -57.69 | 0.16 | 0.04 | 3.91 | 0.67 | T | CS(48.9 GHz)3 | -56.48 |
| -57.51 | 0.36 | 0.04 | 0.94 | 0.36 | M | NH3(23.7 GHz)11 | -56.63 | ||
| -56.12 | 0.11 | 0.04 | 0.93 | 0.11 | M | C18O(109.8 GHz)11 | -56.96 | ||
| 96.755 | -57.66 | 0.18 | 0.01 | 3.45 | 0.66 | T | CH3CN(91.9 GHz)5 | -57.3 | |
| 96.745 | -57.18 | 0.33 | 0.01 | 3.94 | 1.38 | T | CH3CN(110.3 GHz)5 | -57.7 | |
| 96.741 | -57.12 | 0.97 | 0.01 | 3.69 | 3.81 | T | |||
| 96.739 | -57.50 | 0.65 | 0.01 | 4.19 | 2.90 | T | |||
| 107.013 | -60.44 | 0.38 | 0.12 | 0.62 | 0.25 | M | |||
| -58.81 | 0.29 | 0.12 | 1.23 | 0.38 | M | ||||
| -56.69 | 0.43 | 0.12 | 4.67 | 2.14 | T | ||||
| -56.27 | 0.40 | 0.12 | 0.61 | 0.26 | M | ||||
| -55.54 | 0.42 | 0.12 | 0.35 | 0.16 | M | ||||
| 108.893 | -57.99 | 0.31 | 0.07 | 4.31 | 1.42 | T | |||
| NGC 7538 | 95.169 | -57.51 | 1.26 | 0.04 | 1.10 | 1.48 | M | CH3OH(44.0 GHz)10 | -57.35 |
| -44 GHz | 96.755 | -57.40 | 0.15 | 0.02 | 3.69 | 0.59 | T | ||
| 96.745 | -57.42 | 0.39 | 0.02 | 3.69 | 1.53 | T | |||
| 96.741 | -57.12 | 1.65 | 0.02 | 4.18 | 7.34 | T | |||
| 96.739 | -57.75 | 1.32 | 0.02 | 5.17 | 7.26 | T | |||
| 107.013 | -59.15 | 0.12 | 0.05 | 3.88 | 0.50 | T | |||
| -55.34 | 0.19 | 0.05 | 2.32 | 0.47 | T | ||||
| 108.893 | -56.64 | 0.35 | 0.19 | 5.17 | 1.93 | T | |||