A&A 385, 647-670 (2002)
DOI: 10.1051/0004-6361:20020173
G. D'Angelo1,2 - T. Henning1 - W. Kley2
1 - Astrophysikalisches Institut und Universitäts-Sternwarte,
Schillergäßchen 2-3, 07745 Jena, Germany
2 - Computational Physics,
Auf der Morgenstelle 10, 72076 Tübingen, Germany
Received 16 May 2001 / Accepted 24 January 2002
Abstract
We study the evolution of embedded protoplanets in a protostellar
disk using very high resolution nested-grid computations.
This method allows us to perform global simulations of planets
orbiting in disks and, at the same time, to resolve in detail
the dynamics of the flow inside the Roche lobe of the planet.
The primary interest of this work lies in the analysis of the
gravitational torque balance acting on the planet. For this purpose
we study planets of different masses, ranging from one Earth-mass up
to one Jupiter-mass, assuming typical parameters of the protostellar
disk.
The high resolution supplied by the nested-grid technique permits an
evaluation of the torques, resulting from short and very short
range disk-planet interactions, more reliable than the one previously
estimated with the aid of numerical methods.
Likewise, the mass flow onto the planet is computed in a more
accurate fashion.
The obtained migration time scales are in the range from few times
104 years, for intermediate mass planets, to 106 years, for
very low and high mass planets. These are longer than earlier
assessments due to the action of circumplanetary material.
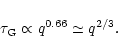
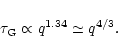
Typical growth time scales depend strongly on the planetary mass.
Below 64 Earth-masses, we find this time scale to increase as the
2/3-power of the planet's mass; otherwise it rises as the 4/3-power.
In the case of Jupiter-size planets, the growth time scale is several
times ten thousand years.
Key words: accretion, accretion disks - hydrodynamics - methods: numerical - stars: planetary systems
During the past five years radial velocity studies have allowed the detection of planetary companions around other main-sequence stars. Until now about sixty so-called "extrasolar planets'' have been discovered, that orbit their stars within a distance of a few AU. A recent catalog of extrasolar planets, including their orbital characteristics, is provided by Butler et al. (2001) and up-to-date versions can be found at http://www.obspm.fr/encycl/encycl.html and http://exoplanets.org/, maintained by Jean Schneider and the Department of Astronomy at UC Berkeley, respectively.
In contrast to the solar system, these new planets display quite different orbital properties that challenge the accepted formation scenario for solar planets. The major differences are their high minimum masses (up to 17 Jupiter-masses), their proximity to the central star (a fraction of the Sun-Mercury distance) and their high eccentricities (up to 0.7).
One of the main problems to deal with is the very close distance of massive planets to their parent star. The formation of Jupiter-type planets at these locations is, on theoretical grounds, very unlikely. First of all, from purely geometrical arguments, the matter reservoir of the surrounding disk is too small, so that a planet could hardly accrete its mass. Second, the temperatures within the disk are too high for a rocky core to condense easily.
For these reasons it is generally believed that planets have formed from disk material further out, at distances of several AU from the star, and have then migrated to their present positions. This radial motion of the planet through the disk is primarily caused by gravitational torques acting on the planet. The presence of the planet in the disk disturbs the disk gravitationally, creating spiral density wave perturbations, which emanate from the planet through the disk. Hence, the disk is no longer axisymmetric which results in a net torque on the planet. The sign and magnitude of the vertical component of the torque determines the direction and efficiency of the radial migration.
While initial fully non-linear hydrodynamical numerical computations of embedded planets assumed a fixed circular orbit of the planet (Kley 1999; Bryden et al. 1999; Lubow et al. 1999), more recent simulations took into account the back reaction of the disk and allowed for a change in the parameters of the planetary orbit (Kley 2000; Nelson et al. 2000). For a Jupiter-mass planet and typical parameter values for the disk, the obtained orbital decay time is about 105 years, which agrees reasonably well with previous estimates based on analytic linear theories (Goldreich & Tremaine 1980; Ward 1997).
The majority of the computations, performed so far, have used a single grid which resolves the Roche lobe of a Jupiter-mass planet only with very few grid cells. Recently, Ciecielag et al. (2000a, 2000b) used an Adaptive Mesh Refinement method to resolve the immediate surroundings of the planet, but they didn't give any estimate of the mass accretion rate and magnitude of the gravitational torque. On the other hand, Armitage (2001) reduced the overall simulated region achieving a better resolution. However, also in this case the Roche lobe is only resolved by a few grid cells because of the low mass of the investigated planet.
In this paper we aim to discuss the structure and dynamics of the gas flow in the close vicinity of the planet, while performing global disk simulations. In order to obtain the necessary high spatial and temporal resolution, we use a nested-grid formalism which allows an accurate computation of the mass flow onto the planet and the acting torques.
In the next section we lay out the physical model followed by a description of the numerical method (Sect. 3). We describe the setup of the various numerical models in Sect. 4. The main results are presented in Sect. 5 and our conclusions are given in Sect. 6.
The gas in the disk is non-self-gravitating and is orbiting
a protostar having a mass
![]()
![]() .
The total mass of the disk
.
The total mass of the disk
![]() ,
within the simulated region, which extends from 2.08 to 13 AU,
is
,
within the simulated region, which extends from 2.08 to 13 AU,
is
![]()
![]() .
Embedded in this disk there is a massive protoplanet
with a mass
.
Embedded in this disk there is a massive protoplanet
with a mass ![]() ,
which ranges from one Earth-mass (
,
which ranges from one Earth-mass (
![]() )
to one Jupiter-mass (
)
to one Jupiter-mass (
![]() ), depending on the considered model.
The planet is assumed to be on a fixed circular orbit throughout the
evolution. We employ a rotating coordinate system,
corotating with the planet, whose azimuthal position is kept constant
at
), depending on the considered model.
The planet is assumed to be on a fixed circular orbit throughout the
evolution. We employ a rotating coordinate system,
corotating with the planet, whose azimuthal position is kept constant
at
![]() .
The angular velocity
.
The angular velocity ![]() of the rotating frame is then given by
of the rotating frame is then given by
 |
(1) |
The evolution of the disk is given by the two-dimensional
(
![]() )
continuity equation for
)
continuity equation for ![]() and
the Navier-Stokes equations for each of the two components
of the velocity field
and
the Navier-Stokes equations for each of the two components
of the velocity field
![]() .
Thus, the set of equations read
.
Thus, the set of equations read

In the set of equations above we have omitted the energy equation
because in this study we will be concerned only with a relatively
simple equation of state which does not require the solution of
an energy equation.
We shall use an isothermal equation of state
where the surface pressure P is related to the density ![]() through
through
 |
(9) |
Since the mass of the planet is very small in comparison to the mass
of the star, because we always use here a ratio
![]() smaller than 10-3, the center of mass is located
very close to the position of the star. In the following
we will often identify the radial distance
from the origin of the coordinate system with the distance
from the central star.
smaller than 10-3, the center of mass is located
very close to the position of the star. In the following
we will often identify the radial distance
from the origin of the coordinate system with the distance
from the central star.
NIRVANA uses a spatially, second-order accurate, explicit method.
The advection is computed by means of the second-order monotonic
transport algorithm, introduced by van Leer (1977),
which guarantees global conservation of mass and angular momentum.
It is first-order accurate in time.
The viscosity part was added and is treated explicitly.
The stress tensor has been implemented for a Newtonian fluid
according to the Stokes hypothesis,
i.e. with a bulk viscosity ![]() .
This code has been already employed in similar computations,
either in 2D (Nelson et al. 2000)
and 3D (Kley et al. 2001), but always in a single-grid mode.
.
This code has been already employed in similar computations,
either in 2D (Nelson et al. 2000)
and 3D (Kley et al. 2001), but always in a single-grid mode.
A similar numerical scheme has been adopted, for astrophysical simulations, by a number of authors. Ruffert (1992) used this approach to investigate the collision between a white dwarf and a main sequence star. In his paper the numerical method is explained in detail. Yorke et al. (1993) and Burkert & Bodenheimer (1993) simulated the collapse of a protostellar cloud. An application to flux-limited radiation hydrodynamics can be found in Yorke & Kaisig (1995).
The method relies on the basic idea that, whenever a greater resolution is needed in a designated region, a finer subgrid is located inside the main grid (the one covering the whole computational domain). If the resolution is not high enough yet, another subgrid may be placed on the underlying one. Since any subgrid can host a finer subgrid structure, a grid hierarchy is generated, also called "system of nested grids''. In principle there is no limit to the degree of nesting. A three-level hierarchy is shown in Fig. 1.
The necessary equations are then integrated,
independently, on every grid level.
However, two neighbor subgrids must exchange the
necessary information whenever the integration
proceeds from one grid level to another.
Restrictions are imposed on the time step only
because, for stability reasons, the Courant-Friedrichs-Lewy
(CFL) condition must be fulfilled during each integration,
on each level.
![\begin{figure}
\par\includegraphics[width=8.4cm,clip]{f01-1481.eps}\end{figure}](/articles/aa/full/2002/14/aa1481/img119.gif) |
Figure 1: Face-up projection of a three-level grid system in cylindrical coordinates. On the finest subgrid (l=3) the linear spatial resolution is four times as large as it is on the main grid (l=1). |
| Open with DEXTER | |
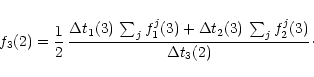
![\begin{displaymath}\Delta t_1(3) = \min\left[\Delta t^{\rm CFL}_1(3),
\frac{1}{...
...^{\rm CFL}_1(2),
\frac{1}{4}\,\Delta t^{\rm CFL}_1(1)\right],
\end{displaymath}](/articles/aa/full/2002/14/aa1481/img122.gif)
![\begin{displaymath}\Delta t_2(3) = \min\left[\Delta t^{\rm CFL}_2(3),
\frac{1}{...
...^{\rm CFL}_1(2),
\frac{1}{4}\,\Delta t^{\rm CFL}_1(1)\right].
\end{displaymath}](/articles/aa/full/2002/14/aa1481/img126.gif)
In general, within this kind of cycle, a level l is integrated
2l-1 times.
![\begin{figure}
\par\includegraphics[width=8.8cm,clip]{f02-1481.eps} \end{figure}](/articles/aa/full/2002/14/aa1481/img134.gif) |
Figure 2: Scheme of a complete integration cycle for a three-level grid system. Arrows indicate the direction of information transfer when integration proceeds from a level to the next lower one. Straight arrows stand for the solution updating process on the levels 2 and 1. Bow-arrows indicate the data transfer for setting the boundary quantities on the levels 3 and 2. |
| Open with DEXTER | |
![\begin{figure}
\par\includegraphics[width=8.4cm,clip]{f03-1481.eps} \end{figure}](/articles/aa/full/2002/14/aa1481/img135.gif) |
Figure 3: Interface between a subgrid and its host. The light-colored zone marks those cells containing boundary values needed for the subgrid integration, the "ghost cells''. The darker region refers to the so-called "active zone'', where values are effectively computed on the subgrid. The thick line, which separates the previous regions, encloses the grid cells on the coarse grid whose content is replaced by the more accurate one coming from the subgrid. |
| Open with DEXTER | |
The replacement procedure is straightforward: a surface weighted
average, using the nearest fine values, substitutes the coarse quantity.
For example, referring to Fig. 4,
the averaged coarse density (
![]() )
is
)
is
![\begin{figure}
\par\includegraphics[width=8.4cm,clip]{f04-1481.eps} \end{figure}](/articles/aa/full/2002/14/aa1481/img142.gif) |
Figure 4:
Surface weighted average of the surface density.
A coarse cell is shown along with the four
fine cells it comprises.
As a scalar, the surface density is cell-centered within
the appropriate refinement (dots).
|
| Open with DEXTER | |
![\begin{figure}
\par\includegraphics[width=8.4cm,clip]{f05-1481.eps} \end{figure}](/articles/aa/full/2002/14/aa1481/img143.gif) |
Figure 5:
Surface weighted average of the radial momentum density
|
| Open with DEXTER | |
In order to guarantee global mass and momentum conservation
for the whole hierarchy,
we have to make sure that the momentum flux components
![]() ,
across the border between a subgrid and its host grid
(indicated in Fig. 3), are equal in both level
solutions whenever the grid has evolved for the same time
as the subgrid.
However, each grid evolves independently and for a time interval
different from that of the lower one.
Thus, even after the solution
updating process described above, the amount of
momentum flowed across the borders might not
coincide in the respective solutions.
To remove this possible discrepancy,
at the coarse-fine grid border,
these quantities are taken from the
fine grid integration.
In Fig. 6
the situation for the azimuthal momentum flux is depicted.
Two fine cells participate in this process.
Referring to the integration cycle traced in Sect. 3.1.1,
fjk(l) represents the value of the quantity
,
across the border between a subgrid and its host grid
(indicated in Fig. 3), are equal in both level
solutions whenever the grid has evolved for the same time
as the subgrid.
However, each grid evolves independently and for a time interval
different from that of the lower one.
Thus, even after the solution
updating process described above, the amount of
momentum flowed across the borders might not
coincide in the respective solutions.
To remove this possible discrepancy,
at the coarse-fine grid border,
these quantities are taken from the
fine grid integration.
In Fig. 6
the situation for the azimuthal momentum flux is depicted.
Two fine cells participate in this process.
Referring to the integration cycle traced in Sect. 3.1.1,
fjk(l) represents the value of the quantity
![]() ,
at the grid-grid interface location,
as computed during the kth cycle step on level l.
An additional index (j=1,2) is needed to identify
the radial position of the two fine cells involved
(for example, on level 3),
but it does not concern the coarse grid quantity to be replaced
(on level 2).
,
at the grid-grid interface location,
as computed during the kth cycle step on level l.
An additional index (j=1,2) is needed to identify
the radial position of the two fine cells involved
(for example, on level 3),
but it does not concern the coarse grid quantity to be replaced
(on level 2).
Suppose we are at the end of the third cycle, when the first
interaction, between levels 2 and 3, occurs
(first straight arrow in Fig. 2).
Because of the refinement ratio established by Eq. (11),
quantity f3(2) will be reset as:
 |
(14) |
![\begin{figure}
\par\includegraphics[width=8.4cm,clip]{f06-1481.eps} \end{figure}](/articles/aa/full/2002/14/aa1481/img150.gif) |
Figure 6:
Momentum flux correction scheme. Momentum flux
components are centered as velocity field components,
whose locations are shown in the upper left corner.
|
| Open with DEXTER | |
Therefore, we raised the order of the interpolation. However, this introduces another potential trap. In fact, a high-order interpolation (higher than the first order) is not monotonic and can produce a new minimum. This is not acceptable since, for example, the density is a non-negative quantity. Then the interpolating function should be monotonised. In order to handle this problem we have used the same approach as described in Ruffert (1992), that is by employing the monotonised harmonic mean (van Leer 1977).
Then, if we have a function sampled at
![]() ,
x and
,
x and
![]() ,
with values
,
with values
![]() ,
g and
,
g and ![]() ,
respectively
(as shown in Fig. 7), the averaged value
at
,
respectively
(as shown in Fig. 7), the averaged value
at
![]() is
is
If we adopt this kind of average on a 2D-mesh,
each interpolation generally involves
![]() coarse quantities.
It proceeds by averaging the selected coarse values along a certain
direction, three at a time. This results in three new quantities.
A further harmonic average of these, along the other direction,
generates the subgrid boundary value at the correct position.
Figure 8 shows how the procedure works
in the case of the surface density.
coarse quantities.
It proceeds by averaging the selected coarse values along a certain
direction, three at a time. This results in three new quantities.
A further harmonic average of these, along the other direction,
generates the subgrid boundary value at the correct position.
Figure 8 shows how the procedure works
in the case of the surface density.
As density is cell-centered,
![]() and
and
![]() are always one fourth
of the coarse grid linear size.
Since the averaging process is performed for each direction
separately, it is not affected by the metric of the mesh,
i.e. it is performed as if a Cartesian grid were used.
are always one fourth
of the coarse grid linear size.
Since the averaging process is performed for each direction
separately, it is not affected by the metric of the mesh,
i.e. it is performed as if a Cartesian grid were used.
For the velocity components we have to distinguish two different
cases (see Fig. 9): whether the boundary value lies on
a coarse cell border or whether it does not.
In the first case, either
![]() or
or
![]() is zero.
Then only three coarse values participate in the average,
along either the azimuthal or the radial direction.
In the second case
the interpolation proceeds exactly as
explained for the surface density.
is zero.
Then only three coarse values participate in the average,
along either the azimuthal or the radial direction.
In the second case
the interpolation proceeds exactly as
explained for the surface density.
![\begin{figure}
\par\includegraphics[width=8.8cm,clip]{f07-1481.eps} \end{figure}](/articles/aa/full/2002/14/aa1481/img158.gif) |
Figure 7:
Behavior of an harmonic mean against a geometric mean.
Grey filled circles indicate the harmonic
values assumed by
|
| Open with DEXTER | |
![\begin{figure}
\par\includegraphics[width=8.4cm,clip]{f08-1481.eps} \end{figure}](/articles/aa/full/2002/14/aa1481/img159.gif) |
Figure 8:
Harmonic average: surface density boundary values.
The light-colored zone indicates subgrid ghost cells.
Darker region belongs to the active subgrid zone.
Nine coarse values (big black circles) are engaged
in the average. The value to be interpolated is shown as
a small black circle.
During a first step, Eq. (15) is
applied three times along the |
| Open with DEXTER | |
From now on, we refer to non-dimensional units.
All the lengths are expressed in units of the semi-major
axis a. This is constant because the planet moves on a
fixed circular orbit, with radius
The whole azimuthal range of the disk is taken into account
by considering a computational domain represented by
![]() ,
where
,
where
![]() and
and
![]() .
This is
covered by a
.
This is
covered by a
![]() mesh (main grid),
allowing a resolution such that
mesh (main grid),
allowing a resolution such that
![]() and constraining
the resolution on each other grid level, according to Eq. (11).
The size of any higher grid level is
and constraining
the resolution on each other grid level, according to Eq. (11).
The size of any higher grid level is
![]() .
.
![\begin{figure}
\par\includegraphics[width=8.4cm,clip]{f09-1481.eps} \end{figure}](/articles/aa/full/2002/14/aa1481/img168.gif) |
Figure 9:
Harmonic average of radial velocity component.
Two cases are shown. In one case the position
of the velocity component lies on a coarse grid
border (thick lines), requiring only three coarse
quantities (one single average).
In the other case nine coarse quantities are needed
as for the density interpolation. The only difference
is that
|
| Open with DEXTER | |
Note that the sphere of influence of the accretion process consists
of a region with a typical radius of 10-1 ![]() ,
quite smaller than
the protoplanetary radius, whereas the planet is usually assumed to fill
its Roche lobe during the growth phase (Bodenheimer & Pollack
1986; Tajima & Nakagawa 1997).
As the present study
does not take the energy equation into account, it precludes
a detailed treatment of the internal structure of the protoplanet
(see Wuchterl et al. 2000 and references therein;
see also Fig. 16 below),
hence the inferred accretion rates may still be unreliable.
,
quite smaller than
the protoplanetary radius, whereas the planet is usually assumed to fill
its Roche lobe during the growth phase (Bodenheimer & Pollack
1986; Tajima & Nakagawa 1997).
As the present study
does not take the energy equation into account, it precludes
a detailed treatment of the internal structure of the protoplanet
(see Wuchterl et al. 2000 and references therein;
see also Fig. 16 below),
hence the inferred accretion rates may still be unreliable.
![\begin{figure}
\par\includegraphics[width=8.4cm,clip]{f10-1481.eps} \end{figure}](/articles/aa/full/2002/14/aa1481/img182.gif) |
Figure 10:
Planet mass accretion scheme. Wherever a cell center
lies in the dark-colored zone, after each integration
its density is lowered by an amount
|
| Open with DEXTER | |
As boundary conditions, periodicity is imposed at
![]() and
and
![]() .
We allow matter to flow out of the computational domain at the inner
radial border (
.
We allow matter to flow out of the computational domain at the inner
radial border (
![]() )
whereas we set reflective boundary
conditions at the outer radial border (
)
whereas we set reflective boundary
conditions at the outer radial border (
![]() ).
The angular velocity is set equal to the unperturbed Keplerian value
).
The angular velocity is set equal to the unperturbed Keplerian value
![]() ,
both at
,
both at
![]() and
and
![]() .
.
For low mass planets (
![]()
![]() ),
boundary conditions should not affect much the system
evolution because density waves damp before reaching
),
boundary conditions should not affect much the system
evolution because density waves damp before reaching
![]() and are very weak when they reach
and are very weak when they reach
![]() .
For more massive planets, some reflection is seen at the
outer radial border.
Further, the torque exerted by the planet pushes the
inside-orbit material inwards. As a result, because of the
open boundary at
.
For more massive planets, some reflection is seen at the
outer radial border.
Further, the torque exerted by the planet pushes the
inside-orbit material inwards. As a result, because of the
open boundary at
![]() ,
the inner disk is partially
cleared and consequently positive torques originating there reduce.
The higher the planet mass is the stronger these two effects appear.
,
the inner disk is partially
cleared and consequently positive torques originating there reduce.
The higher the planet mass is the stronger these two effects appear.
![\begin{figure}
\par\includegraphics[width=7.9cm,clip]{f11-1481.eps} \end{figure}](/articles/aa/full/2002/14/aa1481/img191.gif) |
Figure 11:
Initial surface density distribution for q=10-3,
q=10-4, and q=10-5.
|
| Open with DEXTER | |
Few models may deserve some comments.
Model ELEN2 and WPRO1 aim at checking whether results from CIRO1 and
CIRO2 (respectively) are resolution-dependent.
This test is negative, as we show in the next sections.
Since the planet position
![]() can fall anywhere within a grid cell
according to the value of q in Eq. (17) and
to the definition of the grid,
some asymmetries could arise. These might have some effects on the
finest levels, due to the small value of the smoothing
factor
can fall anywhere within a grid cell
according to the value of q in Eq. (17) and
to the definition of the grid,
some asymmetries could arise. These might have some effects on the
finest levels, due to the small value of the smoothing
factor ![]() .
In order to achieve a complete symmetry, in the model
GINO1 the planet is placed at the corner of a main grid cell
(i.e., the intersecting point of four grid cells).
This property is such that, on every other gird level,
the planet always sits on the cross-point of four grid
cells.
CIRO3 and its counterpart, GINO1, give almost identical
results
.
In order to achieve a complete symmetry, in the model
GINO1 the planet is placed at the corner of a main grid cell
(i.e., the intersecting point of four grid cells).
This property is such that, on every other gird level,
the planet always sits on the cross-point of four grid
cells.
CIRO3 and its counterpart, GINO1, give almost identical
results![]() .
Since in the Jupiter-mass case the inner-disk is greatly depleted,
model ELEN1 was run to evaluate the influence of its presence
on the gravitational torque.
For this reason, in such model we prevent matter from draining
out of the inner radial border by setting reflective boundary
conditions.
.
Since in the Jupiter-mass case the inner-disk is greatly depleted,
model ELEN1 was run to evaluate the influence of its presence
on the gravitational torque.
For this reason, in such model we prevent matter from draining
out of the inner radial border by setting reflective boundary
conditions.
| Model | q | ng | Notes | |
| CIRO1 |
|
5 |
|
|
| CIRO2 |
|
6 |
|
|
| CIRO3 |
|
7 |
|
|
| PEPP1 |
|
7 |
|
|
| PEPP2 |
|
7 |
|
|
| PEPP3 |
|
7 |
|
|
| PEPP4 |
|
7 |
|
|
| WPRO1 |
|
7 |
|
|
| WPRO2 |
|
6 |
|
(a) |
| GINO1 |
|
7 |
|
(b) |
| GINO2 |
|
6 |
|
|
| GINO3 |
|
6 |
|
|
| ELEN1 |
|
5 |
|
(c) |
| ELEN2 |
|
6 |
|
|
| ELEN3 |
|
6 |
|
(d) |
| (a) Same as CIRO2, but
|
||||
| (b) Same as CIRO3, but the planet is symmetrically | ||||
| placed with respect to the grid cells. | ||||
| (c) Same as CIRO1, but reflective boundary conditions | ||||
| are set at
|
||||
| (d) Same as GINO3, but
|
||||
![\begin{figure}
\par\includegraphics[height=6.1cm,width=6cm,clip]{f12a1481.eps}\h...
...*{0.2cm}
\includegraphics[height=6.1cm,width=6cm,clip]{f12f1481.eps}\end{figure}](/articles/aa/full/2002/14/aa1481/img217.gif) |
Figure 12:
Overview of the surface density |
| Open with DEXTER | |
Planets with a lower value of q should perturb the disk less
and have a weaker large-scale impact on it.
For these reasons we discuss only the medium
(
![]() )
and small
(
)
and small
(
![]() )
scale effects of such interactions.
)
scale effects of such interactions.
Nonetheless, it's worthwhile noticing that large-scale structures
are clearly visible in our smallest mass models.
In CIRO3 (
![]()
![]() ), a trailing density wave,
emanating from the planet, spirals around the star for
about
), a trailing density wave,
emanating from the planet, spirals around the star for
about ![]() ,
vanishing approximately at r=2.
In PEPP1 (
,
vanishing approximately at r=2.
In PEPP1 (
![]()
![]() ), a similar feature spirals
for almost
), a similar feature spirals
for almost ![]() ,
disappearing at r=1.5.
Although we did not investigate this issue any deeper, it may happen that
results from local simulations could be influenced by not taking into
account entirely such global features.
,
disappearing at r=1.5.
Although we did not investigate this issue any deeper, it may happen that
results from local simulations could be influenced by not taking into
account entirely such global features.
In Fig. 13 the surface density is shown along with
the velocity field for the three CIRO-models.
As a reference, the Roche lobe
(of the relative three-body problem) is over-plotted.
From the upper row of this figure (
![]()
![]() )
we can see the patterns of the two main spirals (left panel).
They reach the Roche lobe, but do not enter it.
In fact, they are replaced by two streams of material
which start from two points (located at r=0.94,
)
we can see the patterns of the two main spirals (left panel).
They reach the Roche lobe, but do not enter it.
In fact, they are replaced by two streams of material
which start from two points (located at r=0.94,
![]() and r=1.07,
and r=1.07,
![]() ,
respectively),
where the flow is nearly at rest with respect
to the planet
,
respectively),
where the flow is nearly at rest with respect
to the planet![]() .
Each of them enters the Roche lobe, encircles the planet
and hits the other one on the opposite side.
As a result of the collision, the material is shocked and the
flow is redirected towards the planet.
Hence, these streams assume the form of two spirals,
winding around the planet (right panel) for
.
Each of them enters the Roche lobe, encircles the planet
and hits the other one on the opposite side.
As a result of the collision, the material is shocked and the
flow is redirected towards the planet.
Hence, these streams assume the form of two spirals,
winding around the planet (right panel) for ![]() .
That such smaller scale spirals are detached from the main ones
can be inferred from the direction of the flow.
Along the main spirals the material follows the disk rotation
around the star, moving away from the planet.
Along the small ones the gas orbits the planet.
In fact, they represent the outstanding features
of a circumplanetary disk.
A more detailed description of the flow regions around and inside
the Roche lobe, concerning a Jupiter-mass planet, can be found
in Lubow et al. (1999).
.
That such smaller scale spirals are detached from the main ones
can be inferred from the direction of the flow.
Along the main spirals the material follows the disk rotation
around the star, moving away from the planet.
Along the small ones the gas orbits the planet.
In fact, they represent the outstanding features
of a circumplanetary disk.
A more detailed description of the flow regions around and inside
the Roche lobe, concerning a Jupiter-mass planet, can be found
in Lubow et al. (1999).
![\begin{figure}
\par\includegraphics[height=6.1cm,width=6.3cm,clip]{f13a1481.eps}...
...0.2cm}
\includegraphics[height=6.1cm,width=6.3cm,clip]{f13f1481.eps}\end{figure}](/articles/aa/full/2002/14/aa1481/img224.gif) |
Figure 13: Surface density and velocity field for three selected models. Top row. CIRO1: grid level l=3 (left panel) and l=4 (right panel) at t=375 orbits. Middle row. CIRO2: grid level l=4 (left panel) and l=5 (right panel) at t=325 orbits. Bottom row. CIRO3: grid level l=5 (left panel) and l=6 (right panel) at t=225 orbits. To avoid too much confusion, only 40% of the velocity field vectors are drawn. The over-plotted curve and plus signs have the same meaning as in Fig. 12. Close to the planet, the velocity field is roughly keplerian (see Sect. 5.5). |
| Open with DEXTER | |
The case
![]()
![]() (Fig. 13, middle row)
has many analogies to the previous one.
This planet is able to open a gap in the disk, as a permanent
feature. However, it is neither so wide
(the base width is 0.15 against 0.4)
nor so deep (40% against 0.5% of the maximum surface density)
as it is for a Jupiter-mass planet.
The overall behavior of the matter entering the Roche lobe
is very similar (left panel).
The up-stream disk material, relative to the nearest X-point,
reaches it, inverts partially the direction of its motion and
flows into the Roche lobe.
The gas stream penetrating from the left X-point turns about
the planet, at
(Fig. 13, middle row)
has many analogies to the previous one.
This planet is able to open a gap in the disk, as a permanent
feature. However, it is neither so wide
(the base width is 0.15 against 0.4)
nor so deep (40% against 0.5% of the maximum surface density)
as it is for a Jupiter-mass planet.
The overall behavior of the matter entering the Roche lobe
is very similar (left panel).
The up-stream disk material, relative to the nearest X-point,
reaches it, inverts partially the direction of its motion and
flows into the Roche lobe.
The gas stream penetrating from the left X-point turns about
the planet, at
![]() ,
and collides
with the stream incoming from the other X-point, generating
the upper spiral arm (at
,
and collides
with the stream incoming from the other X-point, generating
the upper spiral arm (at
![]() ).
However, here the locations, from which these gas streams depart
(r=0.97,
).
However, here the locations, from which these gas streams depart
(r=0.97,
![]() and r=1.03,
and r=1.03,
![]() ,
respectively),
lie closer to the L1 and L2 points.
The circumplanetary spirals are less twisted around the planet
than before. They wrap around it for an angle
,
respectively),
lie closer to the L1 and L2 points.
The circumplanetary spirals are less twisted around the planet
than before. They wrap around it for an angle ![]() (right panel).
(right panel).
For the less massive planet,
![]()
![]() ,
the situation
is somewhat different (bottom row of Fig. 13).
In fact, within the Roche lobe, the signs of spiral fronts are
very feeble, though some traces can still be seen.
They assume the shape of a bar-like structure which extends,
for 0.3
,
the situation
is somewhat different (bottom row of Fig. 13).
In fact, within the Roche lobe, the signs of spiral fronts are
very feeble, though some traces can still be seen.
They assume the shape of a bar-like structure which extends,
for 0.3 ![]() ,
from side to side of the planet at
,
from side to side of the planet at
![]() .
As indicated by the velocity field, the circumplanetary disk roughly
occupies the entire Roche lobe (right panel).
.
As indicated by the velocity field, the circumplanetary disk roughly
occupies the entire Roche lobe (right panel).
Taking into account the other models as well,
the following scenario can be proposed:
the lower the value of q, the shorter
and straighter the circumplanetary spirals become.
For example, in model PEPP2, they track a tilde-like
pattern, extending for a total length of 0.4 ![]() .
.
![\begin{figure}
\par\includegraphics[width=7.4cm,clip]{f14a1481.eps}
\vspace*{2...
...
\vspace*{2mm}
\includegraphics[width=7.4cm,clip]{f14c1481.eps} \end{figure}](/articles/aa/full/2002/14/aa1481/img236.gif) |
Figure 14: Surface density contours on the finest grid level. The evolutionary time is the same as in Fig. 13. Top: CIRO1. Middle: CIRO2. Bottom: CIRO3. See the text for an explanation of the thick bow-lines and the plus signs. |
| Open with DEXTER | |
Since not all of the matter is taken away, it should pile up at the
location of the planet, eventually forming a very dense core.
Indeed, this is what we find, as already visible
in Fig. 14, where density contour lines crowd
around the planet at
![]() .
Figure 15 displays better how this feature looks like
for models CIRO1 and CIRO2.
In order to make a comparison of the linear extension
of such cores with the Hill radius, we introduce the
Hill coordinates. These are defined as
a Cartesian reference frame with origin on the planet and
coordinates normalized to
.
Figure 15 displays better how this feature looks like
for models CIRO1 and CIRO2.
In order to make a comparison of the linear extension
of such cores with the Hill radius, we introduce the
Hill coordinates. These are defined as
a Cartesian reference frame with origin on the planet and
coordinates normalized to ![]() (see the caption
of Fig. 15 for details).
(see the caption
of Fig. 15 for details).
![\begin{figure}
\par\includegraphics[width=7.5cm,clip]{f15a1481.eps}
\vspace*{3mm}
\includegraphics[width=7.5cm,clip]{f15b1481.eps} \end{figure}](/articles/aa/full/2002/14/aa1481/img241.gif) |
Figure 15:
Surface density plot of the highest grid level.
Top: CIRO1 at t=375 orbits.
Bottom: CIRO2 at t=325 orbits.
The Hill coordinates,
|
| Open with DEXTER | |
One reason for the sharpness of these peaks is the very
small length scale we adopt to smooth the
potential of the planet (Sect. 4.1).
On the finest grid level the smoothing length ![]() is
equal to
is
equal to
![]() (see Eq. (19)).
From Table 1 one can deduce that
(see Eq. (19)).
From Table 1 one can deduce that
![]()
![]() (though it changes a little for the different values of q).
Despite that, the core width always equals at least
(though it changes a little for the different values of q).
Despite that, the core width always equals at least
![]() .
Other two hints suggest that such features are not just a numeric
product. According to models CIRO2 and WPRO1 (which differ only in
the number of grid levels), the core width
is very similar. If we cut the peak at
.
Other two hints suggest that such features are not just a numeric
product. According to models CIRO2 and WPRO1 (which differ only in
the number of grid levels), the core width
is very similar. If we cut the peak at ![]() on the finest
level of each model, its extent, at
on the finest
level of each model, its extent, at
![]() ,
is 6 and 11
grid cells, respectively.
Models CIRO1 and ELEN2 agree in a very similar way.
Furthermore, the structure of these peaks does not depend on
the exact placement of the
planet within a grid cell, as models CIRO3 and GINO1 prove.
Since the amount of core material may be related to the accretion process,
the parameters
,
is 6 and 11
grid cells, respectively.
Models CIRO1 and ELEN2 agree in a very similar way.
Furthermore, the structure of these peaks does not depend on
the exact placement of the
planet within a grid cell, as models CIRO3 and GINO1 prove.
Since the amount of core material may be related to the accretion process,
the parameters
![]() and
and
![]() are likely
to modify the local density. The core widths (as introduced before)
of models CIRO2 and WPRO2 differ by about 20%
while the difference is somewhat less in case of GINO3 and ELEN3.
are likely
to modify the local density. The core widths (as introduced before)
of models CIRO2 and WPRO2 differ by about 20%
while the difference is somewhat less in case of GINO3 and ELEN3.
![\begin{figure}
\par\includegraphics[width=8.8cm,clip]{f16-1481.eps}\end{figure}](/articles/aa/full/2002/14/aa1481/img248.gif) |
Figure 16:
The core width is generally much larger than that
expected for an isothermal, hydrostatic, configuration.
In fact the centrifugal force, due to axial rotation of
the gas around the planet, may play an important role in
supporting the structure.
This is not the case for the core around an Earth-mass
planet (model PEPP1). Thus, the structure equation reads:
|
| Open with DEXTER | |
As pointed out,
the material within the core region is strongly coupled to the planet,
due to the small distances. In some way,
it may be considered as part of the protoplanet itself,
whose structure we may not resolve well enough in the present paper.
Whatever its nature, it is very likely that the angular momentum
transferred, by the core material to the planet,
may influence the planet's spin angular momentum
rather than its orbital one.
As we are treating the planet as a point mass we cannot estimate its
spin.
Therefore we decided to exclude this region from the torque
computation. To do that, we need a quantitative estimate of the
core radius ![]() ,
for every model in Table 1.
We adopt the following procedure: the average density
,
for every model in Table 1.
We adopt the following procedure: the average density
![]() is computed over the region
is computed over the region
![]() .
Then we define the core width (
.
Then we define the core width (![]() )
to be that where
)
to be that where
![]() .
In Fig. 17 (left panel) the dependence of
.
In Fig. 17 (left panel) the dependence of ![]() versus q is displayed. The ratio
versus q is displayed. The ratio
![]() decreases
for increasing values of q. However, between 3.2 and 32
decreases
for increasing values of q. However, between 3.2 and 32
![]() ,
it seems to vary very little.
Our measure of the core sizes is performed at a particular
time (for CIRO-models, they are indicated in Fig. 13).
Anyway, such estimates are not affected much by this choice
because the cores reach a steady state,
early during the system evolution. As an example,
Fig. 17 (right panel) shows how the core
mass
,
it seems to vary very little.
Our measure of the core sizes is performed at a particular
time (for CIRO-models, they are indicated in Fig. 13).
Anyway, such estimates are not affected much by this choice
because the cores reach a steady state,
early during the system evolution. As an example,
Fig. 17 (right panel) shows how the core
mass ![]() assumes a static value very soon.
assumes a static value very soon.
As already mentioned, the spiral features vanish for low
values of q, and for Earth-mass planets the core becomes
the most prominent feature within the Roche lobe.
![\begin{figure}
\par\includegraphics[width=6.5cm,clip]{f17a1481.eps}\hspace*{0.4cm}
\includegraphics[width=6.5cm,clip]{f17b1481.eps}\end{figure}](/articles/aa/full/2002/14/aa1481/img253.gif) |
Figure 17:
Left panel. Core width, |
| Open with DEXTER | |
![\begin{figure}
\par\includegraphics[width=4.7cm,clip]{f18a1481.eps}\hspace*{0.3c...
...ps}\hspace*{0.3cm}
\includegraphics[width=4.7cm,clip]{f18i1481.eps} \end{figure}](/articles/aa/full/2002/14/aa1481/img254.gif) |
Figure 18: Radial distribution and two-dimensional contour map of the gravitational torque exerted by the disk on the planet. Left panels. CIRO1: levels l=4 and l=5. Center panels. CIRO2: levels l=5 and l=6. Right panels. CIRO3: levels l=6 and l=7. The two-dimensional torque distribution (bottom panels) is reported for the finest grid level and is normalized to its maximum, absolute, value. |
| Open with DEXTER | |
In the present computations, we evaluate the torque exerted
on the planet in a straightforward way. First the gravitational
force acting on the planet
![]() ,
due to each grid cell (i,j), is calculated.
The torque, with respect to the star, is then
,
due to each grid cell (i,j), is calculated.
The torque, with respect to the star, is then
The quantity tz(i,j) is computed on each grid level.
Where the computational domain is covered by more than one level,
the torque tz(i,j) on the finest grid is considered for
the evaluation of
![]() .
We don't work with time averaged torques because they were checked
not to vary considerably with time during the last 100 orbits of the
computation.
Thereupon we use their values at the end of the simulations.
.
We don't work with time averaged torques because they were checked
not to vary considerably with time during the last 100 orbits of the
computation.
Thereupon we use their values at the end of the simulations.
In order to avoid the region dominated by the core,
we exclude a certain area from the computation of
![]() .
Because of the way we
defined the core radius
.
Because of the way we
defined the core radius ![]() ,
some core material may still lie
outside
,
some core material may still lie
outside
![]() .
Therefore, for safety reasons, we choose not to take into account
the planet neighborhood defined by
.
Therefore, for safety reasons, we choose not to take into account
the planet neighborhood defined by
![]() .
The only level, upon which this operation is relevant, is the
highest since it provides the gravitational torque form the regions
closest to the planet.
On coarser levels such operation is meaningless since
inner torques are taken from elsewhere. But it can be useful
to confer a more regular look to the radial torque profile.
We generally adopt the value
.
The only level, upon which this operation is relevant, is the
highest since it provides the gravitational torque form the regions
closest to the planet.
On coarser levels such operation is meaningless since
inner torques are taken from elsewhere. But it can be useful
to confer a more regular look to the radial torque profile.
We generally adopt the value
![]() for l<ng.
for l<ng.
However, as this might be somewhat arbitrary, we discuss in
a separate section how the choice of ![]() ,
on the finest
level, affects the value of the total torque
,
on the finest
level, affects the value of the total torque
![]() .
.
Because of the global angular momentum transfer, the disk material
(orbiting the star), at
![]() ,
exerts a negative
torque on the planet whereas the inside-orbit gas tends to increase
its angular momentum.
This tendency changes, as material closer to the planet is
accounted for, and it may reverse eventually,
once in the circumplanetary disk (for
,
exerts a negative
torque on the planet whereas the inside-orbit gas tends to increase
its angular momentum.
This tendency changes, as material closer to the planet is
accounted for, and it may reverse eventually,
once in the circumplanetary disk (for
![]()
![]() ,
such behavior was also found by Lubow et al. 1999).
The radial torque distribution, from CIRO-models, is shown in
Fig. 18.
The two sets of profiles belong to the grid levels l=ng-1(top row) and l=ng (middle row).
In the case of CIRO1 (top row, left panel), the sign reversal of
the torque is not completed yet. However some negative torques are exerted
from regions inside the planet orbit and some positive torques are
exerted from the opposite side.
On the domain covered by this grid (fourth level), the torque
contribution coming from
,
such behavior was also found by Lubow et al. 1999).
The radial torque distribution, from CIRO-models, is shown in
Fig. 18.
The two sets of profiles belong to the grid levels l=ng-1(top row) and l=ng (middle row).
In the case of CIRO1 (top row, left panel), the sign reversal of
the torque is not completed yet. However some negative torques are exerted
from regions inside the planet orbit and some positive torques are
exerted from the opposite side.
On the domain covered by this grid (fourth level), the torque
contribution coming from
![]() is positive while the one
coming from
is positive while the one
coming from
![]() is negative.
The resulting net torque is positive, as the magnitude of
the latter contribution is 2.4 times smaller than that of the former.
The torque behavior gets more complex if we restrict to a region
closer to the planet (middle row, left panel). Though not evident
at a first glance,
the signs are reversed if compared to the preceding grid level.
The torque exerted by the region
is negative.
The resulting net torque is positive, as the magnitude of
the latter contribution is 2.4 times smaller than that of the former.
The torque behavior gets more complex if we restrict to a region
closer to the planet (middle row, left panel). Though not evident
at a first glance,
the signs are reversed if compared to the preceding grid level.
The torque exerted by the region
![]() is definitely
positive and, in magnitude, almost 30 times as large as that
arising from the region
is definitely
positive and, in magnitude, almost 30 times as large as that
arising from the region
![]() .
Thus, this region exerts a strong, positive, net torque.
Indeed, the phenomenon of the torque sign reversal is clear in the
case of CIRO2 and CIRO3 (Fig. 18, center and right panels).
For both grid levels, inside-orbit material lowers the
angular momentum of the planet while outside-orbit material
acts in the opposite direction.
On the finest level of CIRO2, the ratio of the negative
to the positive torque contribution is just 0.96 (in absolute value),
whereas it is 0.3 for CIRO3.
.
Thus, this region exerts a strong, positive, net torque.
Indeed, the phenomenon of the torque sign reversal is clear in the
case of CIRO2 and CIRO3 (Fig. 18, center and right panels).
For both grid levels, inside-orbit material lowers the
angular momentum of the planet while outside-orbit material
acts in the opposite direction.
On the finest level of CIRO2, the ratio of the negative
to the positive torque contribution is just 0.96 (in absolute value),
whereas it is 0.3 for CIRO3.
In order to check which is the overwhelming contribution,
between positive and negative torques, on the various grid
levels, we can define the partial torque
![]() .
This represents the total torque computed over the entire domain
but the part covered by the grid level l+1 and such that
.
This represents the total torque computed over the entire domain
but the part covered by the grid level l+1 and such that
![]() .
Figure 19 illustrates the sign of the partial torque
and its relative strength,
on each grid level, for CIRO-models. We can see that the total
torque is negative in all of the three models. In CIRO1 and CIRO2
all levels, but the highest, contribute to lower the planet
angular momentum. On the contrary, the matter inside the finest level
raises the overall torque (of a fair amount in case of CIRO1).
In CIRO3, a positive torque is exerted by the
material outside a region, around the planet,
with a linear extension
.
Figure 19 illustrates the sign of the partial torque
and its relative strength,
on each grid level, for CIRO-models. We can see that the total
torque is negative in all of the three models. In CIRO1 and CIRO2
all levels, but the highest, contribute to lower the planet
angular momentum. On the contrary, the matter inside the finest level
raises the overall torque (of a fair amount in case of CIRO1).
In CIRO3, a positive torque is exerted by the
material outside a region, around the planet,
with a linear extension
![]() .
Instead, levels 3, 4, 5, and 6 provide negative torques,
which are then weakened considerably by the positive torque
coming from the finest level.
.
Instead, levels 3, 4, 5, and 6 provide negative torques,
which are then weakened considerably by the positive torque
coming from the finest level.
![\begin{figure}
\par\includegraphics[width=8.3cm,clip]{f19-1481.eps}\end{figure}](/articles/aa/full/2002/14/aa1481/img271.gif) |
Figure 19:
Partial torque
|
| Open with DEXTER | |
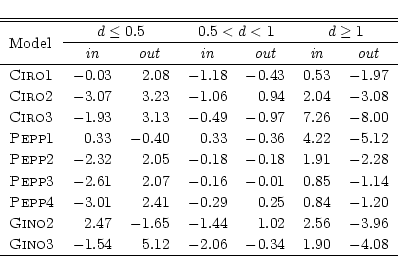
An overview of the torques exerted by different
portions of the disk, for all the relevant models,
is given in Table 2.
First of all we notice that, within 0.5 ![]() ,
the phenomenon of the sign reversal is observed in all
of the models, but PEPP1 and GINO2.
Anyway, in the latter case, the torque inside this
region is positive.
,
the phenomenon of the sign reversal is observed in all
of the models, but PEPP1 and GINO2.
Anyway, in the latter case, the torque inside this
region is positive.
In CIRO-models and in model GINO3, the reversal of the
sign is such to produce a positive torque over the domain
![]()
![]() .
This is because the surface density of the leading material
is slightly higher than that of the trailing matter
(Sect. 5.1 and Fig. 12).
In contrast, the torque is negative in case of PEPP2,
PEPP3, and PEPP4.
We note, however, that the positive torques
exerted by the outside-orbit material, within
this region, strongly attenuate the magnitude of
the negative net torque exerted by the rest of the disk.
.
This is because the surface density of the leading material
is slightly higher than that of the trailing matter
(Sect. 5.1 and Fig. 12).
In contrast, the torque is negative in case of PEPP2,
PEPP3, and PEPP4.
We note, however, that the positive torques
exerted by the outside-orbit material, within
this region, strongly attenuate the magnitude of
the negative net torque exerted by the rest of the disk.
Clearly, since neighboring material may tend to reduce the magnitude of negative torques acting on the planet, it could either slow down its inward migration or reverse the direction of its motion.
As anticipated,
the sign reversal of the radial torque distribution
is not observed in model PEPP1 (
![]()
![]() ).
Due to the very low mass of the perturber,
the only structure present inside
the Roche lobe is the density core. Whatever level
is considered, the inside-orbit gas always provides
positive torques while negative ones come from
the outside (see also Table 2).
Negative torques are somewhat stronger, on any grid level.
Almost the 50% of the total torque is generated
between
).
Due to the very low mass of the perturber,
the only structure present inside
the Roche lobe is the density core. Whatever level
is considered, the inside-orbit gas always provides
positive torques while negative ones come from
the outside (see also Table 2).
Negative torques are somewhat stronger, on any grid level.
Almost the 50% of the total torque is generated
between
![]() and
and
![]() ,
at the starting positions the disk spirals.
,
at the starting positions the disk spirals.
|
Thus, a more comprehensive description of the torque behavior
requires its full two-dimensional distribution.
In the bottom panels of Fig. 18, the contour lines
of the two-dimensional torque, tz, are shown for each reference model.
The interesting point to notice here is that
the largest magnitude torques arise
from the corotation locations, i.e. where
![]() (
(
![]() ). Here in fact,
). Here in fact,
![]() is perpendicular
to
is perpendicular
to
![]() and the cross-product in Eq. (20)
achieves its maximum (minimum).
The material leading the planet
(at
and the cross-product in Eq. (20)
achieves its maximum (minimum).
The material leading the planet
(at
![]() or
or
![]() ),
pulls it ahead and makes it gain angular momentum.
The trailing material brakes the planet making it lose
angular momentum.
),
pulls it ahead and makes it gain angular momentum.
The trailing material brakes the planet making it lose
angular momentum.
Let's consider two fluid elements
at
![]() and write their mass density as
and write their mass density as
![]() .
Then we can write
.
Then we can write
![]() ,
which yields:
,
which yields:
The region responsible for the maxima and minima of the radial
torque distributions in the middle row of Fig. 18
can be identified by means of the 2D-torque maps.
For example, in the case of CIRO1, we see that
the maximum at
![]() and the minimum at
and the minimum at
![]() are produced at
are produced at
![]() and
and
![]() ,
respectively.
In the other two cases, radial distribution extremes rise from
regions where the torque function tz is steeper than it is
on the opposite side of the planet.
,
respectively.
In the other two cases, radial distribution extremes rise from
regions where the torque function tz is steeper than it is
on the opposite side of the planet.
![\begin{figure}
\par\includegraphics[width=8.8cm,clip]{f20-1481.eps}\end{figure}](/articles/aa/full/2002/14/aa1481/img302.gif) |
Figure 20:
Migration time scale
|
| Open with DEXTER | |
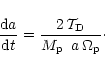
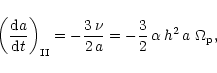
In agreement with predictions of analytical theories,
the drift velocity ![]() increases for increasing planet mass,
just as prescribed by type I migration (Eq. (24)).
The fast speed branch has a turning point around
increases for increasing planet mass,
just as prescribed by type I migration (Eq. (24)).
The fast speed branch has a turning point around
![]() ,
after which migration
slows down considerably.
Past this point,
,
after which migration
slows down considerably.
Past this point, ![]() drops as the planet mass increases.
According to the linear theory, this property announces
the transition to type II migration (Eq. (25)).
As a comparison, the complete theoretical behavior of
drops as the planet mass increases.
According to the linear theory, this property announces
the transition to type II migration (Eq. (25)).
As a comparison, the complete theoretical behavior of
![]() (solid line) is also reported in Fig. 20.
It was derived by Ward (1997) for viscous disks with
(solid line) is also reported in Fig. 20.
It was derived by Ward (1997) for viscous disks with
![]() .
Equations (24) and (25) represent the asymptotic branches
of this curve for very light and very heavy planets, respectively.
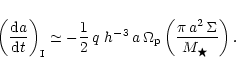
We also plot (long-dash line) the recent outcome by Tanaka et al.
(2002). They derived a general formula which is
comprehensive of both Lindblad and corotation torques, in 2D
as well as in 3D. Their linear theory, which was developed for
(vertically and radially) isothermal and inviscid disks, is
applicable as long as the Hill radius of the planet is much
smaller than the local disk scale height. Hence we can refer
to it only in the Type I migration regime.
.
Equations (24) and (25) represent the asymptotic branches
of this curve for very light and very heavy planets, respectively.
We also plot (long-dash line) the recent outcome by Tanaka et al.
(2002). They derived a general formula which is
comprehensive of both Lindblad and corotation torques, in 2D
as well as in 3D. Their linear theory, which was developed for
(vertically and radially) isothermal and inviscid disks, is
applicable as long as the Hill radius of the planet is much
smaller than the local disk scale height. Hence we can refer
to it only in the Type I migration regime.
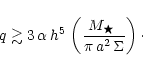
In all the models under examination, numerical simulations predict a slower drift than Ward's analytic theory does. Roughly, migration is two times as slow for models GINO2, GINO3, PEPP3, and PEPP4; three times as slow for CIRO1, CIRO2, CIRO3, and PEPP2; planets as massive as 3.2 and 64 Earth-masses migrate on the viscous time scale of the disk (Eq. (25)). Such discrepancies are likely to arise also because the theoretical (solid) curve in Fig. 20 does not include corotation torques. Yet, we have seen that just these torques slow down inward migration. This can be inferred also by comparing the two linear analyses presented in Fig. 20.
It is generally assumed that the smaller
the perturbations, the more suitable linear theories are in describing
disk-planet interactions. Consequently, the migration time scale
we compute for PEPP1 (1
![]() )
should match as close as possible
the theoretical prevision. Compared to Ward's prediction,
)
should match as close as possible
the theoretical prevision. Compared to Ward's prediction,
![]() is six times as large, whereas the agreement with the formula by Tanaka et al.
(2002) is complete. Between 3 and 10
is six times as large, whereas the agreement with the formula by Tanaka et al.
(2002) is complete. Between 3 and 10
![]() ,
our simulations predict slightly faster migration velocities.
This could be attributed to the inviscid approximation and to non-linearity
effects.
In this respect, Myioshi et al. (1999) found that,
at 5 AU, non-linear effects appear whenever
,
our simulations predict slightly faster migration velocities.
This could be attributed to the inviscid approximation and to non-linearity
effects.
In this respect, Myioshi et al. (1999) found that,
at 5 AU, non-linear effects appear whenever
![]()
![]() .
The choice of
.
The choice of ![]() in the numerical experiments
performed here may play some role as well.
in the numerical experiments
performed here may play some role as well.
It's worthy to note here that the relevance of coorbital torques, to the orbital evolution of a protoplanet, was already pointed out by Ward (1993). A further increment of migration times is to be expected if a full three-dimensional treatment of the system is achieved, especially when low mass planets are dealt with. Local simulations by Miyoshi et al. (1999), global simulations by Kley et al. (2001), and the linear wave theory by Tanaka et al. (2002) indicate that effects due to the disk thickness contribute to reduce the magnitude of the overall torque experienced by the planet. In a flat disk, gas is more efficient in generating torques because it constantly dwells in the planet's orbital plane. In a 3D geometry, material near the vertical of the planet exerts almost a vertical force which does not affect the z-component of the torque in Eq. (20).
![\begin{figure}
\par\includegraphics[width=6.9cm,clip]{f21a1481.eps}
\vspace*{2...
...
\vspace*{2.5mm}
\includegraphics[width=6.9cm,clip]{f21c1481.eps}\end{figure}](/articles/aa/full/2002/14/aa1481/img310.gif) |
Figure 21:
Migration time
|
| Open with DEXTER | |
An overview of the effects, due to nearby matter, on the
migration time scale
![]() ,
is given in Fig. 21.
Actually, these plots show the dependence of
,
is given in Fig. 21.
Actually, these plots show the dependence of
![]() upon
upon
![]() ,
where
,
where
![]() indicates the
direction of the planet's migration.
The distance where
indicates the
direction of the planet's migration.
The distance where
![]() is marked with a vertical,
solid line.
is marked with a vertical,
solid line.
![]() is directly proportional to
the mass of the disk
is directly proportional to
the mass of the disk ![]() .
Therefore, to remove this potential restriction, in these plots
we let it as a free parameter and write
.
Therefore, to remove this potential restriction, in these plots
we let it as a free parameter and write ![]() as
as
![]()
![]() ,
although we use k=3.5
for our estimates.
In Fig. 21,
,
although we use k=3.5
for our estimates.
In Fig. 21,
![]() is presented for all of the three reference models.
is presented for all of the three reference models.
In CIRO1 (top panel),
![]() becomes larger
as
becomes larger
as ![]() gets smaller.
The sign of the total torque changes around
gets smaller.
The sign of the total torque changes around
![]() ,
the threshold of the density core.
As a comparison, the behavior of
,
the threshold of the density core.
As a comparison, the behavior of
![]() ,
versus
,
versus ![]() ,
is reported also for the model ELEN1.
In this case, because of the closed inner radial border,
the amount of matter inside the orbit of the planet is five
times as large as that of CIRO1.
Outside the Hill circle, the torque exerted by the
inner-disk, in case of ELEN1, is twice as large as that
measured in CIRO1. Instead, torques arising from the
outer-disk nearly coincide. Inside the Hill circle,
in ELEN1, the contribution to
,
is reported also for the model ELEN1.
In this case, because of the closed inner radial border,
the amount of matter inside the orbit of the planet is five
times as large as that of CIRO1.
Outside the Hill circle, the torque exerted by the
inner-disk, in case of ELEN1, is twice as large as that
measured in CIRO1. Instead, torques arising from the
outer-disk nearly coincide. Inside the Hill circle,
in ELEN1, the contribution to
![]() is relatively small down to
is relatively small down to ![]() 0.1
0.1 ![]() whereas,
in CIRO1, it never appears to be negligible.
whereas,
in CIRO1, it never appears to be negligible.
CIRO2 (middle panel) behaves somewhat differently from CIRO1.
The total torque attains a minimum around
![]()
![]() ,
where
,
where
![]() years.
Then the positive torques, exerted by close matter, increase
the total torque, though it remains negative all the way down to
years.
Then the positive torques, exerted by close matter, increase
the total torque, though it remains negative all the way down to
![]()
![]() .
Below such value,
.
Below such value,
![]() diverges positively.
Results from the higher resolution model, WPRO1, do not differ
significantly (dashed line in Fig. 21).
diverges positively.
Results from the higher resolution model, WPRO1, do not differ
significantly (dashed line in Fig. 21).
![]() varies smoothly, as a function of
varies smoothly, as a function of ![]() ,
in case of CIRO3. The torques arising from the region enclosed
between
,
in case of CIRO3. The torques arising from the region enclosed
between
![]()
![]() and
and
![]()
![]() almost cancel out, so that the total torque appears nearly constant
(
almost cancel out, so that the total torque appears nearly constant
(
![]() years).
At shorter distances, positive torques prevail over the negative
ones and
years).
At shorter distances, positive torques prevail over the negative
ones and
![]() starts to increase.
The sign of the total torque reverses at
starts to increase.
The sign of the total torque reverses at
![]()
![]() .
For example, at
.
For example, at
![]() ,
its value is quite positive, imposing
an outward migration rate
,
its value is quite positive, imposing
an outward migration rate
![]() years.
years.
Some comments should be devoted to how the smoothing length
affects the total torque. We did not try to reduce
further its value, however we ran some models, identical to
CIRO1, but multiplying ![]() (see Eq. (19))
by some integer number.
A larger smoothing length tends to smear out more the surface
density nearby the planet. Besides, it also causes the material
to be distributed more symmetrically around it.
Both tendencies contribute to reduce the magnitude of the net
torque arising from a region with radius
(see Eq. (19))
by some integer number.
A larger smoothing length tends to smear out more the surface
density nearby the planet. Besides, it also causes the material
to be distributed more symmetrically around it.
Both tendencies contribute to reduce the magnitude of the net
torque arising from a region with radius
![]() .
.
![\begin{figure}
\par\includegraphics[height=4.3cm,width=5.6cm,clip]{f22a1481.eps}...
...35cm}
\includegraphics[height=4.3cm,width=5.4cm,clip]{f22f1481.eps} \end{figure}](/articles/aa/full/2002/14/aa1481/img325.gif) |
Figure 22:
Contour lines of velocity ratios
|
| Open with DEXTER | |
If a planet is massive enough, say
![]()
![]() ,
the streams of matter, entering the Roche lobe, produce strong
shock waves which then rule the gas flow inside this region.
Material passing through the shock fronts is deflected towards
the planet, tightening its orbit on it.
Less massive planets are not able to cause strong perturbations
inside the Roche lobe. As a consequence, the flow pattern appears
more uniform around the planet.
,
the streams of matter, entering the Roche lobe, produce strong
shock waves which then rule the gas flow inside this region.
Material passing through the shock fronts is deflected towards
the planet, tightening its orbit on it.
Less massive planets are not able to cause strong perturbations
inside the Roche lobe. As a consequence, the flow pattern appears
more uniform around the planet.
Now we would like to investigate quantitatively
the rotational regime of the gas inside the circumplanetary disks.
In particular, we would like to estimate how much it resembles a
Keplerian one.
In order to address this issue we decompose the local velocity
field ![]() ,
in two components, representing
the in-fall velocity
,
in two components, representing
the in-fall velocity
![]() and the rotational velocity
and the rotational velocity
![]() of the fluid relative to the planet.
The first component is defined as:
of the fluid relative to the planet.
The first component is defined as:
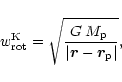
If circumplanetary disks were regular accretion disks,
we should expect them to be in a "Keplerian'' regime.
This is characterized by the rotational velocity
Figure 22 shows, for CIRO-models, the contour
lines of
![]() normalized to
normalized to
![]() (top panels) and
(top panels) and
![]() normalized to
normalized to
![]() (bottom panels).
(bottom panels).
As first remark we note that, if we compare Fig. 22 to Fig. 14, lines of equal surface density perturbation are also lines of equal velocity perturbation, as spiral wave theory predicts.
From the top panels of Fig. 22,
we can see that material approaches the planet along well
defined patterns.
Contours
![]() mark locations where the
flow rotates around the planet without altering its distance
from it.
They also separate regions in which material proceeds towards
the planet from those where it moves away.
One of these contours runs along the spiral ridges.
Across it, the in-fall velocity changes abruptly its sign.
mark locations where the
flow rotates around the planet without altering its distance
from it.
They also separate regions in which material proceeds towards
the planet from those where it moves away.
One of these contours runs along the spiral ridges.
Across it, the in-fall velocity changes abruptly its sign.
The ratio
![]() becomes
smaller as the gas comes closer to the planet.
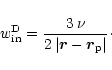
Since the viscous diffusion
becomes
smaller as the gas comes closer to the planet.
Since the viscous diffusion
![]() is
not related to
is
not related to ![]() ,
it's possible to compare the magnitude
of
,
it's possible to compare the magnitude
of
![]() for the different cases. Contour level
values indicate that it gradually reduces as
for the different cases. Contour level
values indicate that it gradually reduces as ![]() gets smaller.
gets smaller.
As regards the rotational component of the velocity field
![]() (Fig. 22, bottom panels), we can see
that it is generally slightly below
(Fig. 22, bottom panels), we can see
that it is generally slightly below
![]() .
For the Jupiter-mass case, this can be seen also in Fig. 23.
Centrifugal over-balance regions are not present around
the smallest planet (
.
For the Jupiter-mass case, this can be seen also in Fig. 23.
Centrifugal over-balance regions are not present around
the smallest planet (
![]()
![]() ).
Instead, they are observed in CIRO1,
at
).
Instead, they are observed in CIRO1,
at
![]() and
(0.15,0.1), and in CIRO2, where they are labeled.
In both cases, anyway, the ratio
and
(0.15,0.1), and in CIRO2, where they are labeled.
In both cases, anyway, the ratio
![]() is very close to unity.
Centrifugal under-balance is mainly established along
spiral ridges. This is in agreement with the idea that
spiral arms are zones of compression, hence pressure
plays a more active role in supporting the gas.
is very close to unity.
Centrifugal under-balance is mainly established along
spiral ridges. This is in agreement with the idea that
spiral arms are zones of compression, hence pressure
plays a more active role in supporting the gas.
![\begin{figure}
\par\includegraphics[width=8cm,clip]{f23-1481.eps}\end{figure}](/articles/aa/full/2002/14/aa1481/img339.gif) |
Figure 23:
The plot shows the ratio
|
| Open with DEXTER | |
![\begin{figure}
\par\includegraphics[width=8cm,clip]{f24-1481.eps}\end{figure}](/articles/aa/full/2002/14/aa1481/img342.gif) |
Figure 24:
Mass accretion rate onto the planet versus time, in units of
10-4 disk masses per orbital period of the planet.
For
|
| Open with DEXTER | |
For a Jupiter-mass planet (CIRO1) this happens around 100
orbital periods, as indicated by the solid line in Fig. 24.
The theoretical gap imposed at the beginning of the evolution
(see Fig. 11) is deeper and wider, at
![]() ,
than it is later on.
For this reason
,
than it is later on.
For this reason
![]() is negligibly small at early evolutionary times.
The partial replenishment is related to the formation
of the circumplanetary disk which supplies matter
for the accretion process.
is negligibly small at early evolutionary times.
The partial replenishment is related to the formation
of the circumplanetary disk which supplies matter
for the accretion process.
Smaller planets dig narrower and shallower gaps so this
quasi-steady regime is reached even earlier.
For both CIRO2 (Fig. 24, short-dash line) and
CIRO3 (long-dash line),
![]() reduces a little
as the evolution proceeds. This is likely due to the depletion
of the inside-orbit disk. In case of CIRO1, most of the
inner-orbit material is cleared out during the transitional
phase (75% after 100 orbits). Therefore, it does not contribute
much during the quasi-steady phase.
reduces a little
as the evolution proceeds. This is likely due to the depletion
of the inside-orbit disk. In case of CIRO1, most of the
inner-orbit material is cleared out during the transitional
phase (75% after 100 orbits). Therefore, it does not contribute
much during the quasi-steady phase.
In Fig. 25, the accretion rate is plotted against the
mass ratio (left panel), in dimensionless units as in Fig. 24.
![]() increases as the planet mass increases and
reaches a maximum around 0.5
increases as the planet mass increases and
reaches a maximum around 0.5
![]() (model GINO3).
Beyond this point the curve starts to drop. In fact, the accretion
rate of CIRO1 lies between those of
CIRO2 (
(model GINO3).
Beyond this point the curve starts to drop. In fact, the accretion
rate of CIRO1 lies between those of
CIRO2 (
![]()
![]() )
and GINO2 (
)
and GINO2 (
![]()
![]() ).
The accretion rates for planets with masses above about 10-4
).
The accretion rates for planets with masses above about 10-4
![]() (32
(32
![]() )
are consistent with those obtained
by recent models studying the evolution of giant protoplanets
(Tajima & Nakagawa 1997).
For smaller masses our accretion rates are substantially higher.
Two-dimensional approximation may be partially responsible for this
since all the gas is confined to the disk midplane.
Actually, Kley et al. (2001) showed that accretion rates
in disks with thickness are smaller than those in infinitesimally
thin disks as soon as the scale height of the disk becomes comparable
with the Hill radius of the planet.
However, all the more detailed studies of protoplanetary evolution are
spherically symmetric (see the review by Wuchterl et al. 2000),
and accretion via a planetary accretion disk may allow, anyway, for higher
rates.
)
are consistent with those obtained
by recent models studying the evolution of giant protoplanets
(Tajima & Nakagawa 1997).
For smaller masses our accretion rates are substantially higher.
Two-dimensional approximation may be partially responsible for this
since all the gas is confined to the disk midplane.
Actually, Kley et al. (2001) showed that accretion rates
in disks with thickness are smaller than those in infinitesimally
thin disks as soon as the scale height of the disk becomes comparable
with the Hill radius of the planet.
However, all the more detailed studies of protoplanetary evolution are
spherically symmetric (see the review by Wuchterl et al. 2000),
and accretion via a planetary accretion disk may allow, anyway, for higher
rates.
We did not perform computations involving planets heavier than
one Jupiter-mass so we cannot follow the trend of the curve for
larger values of q.
However, Lubow et al. (1999) found that
![]() decreases in the mass range from 1 to 6
decreases in the mass range from 1 to 6
![]() .
.
In the right panel of Fig. 25 the growth time scale
![]() is plotted versus q.
Logarithmic scaling of the axes shows that the curve decreases
almost linearly with respect to the mass of the planet.
If we perform a linear least-square fit of the values for
which
is plotted versus q.
Logarithmic scaling of the axes shows that the curve decreases
almost linearly with respect to the mass of the planet.
If we perform a linear least-square fit of the values for
which
![]() ,
corresponding to
,
corresponding to
![]()
![]() ,
we get:
,
we get:
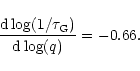
![\begin{figure}
\par\includegraphics[width=7cm,clip]{f25a1481.eps}\hspace*{0.4cm}
\includegraphics[width=7cm,clip]{f25b1481.eps}\end{figure}](/articles/aa/full/2002/14/aa1481/img351.gif) |
Figure 25:
Left panel. Mass accretion rate
|
| Open with DEXTER | |
Further,
![]() could depend on the numerical
resolution as well. Indeed, this dependency turns out to be
very weak, as indicated by two sets of models.
ELEN2 and WPRO1 have, in the accretion region, a resolution
two times as high as that of CIRO1 and CIRO2,
respectively (see Table 1). Despite this fact,
in the first case, the accretion rates differ by just 2%,
whereas the difference amounts to 4% in the second.
could depend on the numerical
resolution as well. Indeed, this dependency turns out to be
very weak, as indicated by two sets of models.
ELEN2 and WPRO1 have, in the accretion region, a resolution
two times as high as that of CIRO1 and CIRO2,
respectively (see Table 1). Despite this fact,
in the first case, the accretion rates differ by just 2%,
whereas the difference amounts to 4% in the second.
As mentioned in Sect. 4.4, the planet in not symmetrically centered within a grid cell. Model GINO1 was designed to accomplish a fully symmetric configuration (as already explained in Sect. 4.4). However, the planet accretion rate is not affected by this position shift, as can be seen by comparing the values in Table 3, belonging to CIRO3 and GINO1.
The accretion procedure we use in the present work is the same as
in Kley et al. (2001). Their evaluations of
![]() ,
for two-dimensional models with
,
for two-dimensional models with
![]() and 1
and 1
![]() ,
are roughly
twice as high as the estimates given in the left panel of Fig. 25.
Yet, in that paper, though
,
are roughly
twice as high as the estimates given in the left panel of Fig. 25.
Yet, in that paper, though
![]() was set to 5,
was set to 5,
![]() is equal to 0.5
is equal to 0.5 ![]() ,
thus the accretion region exceeds by 40 times that used in this paper
for models GINO3 and CIRO1.
,
thus the accretion region exceeds by 40 times that used in this paper
for models GINO3 and CIRO1.
| Model | q |
|
Orbits |
| CIRO1 |
|
|
200 |
| ELEN2 |
|
|
200 |
| GINO3 |
|
|
200 |
| ELEN3 |
|
|
200 |
| CIRO2 |
|
|
280 |
| WPRO1 |
|
|
280 |
| WPRO2 |
|
|
280 |
| CIRO3 |
|
|
120 |
| GINO1 |
|
|
120 |
However, many open questions still remain. The most important unsolved issue is the influence of the ambient gas on the dynamical evolution of a planet. Another one is the way disk-planet interaction changes when small planets, in the mass range of Neptune and Earth, are considered.
We began to investigate in both directions by means of a nested-grid technique, which is particularly suitable for treating these problems. The main asset of this numerical scheme is the possibility of achieving, locally, a very high spatial and temporal resolution. With such a method we are able to resolve very accurately both the inner parts of the Hill sphere of the planet and the global structure of the disk; consequently we can treat the whole azimuthal extent of the disk.
As regards the issues mentioned above, with the present paper we tackled some outstanding problems concerning the growth and migration of protoplanets, covering a range from one Jupiter-mass down to one Earth-mass. Thus, even though we do not include the detailed energetic balance of the planetary structure, which is still beyond present day computer facilities, this study represents a definite improvement in the determination of the torque balance on protoplanets.
Our main achievements can be summarized as follows.
Further efforts should be devoted to refining the physical model, especially in the vicinity of the planet, and to approach high resolution three-dimensional computations. Thereupon, some of the future developments could be:
Acknowledgements
We would like to thank Udo Ziegler for making the FORTRAN Version of his code NIRVANAavailable to us. We would like to thank also Dr. Ewald Müller for stimulating discussions on nested-grid calculations. This work was supported by the German Science Foundation (DFG) under grant KL 650/1-1. The numerical computations have been carried out at the Computer Center of the University of Jena.
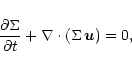
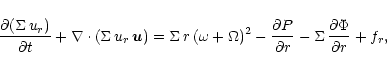
![\begin{displaymath}\frac{\partial [\Sigma\, r^2\, (\omega + \Omega)]}{\partial t...
...Sigma\,\frac{\partial \Phi}{\partial \varphi}
+ f_{\varphi}.
\end{displaymath}](/articles/aa/full/2002/14/aa1481/img92.gif)
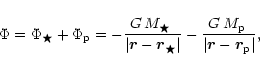
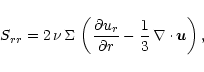
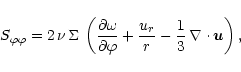
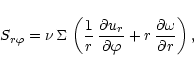


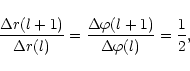
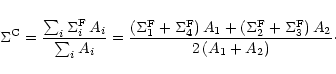
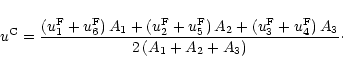
![\begin{displaymath}g_\varepsilon = g + \frac{2\,\varepsilon}{\Delta x}\,
\max\l...
...(g-g_{\rm L})\,(g_{\rm R}-g)}
{g_{\rm R}-g_{\rm L}},0\right],
\end{displaymath}](/articles/aa/full/2002/14/aa1481/img154.gif)

![\begin{displaymath}\delta(l) = \min\left[\frac{\mbox{$R_{\rm H}$ }}{5}, \lambda(l)\right],
\end{displaymath}](/articles/aa/full/2002/14/aa1481/img171.gif)