The Ly![]() forest imprinted in the spectra of
high-z QSOs
arises from the fluctuating low-density intergalactic
medium (IGM), highly photoionized by the metagalactic UV background.
Since the universe expands adiabatically and the Ly
forest imprinted in the spectra of
high-z QSOs
arises from the fluctuating low-density intergalactic
medium (IGM), highly photoionized by the metagalactic UV background.
Since the universe expands adiabatically and the Ly![]() forest
is in photoionization equilibrium with the UV background,
the temperature of the Ly
forest
is in photoionization equilibrium with the UV background,
the temperature of the Ly![]() forest as a function of z
provides a unique and powerful tool to probe the physical
state of the IGM and the reionization history of the universe
(Hui & Gnedin 1997;
Schaye et al. 1999; Ricotti, Gnedin & Shull 2000;
McDonald et al. 2000).
forest as a function of z
provides a unique and powerful tool to probe the physical
state of the IGM and the reionization history of the universe
(Hui & Gnedin 1997;
Schaye et al. 1999; Ricotti, Gnedin & Shull 2000;
McDonald et al. 2000).
For a low-density (the baryon overdensity
![]()
![]() 10),
photoionized gas, the temperature of the gas is shown to be
tightly correlated with the overdensity of the gas.
This relation, i.e. the equation of state, is defined by
10),
photoionized gas, the temperature of the gas is shown to be
tightly correlated with the overdensity of the gas.
This relation, i.e. the equation of state, is defined by
![]() ,
where T is
the gas temperature
in K, T0 is the gas temperature in K
at the mean gas density and
,
where T is
the gas temperature
in K, T0 is the gas temperature in K
at the mean gas density and
![]() is a constant at a given
redshift z. Both T0 and
is a constant at a given
redshift z. Both T0 and
![]() are a function
of z, depending on the thermal history of the IGM
(Hui & Gnedin 1997).
are a function
of z, depending on the thermal history of the IGM
(Hui & Gnedin 1997).
This equation of state, however, is not directly observable.
Instead of T and
![]() ,
observations only provide
the neutral hydrogen column density
,
observations only provide
the neutral hydrogen column density
![]() (in
cm-2) and the Doppler parameter b (in km s-1)
of the forest absorption lines. In practice, a lower cutoff envelope
in the
(in
cm-2) and the Doppler parameter b (in km s-1)
of the forest absorption lines. In practice, a lower cutoff envelope
in the
![]() -b distribution is used to probe
the upper limit on the temperature of the IGM since the forest
lines could be broadened by processes other than the thermal
broadening. Translating a
-b distribution is used to probe
the upper limit on the temperature of the IGM since the forest
lines could be broadened by processes other than the thermal
broadening. Translating a
![]() -b envelope into
a
-b envelope into
a
![]() -T relation depends on many physical
assumptions, such as the ionizing UV background
-T relation depends on many physical
assumptions, such as the ionizing UV background ![]() (Miralda-Escudé et al. 1996; Schaye et al.
1999).
(Miralda-Escudé et al. 1996; Schaye et al.
1999).
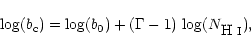
This minimum Doppler cutoff
![]() can be described by
can be described by
| QSO |
|
mag
|
|
|
# of lines
|
Comments |
| Q1101-264 | 2.145 | 16.0 | 3500-3778 | 1.88-2.11 | 69 | UVES SV, a damped system at z=1.8386 |
| J2233-606 | 2.238 | 17.5 | 3500-3890 | 1.88-2.20 | 88 | UVES Commissioning I |
| HE1122-1648 | 2.400 | 17.7 | 3500-4091 | 1.88-2.37 | 179 | UVES SV, split into 2 |
| HE2217-2818 | 2.413 | 16.0 | 3510-4100 | 1.89-2.37 | 159 | UVES Commissioning I, split into 2 |
| HE1347-2457 | 2.534 | 16.8 | 3760-4100 | 2.09-2.37 | 91 | UVES SV, incomplete observations |
| Q0302-003 | 3.281 | 18.4 | 4808-5150 | 2.96-3.24 | 107 | UVES Commissioning I, incomplete observations |
| Q0055-269 | 3.655 | 17.9 | 4850-5598 | 2.99-3.60 | 264 | UVES, Sep. 20-22, 2000, split into 2 |
| Q0000-263 | 4.127 | 17.9 | 5450-6100 | 3.48-4.02 | 209 | Lu et al. (1996), split into 2 |
|
|
From observations alone,
both no z-evolution of
![]() -independent
-independent ![]() (Kirkman & Tytler 1997; Savaglio et al. 1999) and
increasing
(Kirkman & Tytler 1997; Savaglio et al. 1999) and
increasing ![]() with decreasing z (Kim et al. 1997)
have been claimed. Results from simulations combined with observations
have also claimed both no-z evolution of T0 and
with decreasing z (Kim et al. 1997)
have been claimed. Results from simulations combined with observations
have also claimed both no-z evolution of T0 and
![]() (McDonald et al. 2000)
and a z-evolution
(Ricotti et al. 2000; Schaye et al. 2000;
Kim et al.
2001a).
Deriving
(McDonald et al. 2000)
and a z-evolution
(Ricotti et al. 2000; Schaye et al. 2000;
Kim et al.
2001a).
Deriving
![]() from observations depends
on many factors such as
the method of line deblending, the number of available
absorption lines, the metal-line contamination, and the method of fitting
the lower
from observations depends
on many factors such as
the method of line deblending, the number of available
absorption lines, the metal-line contamination, and the method of fitting
the lower
![]() -b envelope (Hu et al.
1995; Kirkman & Tytler 1997; Bryan & Machacek
2000; McDonald et al. 2000; Ricotti et al. 2000;
Shaye et al. 2000; Kim et al. 2001a).
The different approaches and the limited numbers of lines have led, in
part,
to the contradicting
results on the evolution of
-b envelope (Hu et al.
1995; Kirkman & Tytler 1997; Bryan & Machacek
2000; McDonald et al. 2000; Ricotti et al. 2000;
Shaye et al. 2000; Kim et al. 2001a).
The different approaches and the limited numbers of lines have led, in
part,
to the contradicting
results on the evolution of
![]() in the
literature.
in the
literature.
Here, using a new, increased dataset from 7 QSOs observed with the
VLT/UVES combined with
the published data on one QSO obtained with Keck/HIRES, we present
the evolution of the Doppler cutoff
![]() at three redshifts
at three redshifts
![]() 2.1, 3.3 and 3.8.
In particular, five QSOs at
2.1, 3.3 and 3.8.
In particular, five QSOs at ![]() 2.1 enable us to study the cosmic
variance of
2.1 enable us to study the cosmic
variance of
![]() and to improve
a determination of
and to improve
a determination of
![]() at lower z for the first time.
In Sect. 2, we briefly describe the data used in this study. The
analyses of the observations are presented in Sect. 3.
The discussion is in Sect. 4 and the conclusions are summarized in Sect. 5.
In this study, all the quoted uncertainties are
at lower z for the first time.
In Sect. 2, we briefly describe the data used in this study. The
analyses of the observations are presented in Sect. 3.
The discussion is in Sect. 4 and the conclusions are summarized in Sect. 5.
In this study, all the quoted uncertainties are ![]() errors.
errors.
| Sample A | ||||||||
| <z> |
|
# of lines |
|
|
|
|
|
|
| 2.1 | 13.0-14.5 | 349 |
|
|
|
|
|
|
| 3.3 | 13.0-14.5 | 275 |
|
|
|
|
|
|
| 3.8 | 13.3-14.5 | 152 |
|
|
|
|
|
|
| 2.0 |
13.0-14.5 | 176 |
|
|
|
|
|
|
| 2.2 |
13.0-14.5 | 173 |
|
|
|
|
|
|
| 3.1 |
13.0-14.5 | 157 |
|
|
|
|
|
|
| 3.4 |
13.0-14.5 | 118 |
|
|
|
|
|
|
| 3.6 |
13.3-14.5 | 74 |
|
|
|
|
|
|
| 3.9 |
13.3-14.5 | 78 |
|
|
|
|
|
|
| Sample B (averaged for the individual members) | ||||||||
| 2.1 | 13.0-14.5 | ... |
|
|
|
|
|
|
3.3 |
13.0-14.5 | ... |
|
|
|
|
|
|
3.8 |
13.3-14.5 | ... |
|
|
|
|
|
|
| Results from Schaye et al. (2000) (their sample corresponds to our Sample B) | ||||||||
|
|
12.5-14.5 | ... | ... | ... | ... | ... | ||
| 12.5-14.5 | ... | ... | ... | ... | ... | |||
| 12.5-14.8 | ... | ... | ... | ... | ... | |||
|
|
Copyright ESO 2002