| Name | Other names | mv | z | run1 | Exposure | FWHM2 |
| (minutes) | (arcsec) | |||||
| Q 0955+326 | 3C 232 | 15.8 | 0.530 | 1 | 20 | 0.36 |
| PG 1001+291 | 16.0 | 0.329 | 1 | 60 | 0.24 | |
| PG 1012+008 | 15.6 | 0.185 | 1 | 20 | 0.26 | |
| PKS 1302-102 | 15.2 | 0.286 | 1, 2 | 20, 48 | 0.26, 0.42 | |
| PG 1402+261 | 15.5 | 0.164 | 1, 2 | 40, 64 | 0.26, 0.34 | |
| B2 1425+26 | 15.7 | 0.366 | 1, 2 | 35, 64 | 0.24, 0.34 | |
| Q 1618+177 | 3C 334 | 16.0 | 0.555 | 1 | 30 | 0.36 |
| PG 1700+518 | 15.1 | 0.290 | 1, 2 | 40, 40 | 0.26, 0.30 | |
| Q 1704+608 | 3C 351 | 15.3 | 0.371 | 1, 2 | 40, 64 | 0.26, 0.43 |
| B2 1721+34 | 15.4 | 0.206 | 1 | 75 | 0.24 | |
| PG 2112+059 | 15.6 | 0.466 | 1, 2 | 30, 32 | 0.24, 0.34 | |
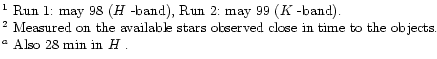
| PKS 2128-12 | 16.2 | 0.501 | 2 | 24a | 0.61, 0.48 |
| Name | z | Companions | Extension |
|
|
mr1/4H( mr1/4K) | Host type | ||
| 5 arcsec | 10 arcsec | arcsec | kpca | ||||||
| Q 0955+326 | 0.530 | 2.2 | 7.9 | 14.18 | 14.25 | 12.56 | E | ||
| PG 1001+291 | 0.329 | 2.9 | 8.1 | 13.87 | 14.10 | 14.84 | SBa | ||
| PG 1012+008 | 0.185 | 1 | 1 | 3.0 | 6.3 | 16.71 | 16.97 | 17.19 | E-Sa |
| PKS 1302-102 | 0.286 | 2 | 2.6 | 7.1 | 13.45 (12.53) | 13.84 (12.89) | 13.84 (13.08) | E | |
| PG 1402+261 | 0.164 | 3.0 | 5.3 | 13.23 (11.91) | 14.07 (12.86) | 14.07 (11.67) | SBa | ||
| B2 1425+26 | 0.366 | 2 | 2.3 | 7.5 | 14.26 (13.30) | 14.69 (14.01) | 15.01 (14.23) | E-Sa | |
| Q 1618+177 | 0.555 | 1 | 2 | 1.5 | 5.4 | 14.68 | 15.18 | 15.48 | |
| PG 1700+518 | 0.290 | 1 | 2.5 | 6.7 | 12.90 (11.75) | 13.89 (12.50) | 13.89 (12.15) | Sa? | |
| Q 1704+608 | 0.371 | 1 | 2.3 | 6.9 | 13.30 (12.21) | 14.37 (12.89) | 14.30 (12.84) | E | |
| B2 1721+34 | 0.206 | 2 | 1.5 | 3.2 | 13.95 | 14.13 | 15.07 | ||
| PG 2112+059 | 0.466 | 1 | 1 | 2.0 | 6.6 | 13.64 (12.64) | 14.10 (12.96) | 14.71 (13.51) | E? |
| PKS 2128-12 | 0.501 | 1 | 1.7 | 6.1 | 13.42 (12.77) | 14.39 (13.33) | 14.50 (13.21) | ||
| a H0 = 100 km s-1 Mpc-1;
|
|||||||||
In order to use adaptive optics correction quasars were selected such
that the nuclei were bright enough to be used as the wavefront
reference point source. The sample of radio-quiet quasars were all PG
quasars with
![]() and with redshift less than 0.6. The radio-loud
objects were selected from 3C, 4C, B2 and PKS catalogues with the
same magnitude and z criteria. The final objects observed (see Table 1) were
selected based upon the suitability for the observing conditions on
the observing runs.
and with redshift less than 0.6. The radio-loud
objects were selected from 3C, 4C, B2 and PKS catalogues with the
same magnitude and z criteria. The final objects observed (see Table 1) were
selected based upon the suitability for the observing conditions on
the observing runs.
We used the CFHT adaptive optics bonnette (PUEO) and the
IR camera KIR on May 1998 (run 1) and May 1999 (run 2).
The weather conditions were poor during both runs and the FWHM of the seeing
PSF was never better than 0.8 arcsec. The adaptative-optics correction was
performed on the QSOs themselves.
The quasar was centered successively in the center of the four
quadrants of the detector. The exposure time for individual images was
two minutes.
The background was determined by
median-averaging the frames and the flat-field was taken to be
the normalized dark-substracted background.
The images were then aligned and added. The final images have a typical
resolution of FWHM ![]() 0.3 arcsec. After each science observation
an image of a star with similar magnitude as the QSO
was taken in order to determine the PSF and use it to deconvolve the images.
Due to rapid variations in the wheather conditions however, it was not
always possible to follow this predefined procedure.
0.3 arcsec. After each science observation
an image of a star with similar magnitude as the QSO
was taken in order to determine the PSF and use it to deconvolve the images.
Due to rapid variations in the wheather conditions however, it was not
always possible to follow this predefined procedure.
A synthetic PSF function, derived from the stellar images was used to deconvolve each of the images. As it was not always possible to apply a standard procedure due to fluctuating seeing conditions, a careful, although somewhat arbitrary choice of the PSF had to be done. In Fig. 2 we show the images of PKS 1700+514 obtained using, for the deconvolution, three different PSFs from stars observed during the same night. These have respectively, FWHM = 0.30, 0.42 and 0.48 arcsec. The initial image of the object has a resolution of FWHM = 0.26 arcsec and the star observed just after the science exposure has FWHM = 0.48 arcsec. It is apparent that the best result is obtained using the star with the FWHM closest to that of the science exposure. Here, we were guided in the exercice by the existence of the HST image by Hines et al. (1999). In general, this illustrates the crucial role played by a careful PSF determination in AO observations.
Results are summarized in Table 2. Columns
![]() and
and ![]() give, respectively, the number of objects (probably
companions) found within
5 and 10 arcsec from the quasar down to mH = 20.5; columns
give, respectively, the number of objects (probably
companions) found within
5 and 10 arcsec from the quasar down to mH = 20.5; columns
![]() and
and ![]() give the maximum radial distance (in arcsec and
kilo-parsec) to which the host is
detected at a significance level of 3
give the maximum radial distance (in arcsec and
kilo-parsec) to which the host is
detected at a significance level of 3![]() above the background;
column
above the background;
column ![]() gives the total
magnitude of the object in the H-band
and columns
gives the total
magnitude of the object in the H-band
and columns ![]() and
and ![]() those of the host-galaxy as derived from
the PSF subtraction and profile fitting respectively (see Sect. 4);
the assigned morphology, which comes from the 2D brightness
distribution and the comparison of the two profile fittings, is given
in column
those of the host-galaxy as derived from
the PSF subtraction and profile fitting respectively (see Sect. 4);
the assigned morphology, which comes from the 2D brightness
distribution and the comparison of the two profile fittings, is given
in column ![]() .
.
Copyright ESO 2001