Up: Monitoring of the optical ISO
7 The IR variability
The total duration of our ISO campaign was 374 days,
with a mean sampling interval of 24.9 days.
In addition to the weighted-mean spectrum,
,
Fig. 3 displays the
rms spectrum
,
and the mean error spectrum
.
The latter was evaluated as
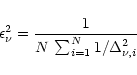
 |
(1) |
where
is the uncertainty associated with the flux Fi at
epoch i and
is the number of epochs. We can exclude significant
(i.e. 3
)
flux variability since the largest value of
is only
1.4.
A chi-square test was also applied to the average PHT-S fluxes of
Table 1. The reduced chi-squares are <1 which confirms
that no significant variations of the mid-IR flux
took place during our
-year observing campaign.
Up: Monitoring of the optical ISO
Copyright ESO 2001