We used the high-resolution spectra obtained with the coudé
echelle spectrograph of the Tautenburg 2-m telescope to the study
of the He I line profile changes. These spectra (set 16 in
Table 2) have a 2-pixel resolution of about 37000,
the typical time resolution being about 5 min. The signal-to-noise
ratio is of about 200 for the majority of them. In the spectral range covered,
from H![]() to 7100 Å, there are 6 He I lines which are much stronger
than all metallic lines. Three of them (5015, 5875, and 6678 Å) have
almost clean, unblended profiles and were already used for the RVmeasurements. The strongest and cleanest singlet He I 6678 Å line
has been used to the study of line profile changes (Fig. 8).
to 7100 Å, there are 6 He I lines which are much stronger
than all metallic lines. Three of them (5015, 5875, and 6678 Å) have
almost clean, unblended profiles and were already used for the RVmeasurements. The strongest and cleanest singlet He I 6678 Å line
has been used to the study of line profile changes (Fig. 8).
 |
Figure 10: Variation of central line depth in % (plus signs), of line width in kms-1(crosses), and of RV (circles) of the He I 6678 Å line during two single runs |
| |
Figure 11: Line depth of the interstellar Na I 5896 Å line, expressed in per cents of the continuum level, vs. line depth of He I, shown for the JD 2451472 run |
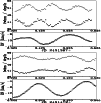
Examples of two time series are given in Fig. 9. The profiles shown in the upper part of the diagram were properly shifted in wavelength (based on orbital solution IV) and are on the rest frame of the primary star. A variation in the line centers, caused by rapid line profile changes, is seen. Beside the variation of line centers, a clear variation of line depths and an indication of line widths can also be seen.
In the lower part of Fig. 9, residual profiles are shown. They were created in the following way: cross-correlating individual line profiles with the mean profile of the given series, we first shifted all profiles to put them on the laboratory wavelength and then we subtracted the mean profile from the individual ones.
From the pattern seen on JD 2451387, one can estimate a period of
about 130 min (0
![]() 093) which is about a half of the P3 period 0
093) which is about a half of the P3 period 0
![]() 181733,
found from RVs. The pattern itself can be simply explained by a periodic
variation of the line width which occurs nearly in anti-phase to the variation
of the line depth. To prove this, we measured these values on the He I line
profiles.
The results for the two runs shown in Fig. 9 are displayed
in Fig. 10. The periodic changes in both, the line depth and
the line width are clearly seen, as well as the anti-phase behaviour of
the two.
The anti-phase variation of line depth and line width
which is shown here for two selected nights
is present in the entire data set. The equivalent widths were found
to be constant within the limits of accuracy of our measurements.
181733,
found from RVs. The pattern itself can be simply explained by a periodic
variation of the line width which occurs nearly in anti-phase to the variation
of the line depth. To prove this, we measured these values on the He I line
profiles.
The results for the two runs shown in Fig. 9 are displayed
in Fig. 10. The periodic changes in both, the line depth and
the line width are clearly seen, as well as the anti-phase behaviour of
the two.
The anti-phase variation of line depth and line width
which is shown here for two selected nights
is present in the entire data set. The equivalent widths were found
to be constant within the limits of accuracy of our measurements.
Line profiles of the sharp and very strong NaD doublet of interstellar origin can be seen in Fig. 8. Figure 11 shows that the line depths of the interstellar lines and of the stellar HeI lines are not correlated, the interstellar line profiles show no variability. So we can be sure that the changes observed in the stellar lines are intrinsic.
It is important to mention that obviously two different kinds of line profile variations were found from different night series. In some series, the frequency of line profile changes was twice the frequency of the RV changes - for instance on JD 2451387 - while in some others, like on JD 2451472, the periods of RV and line profile changes were about the same. Assuming the possible presence of the fundamental periods and the first overtones, we therefore carried out a period search in the variation of the line depth using the technique of successive prewhitening. The periods of the strongest contributions found correspond to the periods P1 to P3 (Table 11).
No correlation between the occurrence of the minima and/or maxima of the line depth and the RV variation was found. Also, no periodic changes of the line asymmetry which could be responsible for the rapid RV variation observed were found.
Line profile variations of ENLac will be studied in much more detail in a forthcoming paper.
| P [d] | line depth [%] | line width [km s-1] | ||
| A0 | A1 | A0 | A1 | |
| 0.1691864 | 0.37 | 0.71 | 0.34 | 0.75 |
| 0.1708522 | 0.63 | 0.35 | 0.59 | 0.35 |
| 0.1816000 | 0.24 | 1.07 | 0.25 | 0.85 |
Copyright ESO 2001