 |
Figure 1:
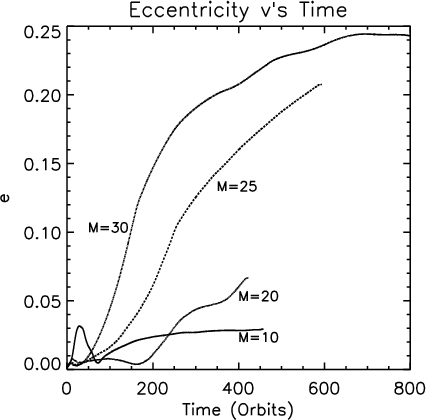
This figure shows the evolution of the eccentricity versus time
(measured in units of P0) for the calculations, N2, N3, N4, N5 listed
in Table 1. The lines corresponding to each companion of different
mass are indicated on the figure in units of |
Recent simulations of protoplanets with 0.001 < q < 0.01,interacting with discs with physical parameters similar to those adopted here, being thought to be appropriate to protoplanetary discs, have been carried out by Bryden et al. (1999), Kley (1999), and Lubow et al. (1999). Fixed circular orbits were assumed. It was found that a gap was formed that deepened and widened with increasing q. The disc interior to the orbit accreted onto the central star forming an inner cavity. Subsequent work by NPMK which allowed the orbit to evolve found that it remained essentially circular while migrating towards the central star.
We remark that Artymowicz (1992) indicated that
orbital eccentricity growth might occur for sufficiently large
![]() while Lin & Papaloizou (1993a) argued that for sufficiently wide gaps,
eccentricity growth could be induced by interaction at the 1:3
resonance in the outer disc and the 3:1 resonance in the inner disc.
As the latter is absent in the work presented here, only
the 1:3 resonance in the outer disc will concern us.
while Lin & Papaloizou (1993a) argued that for sufficiently wide gaps,
eccentricity growth could be induced by interaction at the 1:3
resonance in the outer disc and the 3:1 resonance in the inner disc.
As the latter is absent in the work presented here, only
the 1:3 resonance in the outer disc will concern us.
The aim of the work presented here is to examine for what value of the companion-star mass ratio, if any, eccentricity growth of the companion orbit is induced by its interaction with the disc model that we assume. Should it occur, we wish to understand the dominant mechanism by which growth occurs and in particular whether the 1:3 resonance is involved.
The numerical calculations are summarised in Table 1. The case of q=10-3 was considered in some detail in NPMK. The planet/companion in this case was found to migrate in towards the central star on a time scale given by the viscous evolution time at the initial position of the planet (also see Lin & Papaloizou 1986) remaining on an essentially circular orbit. We will not give further discussion here on this case, since eccentricity growth was not observed.
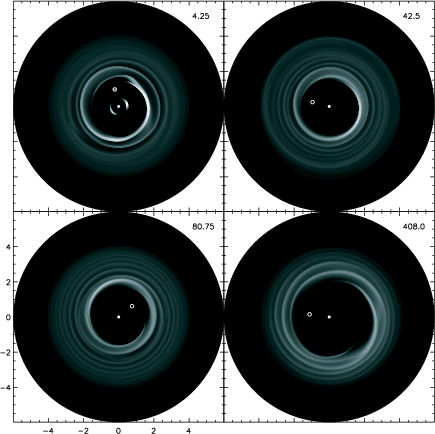 |
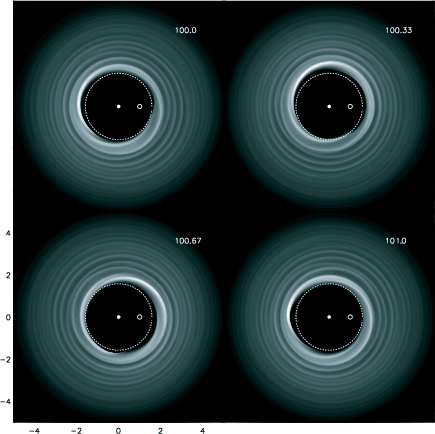
Figure 2:
This figure shows the evolution of the surface density
profile of the disc in calculation N5 described in Table 1. The time,
in units of P0, is shown at the top right hand corner of each panel.
The initial clearing of a gap is shown in the first and second
panel, and the growth of
eccentricity of the disc interior to the 1:3 resonance (located at
|
The evolution of the eccentricity for the remaining cases listed
in Table 1 is shown in Fig. 1. It is apparent
from this figure that strong eccentricity growth occurs for
mass ratios in the range
![]() ,
with the strongest eccentricity
growth being observed at the higher end of this range. From here onwards we
will concentrate on describing the evolution of the q=0.03 case.
,
with the strongest eccentricity
growth being observed at the higher end of this range. From here onwards we
will concentrate on describing the evolution of the q=0.03 case.
A plot of the surface density evolution of run N5 described in Table 1
is shown in Fig. 2. The times corresponding to each panel
are shown in the top right hand corner in units of P0.
It can be seen that the disc interior to
![]() is cleared out
by the action of the companion tides on a relatively short
time scale, and remains tidally truncated.
Further evolution of the system leads to the formation
of an eccentric outer disc, as may be observed in the third panel of
Fig. 2. Figure 4 also shows the formation of an eccentric
disc for a companion on a fixed circular orbit, and is described below.
As the eccentricity of the companion increases
beyond
is cleared out
by the action of the companion tides on a relatively short
time scale, and remains tidally truncated.
Further evolution of the system leads to the formation
of an eccentric outer disc, as may be observed in the third panel of
Fig. 2. Figure 4 also shows the formation of an eccentric
disc for a companion on a fixed circular orbit, and is described below.
As the eccentricity of the companion increases
beyond
![]() ,
we observe
that the disc response becomes non steady as the companion orbits between
apocentre and pericentre. The evolution of the orbital radius of
the companion and its eccentricity evolution (on both linear and log scales)
are presented in Fig. 3.
This figure shows that the eccentricity undergoes a period
of rapid growth after a time of
,
we observe
that the disc response becomes non steady as the companion orbits between
apocentre and pericentre. The evolution of the orbital radius of
the companion and its eccentricity evolution (on both linear and log scales)
are presented in Fig. 3.
This figure shows that the eccentricity undergoes a period
of rapid growth after a time of ![]() P0. The logarithmic
plot of e versus t shown in the second panel of this figure shows that
the growth rate is initially constant (approximately), but then decreases as
the system evolves beyond
P0. The logarithmic
plot of e versus t shown in the second panel of this figure shows that
the growth rate is initially constant (approximately), but then decreases as
the system evolves beyond
![]() P0, indicating exponential growth
during these early stages. Analysis of the torques being exerted
on the companion between the times
P0, indicating exponential growth
during these early stages. Analysis of the torques being exerted
on the companion between the times
![]() P0 shows that the
angular momentum is removed from the companion orbit
and transferred to the disc as it approaches
apocentre, leading to further growth of the orbital
eccentricity. This, however,
does not explain why the disc itself becomes eccentric during its early
evolution. At a later time
P0 shows that the
angular momentum is removed from the companion orbit
and transferred to the disc as it approaches
apocentre, leading to further growth of the orbital
eccentricity. This, however,
does not explain why the disc itself becomes eccentric during its early
evolution. At a later time
![]() P0, the eccentricity
reaches a maximum value
P0, the eccentricity
reaches a maximum value ![]() 0.25. It subsequently enters
into a sequence of cyclic variations, decreasing
to small values at
0.25. It subsequently enters
into a sequence of cyclic variations, decreasing
to small values at
![]() P0, before increasing again.
After the initial saturation the disc is always very eccentric
and in contact with the companion at some orbital phases.
This interaction of the companion
with material with higher specific
angular momentum causes the early net inward orbital migration
to reverse such that the final semi-major axis
at
P0, before increasing again.
After the initial saturation the disc is always very eccentric
and in contact with the companion at some orbital phases.
This interaction of the companion
with material with higher specific
angular momentum causes the early net inward orbital migration
to reverse such that the final semi-major axis
at
![]() P0 exceeds the initial one.
But note that the details of this evolution depend
on the manner in which the disc interacts with the companion
and will be discussed by one of us in a future publication.
Clearly the disc-companion interaction is very
different in the brown dwarf regime from the planetary one.
P0 exceeds the initial one.
But note that the details of this evolution depend
on the manner in which the disc interacts with the companion
and will be discussed by one of us in a future publication.
Clearly the disc-companion interaction is very
different in the brown dwarf regime from the planetary one.
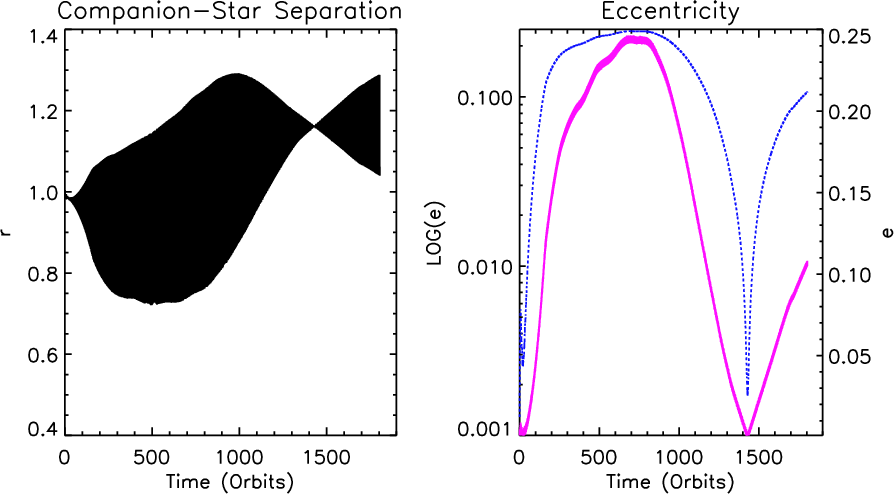 |
Figure 3:
This figure shows the evolution of the companion-star
orbital separation as a function of time in the first panel,
and the orbital eccentricity plotted as a log function (dotted line)
and linear function (solid line) in the second panel.
It is apparent that the eccentricity undergoes a period
of rapid growth after |
In order to explore why the disc itself becomes eccentric, an identical
simulation to N5 was performed, except that the companion was maintained
on a fixed circular orbit. According to
the discussion given below,
non linear coupling between an eccentric disc mode (with small e)
corresponding to an essentially time independent m=1 pattern
and the m=1component of the tidal potential and its disc response
propagating with pattern speed equal to the orbital frequency,
is expected to give rise to the excitation of an
m=2 spiral density wave emitted at the 1:3 outer eccentric
Lindblad resonance. The pattern speed of this wave is half the orbital
frequency. This wave can in turn couple back through the tidal
potential to produce a time independent wave and associated
potential with m=1. The removal of angular momentum from the disc
through such a potential
will cause the disc eccentricity to increase. This is because
no energy is removed along with the angular momentum,
from the fluid orbits, so they cannot remain circular.
If a wave with pattern speed equal to half the orbital frequency
is present and launched from the 1:3 resonance,
in a simulation with a companion on a fixed circular orbit, then it
accounts naturally for
the growth of disc eccentricity. Wave excitation is also expected
to cause a growth in orbital eccentricity when that is present
(see Lin & Papaloizou 1993a, and below).
The excited wave is expected to have a
pattern speed equal to
![]() Because the disc configuration changes to one in which
the pattern rotation period has doubled, the instability
produces a period doubling and so resembles a parametric instability.
Because the disc configuration changes to one in which
the pattern rotation period has doubled, the instability
produces a period doubling and so resembles a parametric instability.
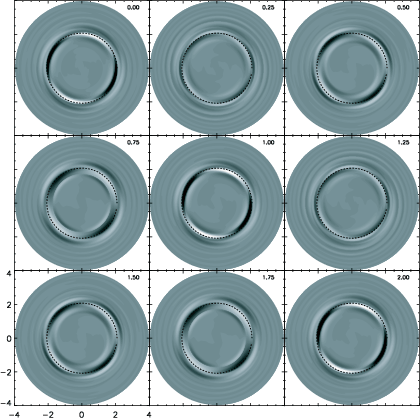
A plot of the disc surface density for the run with the companion on a fixed circular orbit is shown in Fig. 4, in a frame corotating with the orbit. The panels are separated by one third of the orbital period. The 1:2 outer Lindblad resonance is shown by the dotted line, and the eccentricity of the inner parts of the disc that lie just exterior to this resonance may be observed.
The disc surface density that resulted from the simulation
in which the companion remained on a fixed circular orbit
was Fourier transformed in azimuth, and the m=2 component was examined.
In line with our expectations, it was observed that once the inner disc was
cleared of material, the presence of the m=2 wave being launched from
the 1:3 outer eccentric Lindblad resonance became apparent, travelling with
a pattern speed ![]() .
This m=2 component of
.
This m=2 component of ![]() is plotted in Fig. 5 at different
times during an orbit.
Comparison between the first, fifth, and ninth panels, which are separated by an
orbital period of the star-companion system, show that the pattern does indeed
repeat after this time interval. Comparison between panels separated by
half an orbital period, such as the first and third, shows that the pattern
does not repeat after half an orbital period. An m=2 wave travelling
with the orbital frequency
is plotted in Fig. 5 at different
times during an orbit.
Comparison between the first, fifth, and ninth panels, which are separated by an
orbital period of the star-companion system, show that the pattern does indeed
repeat after this time interval. Comparison between panels separated by
half an orbital period, such as the first and third, shows that the pattern
does not repeat after half an orbital period. An m=2 wave travelling
with the orbital frequency ![]() would repeat after every half an orbital
period. The fact that the m=2 wave only repeats after every orbital period
indicates that it is being excited at the 1:3 resonance (indicated by the dashed
line in Fig. 5) with a pattern speed
would repeat after every half an orbital
period. The fact that the m=2 wave only repeats after every orbital period
indicates that it is being excited at the 1:3 resonance (indicated by the dashed
line in Fig. 5) with a pattern speed
![]() .
We conclude that a parametric instability is operating to excite this wave,
giving rise to an eccentric disc.
In calculation N5 where the star-companion orbit
is able to evolve, the interaction between the companion and the eccentric
disc leads to the growth of eccentricity of the companion orbit.
.
We conclude that a parametric instability is operating to excite this wave,
giving rise to an eccentric disc.
In calculation N5 where the star-companion orbit
is able to evolve, the interaction between the companion and the eccentric
disc leads to the growth of eccentricity of the companion orbit.
As described above, previous work on orbital eccentricity growth through disc-companion interactions indicated that direct resonant wave excitation at inner and outer eccentric Lindblad resonances should drive eccentricity, whereas interaction with material at corotating Lindblad resonances should cause it to damp (Artymowicz 1993; Lin & Papaloizou 1993a). In the simulations presented here, only the outer 1:3 resonance is important, and it is of interest to ask whether direct wave excitation at this resonance, or interaction with the disc eccentricity, is primarily responsible for the eccentricity growth of the companion orbit. To address this question, we performed simulations similar to run N5, but in which the surface density of the disc was Fourier analysed in azimuth. In these calculations the gravitational force of the disc acting on the star-companion orbit only included a contribution from an individual Fourier component (m=1, 2, 3, or 4), though the full potential of the star-companion system acting on the disc was included. We expect that if the interaction of the companion with the disc eccentricity is dominant in driving the companion eccentricity then the calculation including only the m=1 component of the disc gravitational potential will show more rapid growth of orbital eccentricity. Conversely, if resonant wave excitation of an m=2 wave at the 1:3 resonance was primarily responsible, then the calculation including only the m=2 component of the disc potential will show more rapid eccentricity growth. In fact, we find that the m=1 run showed a moderately larger eccentricity growth than the m=2 run, suggesting that the orbital interaction with the eccentric disc produces the stronger growth. This conclusion is further suggested by the estimates of the eccentricity growth rates presented in Sect. 5.10.
The runs including only the m=3 and m=4 terms showed negligible eccentricity growth.
Copyright ESO 2001