| Issue |
A&A
Volume 682, February 2024
|
|
|---|---|---|
| Article Number | L16 | |
| Number of page(s) | 5 | |
| Section | Letters to the Editor | |
| DOI | https://doi.org/10.1051/0004-6361/202348437 | |
| Published online | 19 February 2024 | |
Letter to the Editor
Star formation in outer rings of S0 galaxies
VI. NGC 1211: Bar resonance versus accretion
1
Sternberg Astronomical Institute of the Lomonosov Moscow State University, University av. 13 119234, Russia
e-mail: olga@sai.msu.su
2
Special Astrophysical Observatory of the Russian Academy of Sciences, Nizhnij Arkhyz 369167, Russia
e-mail: moisav@gmail.com
3
New York University Abu Dhabi, PO Box 129188 Abu Dhabi, UAE
e-mail: katkov.ivan@gmail.com
4
Center for Astrophysics and Space Science, NYU Abu Dhabi, PO Box 129188 Abu Dhabi, UAE
Received:
30
October
2023
Accepted:
27
January
2024
Aims. Though S0 galaxies are usually thought to be “red and dead”, they often present weak star formation organized in ring structures in their outer disks. We try to clarify the nature of this phenomenon and its difference from star formation in spiral galaxies. The nearby luminous S0 galaxy NGC 1211 is studied here.
Methods. By applying Fabry-Perot scanning interferometry at the Russian 6m telescope, we measured the gas rotation in the outer ring of the galaxy. We studied the pattern and properties of the brightest star formation regions with the tunable filter Mapper of Narrow Galaxy Lines (MaNGaL) at the 2.5 m telescope of the Caucasian Mountain Observatory of the SAI MSU.
Results. The gas excitation is strongly inhomogeneous along the ring: in the eastern part, HII-type excitation dominates, while the western part of the ring is partly excited by shocks, as revealed by the emission-line diagnostic diagram. The gas metallicity of the emission clumps in the outer ring also has a broad distribution. The star formation rate is currently falling and is in general too weak for the galaxy gas content. We conclude that the gas in the ring has been accreted recently, about 300 Myr ago, probably from an inclined direction, and that the accretion event has provoked a brief, ineffective starburst.
Key words: HII regions / galaxies: elliptical and lenticular / cD / galaxies: evolution / galaxies: individual: NGC 1211 / galaxies: kinematics and dynamics / galaxies: star formation
© The Authors 2024
 Open Access article, published by EDP Sciences, under the terms of the Creative Commons Attribution License (https://creativecommons.org/licenses/by/4.0), which permits unrestricted use, distribution, and reproduction in any medium, provided the original work is properly cited.
This article is published in open access under the Subscribe to Open model. Subscribe to A&A to support open access publication.
1. Introduction
The galaxy morphological type S0 was introduced to describe disk galaxies without spiral arms and without star formation within their stellar disks (Hubble 1936), and outer stellar rings were recognized by Hubble’s followers as common attributes of S0 galaxies (de Vaucouleurs 1959). Later, however, a decent amount of cold gas was found in many S0 galaxies (Welch et al. 2010), and this gas feeds star formation organized in ring structures in half of known gas-rich S0s (Pogge & Eskridge 1993). The Galaxy Evolution Explorer (GALEX) survey provided ultraviolet (UV) maps for many nearby early-type galaxies (Gil de Paz et al. 2007), and it became clear that more than half of outer stellar rings in S0s are bright in UV, thus betraying recent star formation on a timescale of a few hundred megayears (Kostiuk & Sil’chenko 2015). If the evolution of disk galaxies is driven by the persistent accretion of outer cold gas, the star formation in S0s is understandable because in sparse environments S0s can incur the same outer gas accretion as spirals, with the possibility of star formation in the accreted gas. However, the sources of outer gas accretion remain disputed. In this Letter we examine an outer star-forming ring in NGC 1211, a face-on nearby isolated S0 galaxy, by undertaking a spectral study of the ionized-gas kinematics, excitation, and metallicity.
The galaxy images, which include data from the photometric Dark Energy Camera Legacy Survey (DECaLS) (Dey et al. 2019) and GALEX along with our observations, are presented in Fig. 1. NGC 1211 is seen almost face-on; with the adopted distance of 29 Mpc, the radius of the outer blue ring is 8.4 kpc. The galaxy is barred and has a system of rings related to its strong bar; all the rings except the outermost one are red. The distance to the galaxy, 29 Mpc, differs strongly from what would be expected based on its Hubble velocity: a distance of 45 Mpc is given for NGC 1211 in the HyperLEDA database, and so the absolute magnitudes cited in our Table 1 are evidently overestimated. But several independent methods used to determine galaxy distances, including Tully-Fisher and fundamental-plane ones (NED), which also take local peculiar velocities around this highly isolated galaxy into account (Springob et al. 2014; Kourkchi & Tully 2017), give 28.7 to 30 Mpc. Therefore, we used D = 29 Mpc.
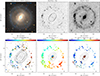 |
Fig. 1. Collection of images for NGC 1211: DECaLS color image with the positions of slits of the long-slit spectral exposures; MaNGaL images of NGC 1211 in the emission line Hα; a GALEX/near-UV image; the flux ratio of the emission line [N II]λ6583 to the Hα (smoothed with a Gaussian FWHM = 3 px); and the Fabry-Perot (FPI) data for NGC 1211 in the emission line Hα (the LOS velocity map and the gas velocity dispersion map). In each image, the red continuum contours from the corresponding datasets are overplotted. |
Global parameters of NGC 1211.
The galaxy is rich in HI: different surveys give total 21 cm flux values that range from 8.12 Jy km s−1 (van Driel et al. 2016) to 12.5 Jy km s−1 (Parkash et al. 2018). With our adopted distance of 29 Mpc, there is 2 × 10⁹ M⊙ of neutral hydrogen. Unfortunately, the high-resolution mapping of the neutral hydrogen has still not been obtained for this galaxy. We further investigated the gas in this galaxy by applying Fabry-Perot interferometry in the optical spectral range – in the Hα emission line of the ionized hydrogen – and narrowband imaging in strong emission lines.
2. Observations and the data
The log of the observations of NGC 1211 is given in Table 2. They were taken with the 2.5 m telescope of the Caucasian Mountain Observatory of the Sternberg Astronomical Institute of the Lomonosov Moscow State University (CMO SAI MSU) with the tunable-filter photometer Mapper of Narrow Galaxy Lines (MaNGaL) and with the 6 m telescope of the Special Astrophysical Observatory of the Russian Academy of Sciences (SAO RAS) with its scanning Fabry-Perot interferometer (FPI).
Log of observations of NGC 1211 with MaNGaL and FPI.
To study the gas kinematics in the Hα emission line, we obtained panoramic spectroscopic data by using the FPI operating as a mode of the SCORPIO-2 reducer (Afanasiev & Moiseev 2011) at the prime focus of the 6m SAO RAS telescope. The SCORPIO-2/FPI has a field of view of 6.4 arcmin. With the 186th-order interferometer, it provides a free spectral range (interfringe) of 35 Å with a spectral resolution of 1.7 Å (78 km s−1), which results in panoramic spectroscopy in the narrow spectral range around the selected emission line with a spatial sampling of 0.78″ (with a binning of 4 × 4). The observational data reduction was performed in a standard way, as described by Moiseev & Egorov (2008) and Moiseev (2021). By fitting the Hα emission line with a Voigt profile, we obtained full maps of the galaxy in the red continuum and in the Hα emission line, the line-of-sight (LOS) velocity field of the ionized gas, and the LOS ionized-gas velocity dispersion distribution over the extended body of the galaxy.
We also carried out observations at the 2.5 m CMO SAI MSU telescope with the narrowband photometer MaNGaL (Moiseev et al. 2020). The observations were performed in three redshifted emission lines, [O III]λ5007, Hα, and [N II]λ6583, within the 13 Å passband, to study the surface brightness distributions in these lines. The detector, CCD iKon-M934 with a format of 1024 × 1024, provided a field of view of 5.4′ and a sampling of 0.33″ per pixel.
To compare and to refine the emission-line flux ratios in the ring, we also employed two long-slit spectra obtained at the 10 m Southern African Large Telescope (SALT) with the Robert Stobie Spectrograph (RSS). The spectrum at the slit orientation of PA = 30°, reported in detail in Katkov et al. (2015), was taken with grating PG900 (R ≈ 1300) and covers the spectral range 3770–6845 Å. Another spectrum taken along the bar (PA = 148°) with grating PG1300 (R ≈ 2200) provides a spectral range of 4675–6690 Å, which covers all strong emission lines except [S II]λ6716,30.
To also inspect the gas and star kinematics in the central part of NGC 1211, which is almost devoid of Hα emission but bright in the [N II]λ6583 line, we used public Calar Alto Legacy Integral Field Area (CALIFA) survey data (Sánchez et al. 2016) that cover the central arcminute of the galaxy. To study the large-scale photometric structure of the galaxy, we used gr-band images from the DECaLS data (Dey et al. 2019). To measure star formation rate (SFR) in the ring, we used UV images of NGC 1211 obtained by the space telescope GALEX.
3. The gas kinematics in the ring of NGC 1211
The cosine-like character of the LOS gas velocity variations along the ring (Fig. 2) we measured in the Hα emission line is consistent with the hypothesis of planar circular gas rotation. The orientation of the line of nodes of the gas rotation plane traced by the maximum LOS velocity gradient is at PAkin = 234° – rather close to the photometric major axis we determined just beyond the outer ring, R ≈ 70″, as PA0 = 42° (222°). Taking into account the very low ellipticity of the outer isophotes in NGC 1211, ⟨(1 − b/a)⟩ = 0.047 at the radius of the ring, the estimate of PA(phot) cannot be very precise, so we only suggest that the line of nodes of the plane of the gaseous disk is close to that of the stellar disk. Moreover, a closer inspection of the shape of the LOS gas velocity variations along the ring reveals their slight asymmetry with respect to the line of nodes. We repeated this analysis, this time including possible radial gas motions in our model. The software DETKA (Moiseev et al. 2004), which explores the tilted-ring approach, allows a flag that includes possible radial gas motions to be incorporated into the analysis. These motions appear to be non-negligible, at the level of 10–20 km s−1; in the presence of radial motions, the orientation of the line of nodes changes to PAkin = 223 ± 2° – even closer to the photometric major axis. To also incorporate the stellar kinematics into our analysis, we applied the tilted-ring method (adopted in DETKA by Moiseev et al. 2004) to the central LOS velocity field of the stellar component derived from the panoramic spectral data of the CALIFA survey. To avoid influence from the bar noncircular motions, we selected the radial range within the bulge domination area, at R < 8″; there we find PAkin(*) = 229 ± 2°.
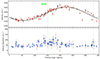 |
Fig. 2. Azimuthal dependence of the LOS gas velocities in the ring. |
Hence, we have found that the lines of nodes of the gaseous and stellar rotation planes are in agreement. However, to conclude that the planes are coincident, we must also prove that their inclinations are in agreement. Here there is a problem. With the outer isophote ellipticity, ⟨(1 − b/a)⟩ = 0.032 at R = 74 − 77″, the disk inclination must be less than 20°, even for a thick stellar disk with q0 ≈ 0.4. Therefore, the LOS gas velocity variation amplitude along the ring, 75–85 km s−1, results in a rotation velocity of 240 km s−1 due to the factor of (sin i)−1. Meantime, the Tully-Fisher baryonic relation (Lelli et al. 2019) predicts for NGC 1211, with its baryonic total mass of 3.4 × 10¹⁰ M⊙ (Table 1), a flat rotation velocity of 170 km s−1, which requires the gaseous disk inclination to be ≈30°. Therefore, we cannot be sure that the gaseous and stellar rotation planes have exactly the same inclinations, and we cannot rule out an inclined orientation for the outer gaseous ring.
4. Emission lines in the ring of NGC 1211
Narrowband imaging of NGC 1211 by MaNGaL has revealed a lot of compact emission-line regions in the outer ring (Fig. 1). The similarity of the emission-line and UV flux distributions implies that these compact emission-line clumps may be HII regions. We checked this hypothesis by considering the nitrogen-to-hydrogen line flux ratio provided by our MaNGaL data: it is known that low values of the indicator N2 ≡ log([N II]λ6583/Hα) mean that gas excitation is due to young stars, while high values imply a shock excitation for non-nuclear emission-line sites (e.g., Kewley et al. 2006). For example, for log([O III]λ5007/Hβ) = 0, which is the mean of our long-slit measurements (Fig. 3), the boundary between the HII-like excitation and the “composite” one that includes the influence of shock waves is set at N2 = −0.42 (Kewley et al. 2006).
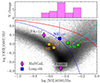 |
Fig. 3. Emission lines in the ring of NGC 1211: the distribution of 25 emission-line clumps over the parameter N2 = log([N II]λ6583/Hα) and the BPT diagram for the ring clumps, from the long-slit spectroscopy (squares) and from the MaNGaL imaging (diamonds). On the BPT diagram, the separating lines are from Kewley et al. (2001 solid red line) and Kauffmann et al. (2003 dashed blue line); the shock-excitation models from Allen et al. (2008) are shown as dashed and dashed-dotted blue lines for vshock = 100 km s−1 and 150 km s−1. Our long-slit data are marked with their distances from the center (blue means the northeast, orange means the southeast, and green means the northwest). For the MaNGaL data along the ring, the clump position angles with respect to the center are given. The gray background distribution corresponds to emission-line measurements from the Reference Catalog of Spectral Energy Distributions (RCSED) (http://rcsed.sai.msu.ru, Chilingarian et al. 2017). |
In the upper panel of Fig. 3, we show the distribution of the emission-line clumps detected in the NGC 1211 outer ring over the parameter N2. The distribution is rather broad and may reflect real physical variations in the gas excitation mechanism in the ring along the azimuth. For example, all the clumps with a high N2 are concentrated in the western part of the ring (Fig. 4; in the PA range 40–210°, the mean ⟨N2⟩= − 0.488 ± 0.014, and in the PA range of 210–360°, ⟨N2⟩= − 0.31 ± 0.02).
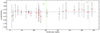 |
Fig. 4. Azimuthal dependence of the flux ratio N2 ≡ log ([N II]λ6583/ Hα) in the ring. The horizontal line marks the boundary between the HII-like excitation (below it) and other mechanisms (more probably shock-like ones). |
For the regions where measurements of the [O III]λ5007 emission line are available, we also used the Baldwin-Terlevich-Phillips (BPT) diagram proposed by Baldwin et al. (1981) to refine the excitation mechanism of the ionized gas. In the lower panel of Fig. 3, we present two HII regions of the ring for which the MaNGaL data show relatively strong [O III]λ5007 emission, those in the directions PA = 14° and PA = 80°, as well as the SALT long-slit spectroscopy data in two slit orientations, PA = 30° and PA = 148°. The location of the line measurements on the BPT-[S II] diagram is only available for the northeastern ring clump at the PA = 30° slit, which also implies excitation by young stars (Katkov et al. 2015). For the MaNGaL data, we calculated the Hβ fluxes by dividing the Hα fluxes by 2.86 – a theoretical Balmer decrement for Te = 104 K (Osterbrock & Ferland 2006) under the assumption of a negligible dust effect. If we accept the Balmer decrement in the ring revealed by our long-slit cross sections, ∼4.0, the MaNGaL points will move up by ∼0.1 dex. The asymmetry of the excitation along the azimuth angle is again evident: the eastern clumps show possible excitation by young stars, while the western clumps demonstrate composite excitation.
The median value of the parameter N2 in the ring of NGC 1211 that we measured from the MaNGaL data, ⟨N2⟩= − 0.43 (Fig. 3, upper panel), corresponds to the gas metallicity 12 + log(O/H) = 8.66 from the calibration by Pettini & Pagel (2004) and 12 + log(O/H) = 8.54 from the calibration by Marino et al. (2013). The latter estimate is in agreement with the mean gas metallicity for NGC 1211, 8.525 ± 0.105, obtained by the CALIFA team (Sánchez et al. 2017) via the N2 calibration by Marino et al. (2013), though CALIFA probed the inner part of NGC 1211. But the extreme clumps in the distribution shown in the upper panel of Fig. 3 reach N2 = −0.7, and these few clumps may have a lower metallicity, –12 + log(O/H) = 8.50, according to the calibration by Pettini & Pagel (2004) and the 12 + log(O/H) = 8.42 from Marino et al. (2013).
The long-slit data that cover the [O III]λ5007 line and Hβ allowed us to estimate the gas metallicity in the ring by using the indicator O3N2 ≡ log([O III]λ5007/Hβ) – log([N II]λ6583/Hα), which is stable against the diffuse-gas addition and works well in the composite area of the BPT diagram (Kumari et al. 2019). Our long-slit cross section at PA = 30° reveals O3N2 = +0.65 ± 0.62 at the northern tip of the ring, which corresponds to 12 + log(O/H) = 8.52 from the Pettini & Pagel (2004) calibrations and 12 + log(O/H) = 8.39 from the Marino et al. (2013) calibrations. The long-slit cross section at PA = 148° reveals O3N2 = +0.30 ± 0.13 at the northwestern tip of the ring, which corresponds to 12 + log(O/H) = 8.64 from the Pettini & Pagel (2004) calibrations and 12 + log(O/H) = 8.47 from the Marino et al. (2013) calibrations. For the southeastern site of the ring at this position angle, two indicators, N2 and O3N2, give consistent estimates of the oxygen abundances: 12 + log(O/H) = 8.57 from the Pettini & Pagel (2004) calibrations and 12 + log(O/H) = 8.45 from the Marino et al. (2013) calibrations.
5. Discussion
We wanted to determine the origin of the star-forming ring in NGC 1211. The galaxy has a strong bar, which may provide gas concentration at resonance radii; in particular, the outer Lindblad resonance (OLR) is suitable for an outer ring. However, the ratio of the radii in NGC 1211, Rring/Rbar ≈ 3, seems too large for a ring at the OLR. We estimated the bar radius in NGC 1211 by applying an isophote analysis to the broadband images and by taking the location of the isophote ellipticity maximum as the bar radius; it appears to be 24″. Buta (2017) find Rring/Rbar ≈ 2 − 2.5 for the OLR outer rings in barred early-type galaxies. In NGC 1211 we see a red ring at R ≈ 40″, which may be a resonance ring related to the bar. On the other hand, the outer star-forming ring is probably an accretion one, and its radius is related to the orbital momentum of the accreted gas.
The direction and the source of the gas accretion remain unclear. In some S0s with star-forming rings that we have studied (Sil’chenko et al. 2023a), we also saw an asymmetry of the excitation along the ring. However, the segments of shock-like excitation in NGC 932 and NGC 160 are tight enough that we can treat them as points of gas entry marked by the collision of the inflows with the proper galaxy gas. In NGC 1211 the asymmetry is significant: almost half of the ring shows composite excitation on the BPT diagram, and we cannot identify a cone with an opening of more than 100 degree as the direction of the gas inflow. A possible way to determine the gas inflow direction would be to use the chemical inhomogeneity of the gas in the ring, with the lowest metallicity potentially pointing to the freshest gas. However, the low-N2 gas can be seen at three different sites: PA ≈ 10°, PA ≈ 120°, and PA ≈ 210°. Of the three, the direction PA ≈ 120° looks the most promising because here the ring has a double structure and has an increased gas velocity dispersion (see Fig. 1), which may indicate ring splitting at the LOS. If the accretion event was indeed some 300 Myr ago (based on the orbital period at the radius of the ring), then the accreted gas is now finishing its first revolution.
The rather low metallicity of the accreted gas looks unusual because the outermost rings in S0s have a nearly solar gas metallicity (Sil’chenko et al. 2019; Pérez & Freeman 2006). Based on this, we suggest that a cosmological filament is a source of the outer gas supply. Interestingly, to the east of NGC 1211 – in the direction of a possible inflow – we note a diffuse dwarf, the lone satellite of this isolated galaxy (Román et al. 2019). Recently, we detected filament-driven gas accretion to the outer ring of another isolated galaxy, UGC 4599 (Sil’chenko et al. 2023b), and again, within this filament, traced by 21 cm mapping in this case, a dwarf satellite is seen.
We determined the SFR in the ring by using three indicators, near-UV and far-UV fluxes from the GALEX data and Hα flux from our MaNGaL data, and their calibrations by Kennicutt & Evans (2012). We obtain 0.072 ± 0.015 M⊙ yr−1, 0.042 ± 0.020 M⊙ yr−1, and 0.044 ± 0.003 M⊙ yr−1, respectively. Since the longest-timescale averaging of the SFR corresponds to the near-UV indicator, the higher SFR provided by this indicator implies that the star formation burst in the ring is dimming quickly. By plotting NGC 1211 together with two other face-on UV-ringed barred S0 galaxies, NGC 1533 and NGC 1543 (Proshina et al. 2024), we see that, while having normal hydrogen content for its stellar mass, NGC 1211 is at the bottom of the “green valley” and is thus experiencing star formation that is too weak considering its gas content (see in Fig. 5). The situation is similar for NGC 1533 and NGC 1543, where the gas has come from the outside from an inclined direction (Proshina et al. 2024). This also helps confirm our earlier idea (Sil’chenko et al. 2019), that the gas inflow from an inclined direction provokes heating of the gas and suppresses star formation.
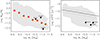 |
Fig. 5. Position of a few face-on barred lenticular galaxies with outer star-forming rings at the scaling relations derived from extended GALEX Arecibo SDSS survey (xGASS) data (Catinella et al. 2018; Janowiecki et al. 2020). The data for the galaxies are taken from Parkash et al. (2018). The large orange dots in the left panel and the black line in the right panel mark the medians and the main sequence of star-forming galaxies, respectively; dotted lines indicate the ±0.3 dex interval around the main sequence. |
Acknowledgments
This study is based on the data obtained at the unique scientific facility the Big Telescope Alt-azimuthal SAO RAS and was supported under the Ministry of Science and Higher Education of the Russian Federation grant 075-15-2022-262 (13.MNPMU.21.0003). The renovation of 6 m telescope equipment is currently provided within the national project “Science”. A part of this work is based on observations made with the Southern African Large Telescope (SALT), with programme 2015-2-SCI-022. The work used the public data of the Legacy Survey project (http://legacysurvey.org), that consists of three individual and complementary surveys: the Dark Energy Camera Legacy Survey (DECaLS; Proposal ID #2014B − 0404; PIs: David Schlegel and Arjun Dey), the Beijing-Arizona Sky Survey (BASS; NOAO Prop. ID #2015A − 0801; PIs: Zhou Xu and Xiaohui Fan), and the Mayall z-band Legacy Survey (MzLS; Prop. ID #2016A − 0453; PI: Arjun Dey). DECaLS, BASS and MzLS together include data obtained, respectively, at the Blanco telescope, Cerro Tololo Inter-American Observatory, NSF’s NOIRLab; the Bok telescope, Steward Observatory, University of Arizona; and the Mayall telescope, Kitt Peak National Observatory, NOIRLab. The Legacy Surveys project is honored to be permitted to conduct astronomical research on Iolkam Duág (Kitt Peak), a mountain with particular significance to the Tohono Oódham Nation. The NASA GALEX mission data were taken from the Mikulski Archive for Space Telescopes (MAST).
References
- Afanasiev, V. L., & Moiseev, A. V. 2011, Balt. Astron., 20, 363 [NASA ADS] [Google Scholar]
- Allen, M. G., Groves, B. A., Dopita, M. A., Sutherland, R. S., & Kewley, L. J. 2008, ApJS, 178, 20 [Google Scholar]
- Baldwin, J. A., Phillips, M. M., & Terlevich, R. 1981, PASP, 93, 5 [Google Scholar]
- Buta, R. J. 2017, MNRAS, 470, 3819 [Google Scholar]
- Buta, R. J. 2019, MNRAS, 488, 590 [Google Scholar]
- Catinella, B., Saintonge, A., Janowiecki, S., et al. 2018, MNRAS, 476, 875 [NASA ADS] [CrossRef] [Google Scholar]
- Chilingarian, I. V., Zolotukhin, I. Y., Katkov, I. Y., et al. 2017, ApJS, 228, 14 [NASA ADS] [CrossRef] [Google Scholar]
- de Vaucouleurs, G. 1959, Handbuch der Physik, 53, 275 [Google Scholar]
- de Vaucouleurs, G., & de Vaucouleurs, A. 1991, Third Reference Catalogue of Bright Galaxies. Volume I: Explanations and References (New York: Springer) [Google Scholar]
- Dey, A., Schlegel, D. J., Lang, D., et al. 2019, AJ, 157, A168 [NASA ADS] [CrossRef] [Google Scholar]
- Gil de Paz, A., Boissier, S., Madore, B. F., Seibert, M., Joe, Y. H., et al. 2007, ApJS, 173, 185 [NASA ADS] [CrossRef] [Google Scholar]
- Hubble, E. P. 1936, The Realm of the Nebulae (New Haven: Yale Univ. Press) [Google Scholar]
- Janowiecki, S., Catinella, B., Cortese, L., Saintonge, A., & Wang, J. 2020, MNRAS, 493, 1982 [Google Scholar]
- Katkov, I. Yu., Kniazev, A. Yu., & Sil’chenko, O. K. 2015, AJ, 150, 24 [NASA ADS] [CrossRef] [Google Scholar]
- Kauffmann, G., Heckman, T. M., Tremonti, Ch., et al. 2003, MNRAS, 346, 1055 [NASA ADS] [CrossRef] [Google Scholar]
- Kennicutt, R. C., Jr, & Evans, N. J., II 2012, ARA&A, 50, 531 [NASA ADS] [CrossRef] [Google Scholar]
- Kewley, L. J., Dopita, M. A., Sutherland, R. S., Heisler, C. A., & Trevena, J. 2001, ApJ, 556, 121 [Google Scholar]
- Kewley, L. J., Groves, B., Kauffmann, G., & Heckman, T. 2006, MNRAS, 372, 961 [Google Scholar]
- Kostiuk, I. P., & Sil’chenko, O. K. 2015, Astrophys. Bull., 70, 280 [NASA ADS] [CrossRef] [Google Scholar]
- Kourkchi, E., & Tully, R. B. 2017, ApJ, 843, 16 [NASA ADS] [CrossRef] [Google Scholar]
- Kumari, N., Maiolino, R., Belfiori, F., & Curti, M. 2019, MNRAS, 485, 367 [NASA ADS] [CrossRef] [Google Scholar]
- Lelli, F., McGaugh, S. S., Schombert, J. M., et al. 2019, MNRAS, 484, 3267 [NASA ADS] [CrossRef] [Google Scholar]
- Makarov, D., Prugniel, Ph., Terekhova, N., Courtois, H., & Vauglin, I. 2014, A& A, 570, A13 [NASA ADS] [CrossRef] [EDP Sciences] [Google Scholar]
- Marino, R. A., Rosales-Ortega, F. F., Sánchez, S. F., et al. 2013, A&A, 559, A114 [NASA ADS] [CrossRef] [EDP Sciences] [Google Scholar]
- Moiseev, A. V. 2021, Astrophys. Bull., 76, 316 [NASA ADS] [CrossRef] [Google Scholar]
- Moiseev, A. V., & Egorov, O. V. 2008, Astrophys. Bull., 63, 181 [NASA ADS] [CrossRef] [Google Scholar]
- Moiseev, A. V., Valdés, J. R., & Chavushyan, V. H. 2004, A&A, 421, 433 [NASA ADS] [CrossRef] [EDP Sciences] [Google Scholar]
- Moiseev, A., Perepelitsyn, A., & Oparin, D. 2020, Exp. Astron., 50, 199 [NASA ADS] [CrossRef] [Google Scholar]
- Osterbrock, D. E., & Ferland, G. J. 2006, Astrophysics of Gaseous Nebulae and Active Galactic Nuclei (Sausalito, CA: University Science Books) [Google Scholar]
- Parkash, V., Brown, M. J. I., Jarrett, T. H., & Bonne, N. J. 2018, ApJ, 864, 40 [NASA ADS] [CrossRef] [Google Scholar]
- Pérez, I., & Freeman, K. 2006, A&A, 454, 165 [NASA ADS] [CrossRef] [EDP Sciences] [Google Scholar]
- Pettini, M., & Pagel, B. E. J. 2004, MNRAS, 348, L59 [NASA ADS] [CrossRef] [Google Scholar]
- Pogge, R. W., & Eskridge, P. B. 1993, AJ, 106, 1405 [NASA ADS] [CrossRef] [Google Scholar]
- Proshina, I., Sil’chenko, O., & Kniazev, A. 2024, MNRAS, submitted [Google Scholar]
- Román, J., Beasley, M. A., Ruiz-Lara, T., & Valls-Gabaud, D. 2019, MNRAS, 486, 823 [CrossRef] [Google Scholar]
- Sánchez, S. F., Garcia-Benito, R., Zibetti, S., et al. 2016, A&A, 594, A36 [NASA ADS] [CrossRef] [EDP Sciences] [Google Scholar]
- Sánchez, S. F., Barrera-Ballesteros, J. K., Sánchez-Menguiano, L., et al. 2017, MNRAS, 469, 2121 [CrossRef] [Google Scholar]
- Sil’chenko, O. K., Moiseev, A. V., & Egorov, O. V. 2019, ApJS, 244, 6 [Google Scholar]
- Sil’chenko, O. K., Moiseev, A. V., Oparin, D. V., Maleeva, E. A., & Proshina, I. S. 2023a, Astrophys. Bull., 78, 304 [CrossRef] [Google Scholar]
- Sil’chenko, O., Moiseev, A., Oparin, D., Beckman, J. E., & Font, J. 2023b, A&A, 669, L10 [NASA ADS] [CrossRef] [EDP Sciences] [Google Scholar]
- Springob, Ch. M., Magoulas, Ch., Colless, M., et al. 2014, MNRAS, 445, 2677 [NASA ADS] [CrossRef] [Google Scholar]
- van Driel, W., Butcher, Z., Schneider, S., et al. 2016, A&A, 595, A118 [NASA ADS] [CrossRef] [EDP Sciences] [Google Scholar]
- Welch, G. A., Sage, L. J., & Young, L. M. 2010, ApJ, 725, 100 [NASA ADS] [CrossRef] [Google Scholar]
All Tables
All Figures
|
Fig. 1. Collection of images for NGC 1211: DECaLS color image with the positions of slits of the long-slit spectral exposures; MaNGaL images of NGC 1211 in the emission line Hα; a GALEX/near-UV image; the flux ratio of the emission line [N II]λ6583 to the Hα (smoothed with a Gaussian FWHM = 3 px); and the Fabry-Perot (FPI) data for NGC 1211 in the emission line Hα (the LOS velocity map and the gas velocity dispersion map). In each image, the red continuum contours from the corresponding datasets are overplotted. |
| In the text | |
|
Fig. 2. Azimuthal dependence of the LOS gas velocities in the ring. |
| In the text | |
|
Fig. 3. Emission lines in the ring of NGC 1211: the distribution of 25 emission-line clumps over the parameter N2 = log([N II]λ6583/Hα) and the BPT diagram for the ring clumps, from the long-slit spectroscopy (squares) and from the MaNGaL imaging (diamonds). On the BPT diagram, the separating lines are from Kewley et al. (2001 solid red line) and Kauffmann et al. (2003 dashed blue line); the shock-excitation models from Allen et al. (2008) are shown as dashed and dashed-dotted blue lines for vshock = 100 km s−1 and 150 km s−1. Our long-slit data are marked with their distances from the center (blue means the northeast, orange means the southeast, and green means the northwest). For the MaNGaL data along the ring, the clump position angles with respect to the center are given. The gray background distribution corresponds to emission-line measurements from the Reference Catalog of Spectral Energy Distributions (RCSED) (http://rcsed.sai.msu.ru, Chilingarian et al. 2017). |
| In the text | |
|
Fig. 4. Azimuthal dependence of the flux ratio N2 ≡ log ([N II]λ6583/ Hα) in the ring. The horizontal line marks the boundary between the HII-like excitation (below it) and other mechanisms (more probably shock-like ones). |
| In the text | |
|
Fig. 5. Position of a few face-on barred lenticular galaxies with outer star-forming rings at the scaling relations derived from extended GALEX Arecibo SDSS survey (xGASS) data (Catinella et al. 2018; Janowiecki et al. 2020). The data for the galaxies are taken from Parkash et al. (2018). The large orange dots in the left panel and the black line in the right panel mark the medians and the main sequence of star-forming galaxies, respectively; dotted lines indicate the ±0.3 dex interval around the main sequence. |
| In the text | |
Current usage metrics show cumulative count of Article Views (full-text article views including HTML views, PDF and ePub downloads, according to the available data) and Abstracts Views on Vision4Press platform.
Data correspond to usage on the plateform after 2015. The current usage metrics is available 48-96 hours after online publication and is updated daily on week days.
Initial download of the metrics may take a while.