| Issue |
A&A
Volume 678, October 2023
|
|
|---|---|---|
| Article Number | A147 | |
| Number of page(s) | 5 | |
| Section | Extragalactic astronomy | |
| DOI | https://doi.org/10.1051/0004-6361/202347735 | |
| Published online | 16 October 2023 | |
Preprocessing in small groups: Three simulated galaxies interacting prior to cluster infall
Nicolaus Copernicus Astronomical Center, Polish Academy of Sciences, Bartycka 18, 00-716 Warsaw, Poland
e-mail: lokas@camk.edu.pl
Received:
16
August
2023
Accepted:
4
September
2023
The formation of galaxy clusters is a complicated process that probably involves the accretion of galaxies in groups, as observed in nearby clusters, such as Virgo and Fornax. The members of the groups undergo “preprocessing” prior to cluster infall, which affects their stellar populations and morphology. In this paper, I present an extreme example of such an accretion event selected from the IllustrisTNG100 simulation. The group, composed of three full-sized disky galaxies and a number of smaller satellites, is accreted early, with the first pericenter around the cluster at redshift z = 1.3. Before the infall, the three galaxies interact strongly in pairs within the group, which produces tidally induced bars in the two more massive ones. The interactions also lead to mass exchange and trigger some star formation activity resulting in temporary rejuvenation of their stellar populations. After infall, they all undergo seven pericenter passages around the cluster, experiencing strong mass loss in the dark matter and gas components, as well as reddening of the stellar populations. Their tidally induced bars are, however, preserved and even enhanced probably due to the loss of gas via ram-pressure stripping in the intracluster medium. The study demonstrates that group accretion can happen very early in cluster formation and proposes another scenario for the formation of tidally induced bars.
Key words: galaxies: evolution / galaxies: formation / galaxies: interactions / galaxies: kinematics and dynamics / galaxies: spiral / galaxies: structure
© The Authors 2023
 Open Access article, published by EDP Sciences, under the terms of the Creative Commons Attribution License (https://creativecommons.org/licenses/by/4.0), which permits unrestricted use, distribution, and reproduction in any medium, provided the original work is properly cited.
This article is published in open access under the Subscribe to Open model. Subscribe to A&A to support open access publication.
1. Introduction
According to the theory of hierarchical structure formation in the Universe dominated by cold dark matter, galaxy clusters are the biggest gravitationally bound and virialized objects that have formed as of the present time. The formation of galaxy clusters is a complicated process that is not yet fully understood. They do not form by accreting galaxies one by one, nor do they collapse and virialize as a large region containing many galaxies over a short timescale. Instead, many galaxies are accreted in groups, and while belonging to the groups they undergo “preprocessing,” which can include morphological, dynamical, and stellar population changes taking place before the actual infall into the cluster and strong evolution inside it (Fujita 2004; Cortese et al. 2006; Haines et al. 2015).
Cases of groups being accreted onto clusters have been studied observationally mostly in nearby clusters. For example, the nearby Fornax cluster is known to possess a neighboring Fornax A group and Su et al. (2021) have recently studied the signs of preprocessing between the Fornax main cluster and the group using the Fornax Deep Survey. Chung et al. (2021) probed chemical preprocessing in star-forming dwarf galaxies in filamentary structures that are physically connected to the Virgo cluster, while Bidaran et al. (2022) studied the effect of preprocessing on the stellar populations of dwarf elliptical galaxies accreted onto the Virgo cluster 2 − 3 Gyr ago as members of a massive galaxy group. Sengupta et al. (2022) studied the more distant Abell 1882 at redshift z = 0.14, a massive system including several comparably rich substructures surrounded by filaments, and they found that quenching of star formation occurs in the infall regions of these structures even before the galaxies enter the denser group environment. Sarron et al. (2019) identified cosmic filaments around even more distant clusters at redshifts 0.15 < z < 0.7 and found galaxy-type gradients and other clues for preprocessing in such filaments that could be due to small galaxy groups.
The possibility of detection of subtle features that may result from preprocessing in groups is naturally limited in higher redshift objects, so the early stages of cluster formation are presently beyond the reach of observations. However, they can be studied in cosmological simulations that allow one to follow the evolution of galaxies from the early stages with sufficient resolution to identify features that could be the imprint from preprocessing in groups. After the first conflicting results from simulations concerning the role of groups in cluster formation (Berrier et al. 2009; McGee et al. 2009), the consensus has been that the accretion in groups plays an important role in this process.
For example, De Lucia et al. (2012) used the results of the Millennium Simulation (Springel et al. 2005) aided by semi-analytic models and found that large fractions of group and cluster galaxies have been preprocessed as satellites of groups with mass ∼1013 M⊙. Benavides et al. (2020) studied ten massive clusters from the cosmological simulation Illustris and determined that on average about 40% of galaxies surviving at z = 0 were accreted as part of groups and did not infall directly from the field. Most recently, Haggar et al. (2023) studied a large sample of galaxy clusters from The Three Hundred project and more than a thousand groups passing through a cluster to find that half of group galaxies become gravitationally unbound from the group by the first pericenter and most groups quickly mix with the cluster satellite population.
Very promising tools to address these issues were provided by the simulations from the IllustrisTNG project (Springel et al. 2018; Marinacci et al. 2018; Naiman et al. 2018; Nelson et al. 2018, 2019; Pillepich et al. 2018), where the evolution of galaxies was followed by solving for the gravity and magnetohydrodynamics, and applying subgrid physics in the form of prescriptions for star formation, galactic winds, magnetic fields, and the feedback from the active galactic nuclei (AGN). Numerous analyses of the properties of galaxies that formed in these simulations have demonstrated that they are able to reproduce the main features of galaxy populations found in observations. In particular, they have been successful in reproducing many properties of galaxy clusters and the processes involved in galaxy evolution inside them (Pillepich et al. 2018; Gupta et al. 2018; Barnes et al. 2018; Yun et al. 2019; Sales et al. 2020; Joshi et al. 2020; Łokas 2020b, 2023; Dacunha et al. 2022).
In this Paper, I present an extreme case of a small group of galaxies infalling into a cluster very early in terms of the cosmological timescale, selected from IllustrisTNG simulations. The galaxies were found to interact strongly during the infall, which led to the formation of tidally induced bars, a phenomenon well described in the literature (Noguchi 1987; Gerin et al. 1990; Łokas 2018; Peschken & Łokas 2019). The bars were then enhanced and preserved during the evolution in the cluster even though the galaxies followed quite tight orbits with many pericenter passages. Although the emphasis here is on the morphological evolution of the galaxies, I also discuss some properties of their stellar populations, such as the color and star formation rate (SFR).
2. Results
2.1. Identification of the group
The group was identified in the IllustrisTNG100-1 run following an earlier study of bar-like galaxies in IllustrisTNG (Łokas 2021). In that study I described a sample of galaxies with total stellar masses greater than 1010 M⊙ selected based on the single condition of a low enough ratio of the intermediate to long axis of the stellar component, b/a < 0.6. The two biggest galaxies of the group, ID96526 and ID96527 (all identification numbers are given at z = 0), were included among the bar-like galaxies of that study and had very similar masses and histories. They were assigned to the class A of that sample, as galaxies that experienced strong interactions with massive objects, which probably led to the formation of a tidally induced bar-like shape.
It turned out that the two galaxies were accreted quite early by a bigger galaxy, ID96500, which later became the central galaxy of a cluster (with a total mass of 1.8 × 10¹⁴ M⊙ at z = 0). A detailed study of their evolution revealed that they interacted with each other during the infall and that another nearby galaxy, ID96543, also interacted with them at this time. This galaxy, although smaller in mass, turned out to have played an important role in the evolution of the group. The three galaxies, the most massive members of the group, were accompanied by a number of smaller satellites that did not affect the evolution significantly.
Figure 1 shows the images of the infalling group of galaxies in three components: dark matter, stars, and gas, in terms of their column densities, at t = 4 Gyr (z = 1.6). The three biggest galaxies of the group are well visible, especially in the dark matter component shown in the upper panel. The brightest cluster galaxy (BCG) of the forming cluster can be found in the upper left part of each panel.
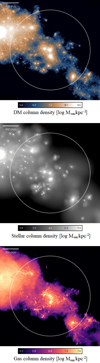 |
Fig. 1. Column densities of dark matter, stars, and gas (from top to bottom) in a cutout from the IllustrisTNG100 simulation containing the infalling group of galaxies at t = 4 Gyr (z = 1.6). The images are centered on galaxy ID96543, the galaxy ID96527 is visible to the left of it, and ID96526 is beneath it. The BCG of the forming cluster, into which the group is infalling, is visible in the upper left part of each panel. |
2.2. Orbital evolution
The orbital evolution of the interacting galaxies is shown in panels a and b of Fig. 2. Panel a plots the distance of each of the three galaxies from the BCG of the cluster. One can see that they all experienced their first pericenter around t = 4.8 Gyr and all had seven pericenters around the cluster during their whole lifetime. In panel b I show the evolution of the distance between each pair of the three galaxies. The plot demonstrates that for about 2 Gyr, that is between t = 3.5 and t = 5.5 Gyr, the three galaxies remained within 200 kpc of each other.
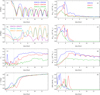 |
Fig. 2. Evolution of different properties of the three galaxies over time. Panels a and b illustrate the orbital history of the galaxies, with panel a showing the distance of each galaxy from the center of the forming cluster and panel b the distance between each pair of galaxies. Panels e–g show the evolution of the total mass of each galaxy in different components, dark matter, gas, and stars, respectively. Panel c presents the evolution of the bar mode A2 in each galaxy, measured within 2r1/2. Panels d and h show the evolution of the color and SFR in the galaxies. The color coding of the lines in panels c, d and f–h is the same as in panel e. The vertical dashed gray line in all panels indicates the time (t = 4 Gyr, z = 1.6) for which the images of the group are shown in Fig. 1. |
The galaxies ID96526 and ID96543 (cyan line) interacted particularly strongly around t = 4 Gyr, galaxies ID96526 and ID96527 (magenta line) around t = 5 Gyr, while ID96527 and ID96543 (orange line) remained within ∼100 kpc from each other. The first of these strong interactions took place before the galaxies experienced their first pericenter passage around the cluster, while the second one took place soon afterwards. After infall into the forming cluster, the group dissolved in the sense that each of the galaxies followed its own orbit around the cluster, although ID96526 and ID96527 came very close again at t = 9.5 Gyr and have remained closer to each other than the other pairs.
2.3. Mass evolution
The evolution of the total mass of the three galaxies in time is shown in panels e–g of Fig. 2 for the dark matter, gas, and stars, respectively. This mass is defined as belonging to the self-bound subhalo and assigned by the SUBFIND algorithm (Springel et al. 2001). The galaxies ID96526 and ID96527 reached their maximum dark matter mass on the order of 1012 M⊙ a little before t = 4 Gyr, while this mass for ID96543 is about a factor of two smaller. The maximum gas mass is on the order of 1011 M⊙ in all three galaxies. The maximum stellar mass was reached about a gigayear later and is on the order of 5 × 10¹⁰ M⊙ for ID96526 and ID96527 and twice as low for ID96543. The maximum total masses of galaxies ID96526, ID96527, and ID96543 were (1.12, 0.96, 0.49)×1012 M⊙ at t = (3.74, 3.59, 2.84) Gyr, respectively. The values correspond to what one would consider to be a normal-sized galaxy at these times.
During the interaction in the group, the galaxies exchanged mass, in particular ID96527 took over some of dark matter and gas previously bound to ID96543, while ID96526 borrowed some material that previously belonged to ID96527. After t = 4.5 Gyr, dark matter and gas were tidally and ram-pressure stripped in all galaxies due to the interaction with the forming cluster. By the end of the evolution, the galaxies retained only a small fraction of their original dark matter content and no gas. In particular, the gas was completely lost at the second pericenter around the cluster for all three galaxies. The stars were less affected, because of their concentration in the galaxy center, but their mass was also gradually depleted, with stronger dips at pericenters, where the SUBFIND algorithm tends to underestimate the mass content (Muldrew et al. 2011). The total masses of galaxies ID96526, ID96527, and ID96543 at the end of the evolution (z = 0) were (6.85, 5.88, 3.68)×1010 M⊙, respectively.
2.4. Evolution of stellar populations
The interactions of the galaxies in the group, prior to cluster infall, had some bearing on their stellar populations. The two close encounters between different pairs, at 4 and 5 Gyr, led to the enhancement in their SFR (measured within two stellar half-mass radii, 2r1/2) and the rejuvenation of their stellar populations. As shown in Fig. 2h, galaxies ID96526 and ID96543 interacting at 4 Gyr both display a peak in their SFR at the level of 10 and 30 M⊙ yr−1, respectively, around that time, while galaxy ID96527 has an even higher peak at 5 Gyr as a result of its interaction with ID96526. ID96527 is the only galaxy that still retains a significant amount of gas around that time. Some of this gas was recently accreted and is rather concentrated, so it is more difficult to strip.
Figure 2d shows the evolution of the g − r color of the galaxies calculated from all stars. Its behavior reflects what could be inferred from the evolution of the SFR: all galaxies show a drop in color at the time of their strongest interaction in the group, that is, their stellar population becomes temporarily bluer. However, as the gas is stripped soon after the cluster infall, the star formation stops and the color increases toward the redder values. All three galaxies become red with g − r > 0.6 mag around t = 6 Gyr and reach g − r > 0.8 mag at the end of the evolution.
2.5. Morphological evolution
The most interesting aspect of the interactions of the galaxies in the group and in the cluster is related to their morphological evolution. It turns out that all the major galaxies of the group formed bars at some stage of their history. I measured the strength of the bar in terms of the m = 2 mode of the Fourier decomposition of the surface density distribution of stellar particles projected along the short axis. It is given by A2(R) = |Σjmjexp(2iθj)|/Σjmj, where θj is the azimuthal angle of the jth star, mj is its mass, and the sum goes up to the number of particles in a given radial bin. Figure 2c shows the evolution of A2 measured in a single radial bin of radius R < 2r1/2. Assuming the threshold of A2 > 0.2 as corresponding to the bar formation, it turns out that ID96526 and ID96527 form their bars at 4 and 5 Gyr, respectively. These times coincide with their strong interactions with other galaxies in the group, which suggests that the formation of the bars was tidally induced.
At 4 Gyr, ID96526 interacted strongly with ID96543, which induced the bar in ID96526, but left ID96543 rather unaffected. At 5 Gyr, ID96526 interacted strongly with ID96527, which induced the bar in ID96527, but also enhanced the bar in ID96526. It is worth noting that ID96527 was already temporarily distorted during its first pericenter passage around the cluster at t = 4.8 Gyr, but this interaction did not result in the formation of a stable bar. The bars then grew steadily, aided probably by the loss of gas due to ram-pressure stripping in the cluster environment. On the other hand, the bar in ID96543, although seeded by the interactions with the biggest galaxy of the group (ID96526) and the cluster, grew slowly until 9 Gyr when it crossed A2 > 0.2 probably as a result of the tidal interaction with the cluster BCG at the fourth pericenter. However, the bar in ID96543 remained much weaker than in the two other galaxies until the end of the evolution.
A similar enhancement in the bar strength is seen for ID96527 at t = 12 Gyr, while the bar in ID96543 was weakened around this time. Both events took place at their respective pericenters on orbits around the cluster. These are examples of the changes of the bar strength resulting from different orientations of the bar with respect to the tidal force at the pericenter, an effect described by Łokas et al. (2014). As demonstrated by their Fig. 11, when the tidal torque is oriented so as to speed up the bar, the bar is weakened, while if the torque slows down the bar, it becomes stronger.
The behavior of the bars in the three galaxies is illustrated in a more complete way in Fig. 3, which shows the evolution of the full bar mode profile, A2(R, t), thus preserving the dependence on the radius. In addition to the regular enhancement of A2 related to the bar (R < 6 kpc), there are a number of other features visible in these plots. In particular, the short-term enhancement of A2 in the first panel (ID96526) at t = 2.4 Gyr, also visible as a strong peak of A2 in Fig. 2c around this time (blue line), is due to the temporary distortion of this galaxy resulting from a merger. Later on, all galaxies show similar features at larger radii (R > 6 kpc), resulting from temporary distortions by tidal forces from another galaxy or the cluster. All of these features occur at times corresponding to the pericenter passages shown in Figs. 2a,b.
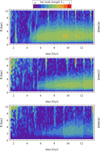 |
Fig. 3. Evolution of the profiles of the bar mode, A2(R), in the three galaxies over time. |
3. Discussion
I presented an analysis of the evolution of three galaxies accreted by a cluster in a small group selected from the IllustrisTNG100 simulation. Prior to cluster infall, the galaxies interacted strongly, which led to their morphological transformation. In the two bigger galaxies, the interactions led to the fast formation of strong, tidally induced bars, while the third, smaller galaxy formed its bar more slowly and the bar was significantly weaker. The bars grew after the cluster infall of the group, probably aided by the stripping of the gas by the ram pressure in the intracluster medium. Contrary to what is observed in nearby clusters, the group accretion took place very early in the evolution of the cluster, with the first pericenter passage around z = 1.3 (t = 4.8 Gyr). Interestingly, the imprint of the interactions in the group, in terms of the tidally induced bars, was preserved until the end of the simulation corresponding to the present time, in spite of the strong evolution in the cluster, including seven pericenter passages.
The process of the creation of tidally induced bars during the flybys in the group and their subsequent evolution in the cluster can be viewed as another scenario for their formation, combining idealized two-body flybys (Łokas 2018) and interactions of a single galaxy with a cluster (Łokas et al. 2016). Otherwise, it closely resembles such events described in previous studies performed using controlled or cosmological simulations (Łokas et al. 2014; Łokas 2020b, 2021). Although cosmological simulations provide a more realistic environment to study the evolution, their disadvantage is that one cannot claim unequivocally that the bars did indeed result from tidal interactions, because of the lack of a control experiment where the same galaxy would evolve without taking part in the encounter.
Another source of uncertainty is related to the possible effects of other processes occurring simultaneously with the bar formation. For example, in the case of galaxy ID96526 studied here, the formation of the bar coincides with an event of strong kinetic feedback from its AGN. A significant energy released at this time led to the heating of the inner gas and its removal from the central few kiloparsecs of the galaxy. The resulting lower gas content may have facilitated the formation of the bar, as described by Athanassoula et al. (2013) and Łokas (2020a, 2022).
The presented scenario of the evolution of galaxies in a small group quite early in the cosmological timescale offers an interesting possibility located in between the secular evolution in isolation and the strong evolution in clusters. The specific environment of the group is where the galaxies come together close enough to interact but at the same time their relative velocities are not yet as high as in clusters, making the interactions very effective in terms of the strength of morphological transformation. The time of the interaction is also quite special, because it happened when the galaxies were already fully formed, having reached the dark and stellar masses typical of normal-sized present-day galaxies. Additional analyses of cosmological simulations and observations are needed to determine if this scenario is an exception or a common occurrence at intermediate redshifts.
Acknowledgments
I am grateful to the IllustrisTNG team for making their simulations publicly available and to the anonymous referee for useful comments. Computations for this article have been performed in part using the computer cluster at CAMK PAN.
References
- Athanassoula, E., Machado, R. E. G., & Rodionov, S. A. 2013, MNRAS, 429, 1949 [Google Scholar]
- Barnes, D. J., Vogelsberger, M., Kannan, R., et al. 2018, MNRAS, 481, 1809 [Google Scholar]
- Benavides, J. A., Sales, L. V., & Abadi, M. G. 2020, MNRAS, 498, 3852 [Google Scholar]
- Berrier, J. C., Stewart, K. R., Bullock, J. S., et al. 2009, ApJ, 690, 1292 [NASA ADS] [CrossRef] [Google Scholar]
- Bidaran, B., La Barbera, F., Pasquali, A., et al. 2022, MNRAS, 515, 4622 [NASA ADS] [CrossRef] [Google Scholar]
- Chung, J., Kim, S., Rey, S.-C., & Lee, Y. 2021, ApJ, 923, 235 [NASA ADS] [CrossRef] [Google Scholar]
- Cortese, L., Gavazzi, G., Boselli, A., et al. 2006, A&A, 453, 847 [NASA ADS] [CrossRef] [EDP Sciences] [Google Scholar]
- Dacunha, T., Belyakov, M., Adhikari, S., et al. 2022, MNRAS, 512, 4378 [NASA ADS] [CrossRef] [Google Scholar]
- De Lucia, G., Weinmann, S., Poggianti, B. M., Aragón-Salamanca, A., & Zaritsky, D. 2012, MNRAS, 423, 1277 [NASA ADS] [CrossRef] [Google Scholar]
- Fujita, Y. 2004, PASJ, 56, 29 [NASA ADS] [Google Scholar]
- Gerin, M., Combes, F., & Athanassoula, E. 1990, A&A, 230, 37 [NASA ADS] [Google Scholar]
- Gupta, A., Yuan, T., Torrey, P., et al. 2018, MNRAS, 477, L35 [NASA ADS] [CrossRef] [Google Scholar]
- Haggar, R., Kuchner, U., Gray, M. E., et al. 2023, MNRAS, 518, 1316 [Google Scholar]
- Haines, C. P., Pereira, M. J., Smith, G. P., et al. 2015, ApJ, 806, 101 [NASA ADS] [CrossRef] [Google Scholar]
- Joshi, G. D., Pillepich, A., Nelson, D., et al. 2020, MNRAS, 496, 2673 [Google Scholar]
- Łokas, E. L. 2018, ApJ, 857, 6 [Google Scholar]
- Łokas, E. L. 2020a, A&A, 634, A122 [NASA ADS] [CrossRef] [EDP Sciences] [Google Scholar]
- Łokas, E. L. 2020b, A&A, 638, A133 [NASA ADS] [CrossRef] [EDP Sciences] [Google Scholar]
- Łokas, E. L. 2021, A&A, 647, A143 [NASA ADS] [CrossRef] [EDP Sciences] [Google Scholar]
- Łokas, E. L. 2022, A&A, 668, L3 [NASA ADS] [CrossRef] [EDP Sciences] [Google Scholar]
- Łokas, E. L. 2023, A&A, 673, A131 [NASA ADS] [CrossRef] [EDP Sciences] [Google Scholar]
- Łokas, E. L., Athanassoula, E., Debattista, V. P., et al. 2014, MNRAS, 445, 1339 [Google Scholar]
- Łokas, E. L., Ebrová, I., del Pino, A., et al. 2016, ApJ, 826, 227 [Google Scholar]
- Marinacci, F., Vogelsberger, M., Pakmor, R., et al. 2018, MNRAS, 480, 5113 [NASA ADS] [Google Scholar]
- McGee, S. L., Balogh, M. L., Bower, R. G., Font, A. S., & McCarthy, I. G. 2009, MNRAS, 400, 937 [Google Scholar]
- Muldrew, S. I., Pearce, F. R., & Power, C. 2011, MNRAS, 410, 2617 [Google Scholar]
- Naiman, J. P., Pillepich, A., Springel, V., et al. 2018, MNRAS, 477, 1206 [Google Scholar]
- Nelson, D., Pillepich, A., Springel, V., et al. 2018, MNRAS, 475, 624 [Google Scholar]
- Nelson, D., Springel, V., Pillepich, A., et al. 2019, Computat. Astrophys. Cosmol., 6, 2 [NASA ADS] [CrossRef] [Google Scholar]
- Noguchi, M. 1987, MNRAS, 228, 635 [NASA ADS] [Google Scholar]
- Peschken, N., & Łokas, E. L. 2019, MNRAS, 483, 2721 [Google Scholar]
- Pillepich, A., Nelson, D., Hernquist, L., et al. 2018, MNRAS, 475, 648 [Google Scholar]
- Sales, L. V., Navarro, J. F., Penafiel, L., et al. 2020, MNRAS, 494, 1848 [CrossRef] [Google Scholar]
- Sarron, F., Adami, C., Durret, F., & Laigle, C. 2019, A&A, 632, A49 [NASA ADS] [CrossRef] [EDP Sciences] [Google Scholar]
- Sengupta, A., Keel, W. C., Morrison, G., et al. 2022, ApJS, 258, 32 [NASA ADS] [CrossRef] [Google Scholar]
- Springel, V., White, S. D. M., Tormen, G., & Kauffmann, G. 2001, MNRAS, 328, 726 [Google Scholar]
- Springel, V., White, S. D. M., Jenkins, A., et al. 2005, Nature, 435, 629 [Google Scholar]
- Springel, V., Pakmor, R., Pillepich, A., et al. 2018, MNRAS, 475, 676 [Google Scholar]
- Su, A. H., Salo, H., Janz, J., et al. 2021, A&A, 647, A100 [EDP Sciences] [Google Scholar]
- Yun, K., Pillepich, A., Zinger, E., et al. 2019, MNRAS, 483, 1042 [Google Scholar]
All Figures
|
Fig. 1. Column densities of dark matter, stars, and gas (from top to bottom) in a cutout from the IllustrisTNG100 simulation containing the infalling group of galaxies at t = 4 Gyr (z = 1.6). The images are centered on galaxy ID96543, the galaxy ID96527 is visible to the left of it, and ID96526 is beneath it. The BCG of the forming cluster, into which the group is infalling, is visible in the upper left part of each panel. |
| In the text | |
|
Fig. 2. Evolution of different properties of the three galaxies over time. Panels a and b illustrate the orbital history of the galaxies, with panel a showing the distance of each galaxy from the center of the forming cluster and panel b the distance between each pair of galaxies. Panels e–g show the evolution of the total mass of each galaxy in different components, dark matter, gas, and stars, respectively. Panel c presents the evolution of the bar mode A2 in each galaxy, measured within 2r1/2. Panels d and h show the evolution of the color and SFR in the galaxies. The color coding of the lines in panels c, d and f–h is the same as in panel e. The vertical dashed gray line in all panels indicates the time (t = 4 Gyr, z = 1.6) for which the images of the group are shown in Fig. 1. |
| In the text | |
|
Fig. 3. Evolution of the profiles of the bar mode, A2(R), in the three galaxies over time. |
| In the text | |
Current usage metrics show cumulative count of Article Views (full-text article views including HTML views, PDF and ePub downloads, according to the available data) and Abstracts Views on Vision4Press platform.
Data correspond to usage on the plateform after 2015. The current usage metrics is available 48-96 hours after online publication and is updated daily on week days.
Initial download of the metrics may take a while.