| Issue |
A&A
Volume 677, September 2023
|
|
|---|---|---|
| Article Number | L1 | |
| Number of page(s) | 6 | |
| Section | Letters to the Editor | |
| DOI | https://doi.org/10.1051/0004-6361/202347319 | |
| Published online | 28 August 2023 | |
Letter to the Editor
Very late-time spectroscopy of SN 2009ip: Constraints on the ongoing Hα emission
1
Instituto de Estudios Astrofísicos, Facultad de Ingeniería y Ciencias, Universidad Diego Portales, Av. Ejército Libertador 441, Santiago, Chile
e-mail: thallis.pessi@mail.udp.cl
2
Millennium Institute of Astrophysics MAS, Nuncio Monsenor Sotero Sanz 100, Off. 104, Providencia, Santiago, Chile
3
Institut d’Astrophysique de Paris, CNRS-Sorbonne Université, 98 bis boulevard Arago, 75014 Paris, France
Received:
29
June
2023
Accepted:
7
August
2023
Context. The peculiar supernova (SN) 2009ip was an ambiguous event that placed many questions on its true origin. Here, we present very late-time spectroscopic and photometric observations of SN 2009ip, obtained 9 years (3274 days) after the 2012B outburst.
Aims. We analyze the Hα emission still present in the very late-time spectrum of SN 2009ip. We also obtain photometric measurements in r, g and i bands.
Methods. We obtain observations of SN 2009ip on 2021 September 10 with the IMACS instrument at the 6.5 m Magellan Baade Telescope, located at the Las Campanas Observatory.
Results. SN 2009ip was detected in r, g and i bands, with an absolute magnitude in r band of ∼ − 8.66 mag. We show that the source faded significantly since the last observations in these bands. We further show that the very late-time spectrum contains a persistent Hα emission, although no other emission lines were detected. We measure a full width at half maximum of 930 ± 40 km s−1 and luminosity of ∼ 8.0 × 1037 erg s−1 for the Hα emission. The luminosity decreased relatively slowly in comparison to the last observations and its fading rate is very similar to other long-living interacting transients, such as SN 2005ip. Finally, we conclude that although these properties could be consistent with a non-regular core-collapse SN, they could also be explained by non-terminal explosion scenarios.
Key words: stars: mass-loss / supernovae: general / supernovae: individual: SN 2009ip / stars: massive
© The Authors 2023
 Open Access article, published by EDP Sciences, under the terms of the Creative Commons Attribution License (https://creativecommons.org/licenses/by/4.0), which permits unrestricted use, distribution, and reproduction in any medium, provided the original work is properly cited.
This article is published in open access under the Subscribe to Open model. Subscribe to A&A to support open access publication.
1. Introduction
Massive stars are known for producing very intense mass loss due to instabilities and energetic outbursts. If accumulated material around the star is dense enough, the stellar activity might generate observed events known as interacting transients, characterized by emission lines due to the interaction of the ejecta with the circumstellar material (CSM). If the transient is a terminal event (i.e., a true core-collapse), it can be classified as a Type IIn (H-rich CSM), Ibn (He-rich CSM), or Icn (C- and O-rich) supernova (SN). For some of these events, the dense CSM hides the underlying mechanism, making it difficult to decipher their true nature, whether it was a SN or a violent eruption in a massive star. The interacting transient known as SN 2009ip is a famous example of this kind. Discovered in 2009, the event was classified as a Type IIn SN when it reached a magnitude of MR ∼ −14.5 mag (Maza et al. 2009). Subsequent eruptions observed in the next couple of years proved that the source was still active, and had a behavior similar to erupting luminous blue variables (LBVs, Smith et al. 2010; Foley et al. 2011; Pastorello et al. 2013). Very early images obtained by the Hubble Space Telescope (HST) in 1999 showed a very luminous progenitor at the position of SN 2009ip, with an initial mass of 50 − 80 M⊙, consistent with a LBV star (Smith et al. 2010).
In 2012, two extreme events were observed in SN 2009ip: the first, named 2012A, reached a magnitude of MV ∼ −14.5 mag, and the second, 2012B, reached MR ∼ −18 mag (Mauerhan et al. 2013; Pastorello et al. 2013; Fraser et al. 2013). During the 2012B event, the Hα profile equivalent width (EW) varied between 100 Å, at the beginning, to 1000 Å, ∼260 days later, and presented a variety of velocity components (Mauerhan et al. 2014). The full width at half maximum (FWHM) of the Hα narrow component went from ∼ 700 − 1000 km s−1 over this period, while the broad component showed a range of ∼ 10 600 − 15 000 km s−1. The blue absorption component of the Hα P-Cygni profile also showed high velocities, extending up to ∼ 15 000 km s−1 (Mauerhan et al. 2014).
These eruptions were followed by extensive discussion, and their true nature is still under debate (Prieto et al. 2013; Levesque et al. 2014; Margutti et al. 2014; Smith et al. 2014, 2016; Graham et al. 2014; Mauerhan et al. 2014; Moriya 2015; Fraser et al. 2013, 2015; Thoene et al. 2015; Graham et al. 2017). Some authors claimed that the observed high velocities during 2012B were only possible if SN 2009ip was in fact a true SN (e.g., Mauerhan et al. 2013; Smith et al. 2014). On the other hand, Pastorello et al. (2013) proposed that such high velocities were also detected during the LBV-like variability observed in the years before, and Fraser et al. (2013) argued that the lack of nebular emission from nucleosynthesis material after the 2012B eruption could support the non-terminal scenario. Moriya (2015) demonstrated that the light curve of SN 2009ip after 2012B could be fitted by a CSM interaction model with ∼2 × 1049 erg, thus being not a regular SN explosion (see also Dessart et al. 2016, for a discussion on spectroscopic modeling of Type IIn SNe). Furthermore, the case for LBVs being the progenitors of SNe is still contested (e.g., the case for SN 2020tlf and its pre-SN activity with a luminosity of 106 L⊙ and consistent with a 60 M⊙ progenitor; however, based on the light curve and spectra, the progenitor is consistent with a 12 M⊙ star, Jacobson-Galán et al. 2022).
Late-time observations of SN 2009ip showed that the source had dimmed significantly after two years, reaching g ∼ 21.3 on 2014 July 28 and r ∼ 19.7 on 2014 December 16 (Graham et al. 2017). Spectroscopy obtained by Graham et al. (2017) on 2015 July 16 shows that SN 2009ip was still dominated by hydrogen in emission 1026 days after Event B, with the presence of He I, Fe I and the emission forest of Fe II. More recently, Smith et al. (2022) presented new photometry of SN 2009ip, obtained with the HST in December of 2021. They show that the source faded significantly but steadily since 2013 and that now it is below the 1999 progenitor magnitude in the F606W band. Here we present late-time spectroscopic and photometric observations of SN 2009ip obtained on September of 2021, 3274 days after the beginning of Event B.
2. Observations
We obtained optical spectroscopy and photometry of SN 2009ip on 2021 September 10 UT1, using the IMACS instrument (+ f/2 camera) at the 6.5 m Magellan Baade Telescope. The spectra were obtained using long-slit observations with a 300 l mm−1 grism, the FourS_2471 slit mask, and a wavelength coverage of 4200 − 9400 Å. The final spectrum was the result of the median combining of three exposures, with a time of integration of 1800 s each.
The combined spectrum was reduced using the kosmos2 pipeline, following standard procedures of long-slit spectroscopic reduction, including bias and flat-field correction, wavelength and flux calibration. We did an absolute flux calibration on the 1D spectrum using the r-band photometry and synthetic photometry obtained with the pyphot3 package.
Imaging in the SDSS gri filters was also obtained with IMACS f/2 camera. A total exposure time of 3 × 90 s was used in r-band, 1 × 300 s in g-band, and 2 × 200 s in i-band. The individual exposures in each band were reduced using standard procedures of bias subtraction and flat-field correction in the kosmos pipeline. Astrometry correction was performed through Astrometry.net (Lang et al. 2010) and the images were combined using SWarp (Bertin 2010). The photometry of SN2009ip was extracted using the point spread function fitting (PSF) package DAOPHOT (Stetson 1987, 2011). The photometric calibration was obtained using stars in the field with Pan-STARRS1 (Kaiser et al. 2002; Chambers et al. 2016; Flewelling et al. 2020) photometry. The result of our photometry in the gri-bands is reported in Appendix A.
SN 2009ip is located in the outskirts of the spiral galaxy NGC 7259, at α = 22h23m08.261s and δ = −28° 56′52.40″ (J2000.0). In this work, we use a distance modulus of μ ≈ 32.0, a redshift of z = 0.00594 (Graham et al. 2014, 2017) and a Galactic extinction of AV ≈ 0.054 (Schlafly & Finkbeiner 2011).
3. Results and discussion
3.1. Photometry
In Appendix B, we show the observed field of view in r-band, obtained on 2021 September 10, with an inset in a region close to the galaxy NGC 7259 showing a bright source at the position of SN 2009ip. We measured a magnitude of r = 22.93 ± 0.08 mag, or a Galactic extinction corrected absolute magnitude of Mr = −8.66 ± 0.08 mag. The source was also detected in g and i bands, with g = 23.46 ± 0.07 mag (Mg = −8.15 ± 0.07 mag) and i = 23.59 ± 0.08 mag (Mi = −8.12 ± 0.08 mag).
SN 2009ip faded significantly since the last reported detection of the source in these bands by Graham et al. (2017), obtained on 2014 December 16, as it is shown in Fig. 1. Our photometric measurements show a fading of ≈3.19 mag in r-band and of ≈2.07 mag in g-band, in relation to the last observations. The fading rate of ∼ 0.0011 mag day−1 in r band and ∼ 0.0007 mag day−1 in g band implies a slowing in comparison to the rate estimated by Graham et al. (2017) at the time (∼ 0.0030 mag day−1 and ∼ 0.0033 mag day−1, respectively). The change in the slope can be clearly seen in Fig. 1. Recently, Smith et al. (2022) reported the photometry of SN 2009ip obtained with the HST, and showed that all bands have a slow decline rate at very late times, in agreement with our work. Such decline rate is much slower than expected for radioactively powered emission and for normal Type II SNe (although 56Co decay might not be the main powering mechanism for Type II SNe at late times, Dessart et al. 2023). However, this is commonly observed for other interacting transients that presented late-time emission generated by ejecta-CSM interaction (e.g., 2005ip, Smith et al. 2009, 2017; Fox et al. 2020).
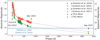 |
Fig. 1. Late-time photometric evolution of SN 2009ip, with the photometry presented in this work in r (red triangle) and g (green triangle) bands, obtained on 2021 August 10. The figure also shows the photometry in r and g bands around the event 2012B, presented in Graham et al. (2014), and the late-time photometric evolution in these bands, between 251 and 813 days after Event B, presented in Graham et al. (2017). the dashed lines show the inferred slope of the source between the last reported observation and our photometry. Phase is given in relation to the begging of Event B. |
One important point of comparison for the photometry is the pre-explosion detections of the progenitor of SN 2009ip. In Fig. 1 we show the magnitude of ∼21.8 mag measured by Smith et al. (2010) using the HST F606W filter on 1999 June 29. The source is below this point in both g and r bands, which indicates that the source faded below its progenitor luminosity. This is in agreement with the results presented in Smith et al. (2022), who showed that SN 2009ip had faded considerably below its progenitor luminosity of 1999. The low luminosity in gri bands does not necessarily imply a dead progenitor, as the surviving star could be emitting most of its flux in the bluer bands. A high UV flux was detected by the observations made by Smith et al. (2022), which also points to a strong possibility of contamination from an underlying stellar cluster in that band.
Smith et al. (2010) also reported the source varying between R ∼ 20.37, on 2005 July 03, and R > 21.51 on 2008 August 23. The reason for such variability before a giant eruption is still not known, but such behavior is common in LBV stars (Smith et al. 2010), and is constantly observed for other 2009ip-like events. We note that the source does not appear to have produced any similar variability for the last 10 years, which is also supported by the photometry from Smith et al. (2022). This could favor the scenario of the Event B of SN 2009ip being a true core-collapse event since the source has significantly dimmed its activity after a long period of large variability. However, this behavior would also be consistent in the scenario of pulsational pair-instability (PPI, Woosley 2017) or Roche lobe overflow (RLOF) if a bare core was left after all the H-rich envelope being expelled during Event 2012A. The mas-loss could have moved the progenitor away from the PPI or RLOF regime, ceasing the violent bursts and variability previously observed.
3.2. Spectroscopy
The spectrum of SN 2009ip obtained on 2021 September 10 (at phase +3274 relative to the beginning of event 2012B) is shown in Fig. 2, where we also show the last published spectrum from Graham et al. (2017), obtained in 2015 December 11 (at phase +1164 relative to the event 2012B), and an earlier spectrum, obtained in 2013 June 10 (at phase +260). Although many different spectral features are still identified in the previous late-time spectrum of SN 2009ip, especially lines of He I, Ca II, and Fe II, the spectrum presented here only shows one distinguishable emission feature of Hα. The detection of SN 2009ip in g and i bands, however, could be caused by the presence of a faint continuum or by the presence of emission lines that are undetected in our spectrum.
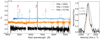 |
Fig. 2. Very late-time spectrum of SN 2009ip obtained on 2021 September 10, or at phase +3274 relative to the event 2012B, obtained with the IMACS instrument at the 6.5 m Magellan Baade Telescope (in black). The spectrum is available on WISeREP (https://www.wiserep.org/, Yaron & Gal-Yam 2012). We also show the last published spectrum of SN 2009ip from Graham et al. (2017), obtained in 2015 December 11 (at phase +1164 days) and a spectrum from 2013 June 10 (at phase +260). |
In the right panel of Fig. 2, we show a comparison of the Hα emission of the spectrum obtained 3274 days after Event B, to the line present in the spectra observed at phases +1164 days and +260 days. SN 2009ip presented an increase of the Hα equivalent width (EW) during the first year after the beginning of Event B, going from ∼100 Å at the peak of that event to ∼1000 Å in 2013. In 2015, the Hα EW had increased to about ∼2400 Å. Although we cannot estimate the Hα EW in our spectrum, due to the continuum flux being close to zero, we note that the line width did not present a strong change from 2015. This EW is considerably larger than the observed for Eta Car (∼400 − 600 Å, Smith et al. 2003; Stahl et al. 2005), and quiescent LBV stars, but commonly observed for Type IIn SNe and other interacting events (Smith et al. 2014). This suggests a scenario of the Hα emission being generated from the interaction of the remaining ejecta of Event B with the CSM, and not from the LBV-like ionizing mechanism of a survivor star.
By using a Gaussian model, we fit the Hα emission line and obtain a FWHM of 930 ± 40 km s−1 and a luminosity of 8.0 ± 0.7 × 1037 erg s−1. The FWHM is similar to the velocity measured in the spectrum obtained at phase +1164 d (∼950 km s−1), showing no evolution with time. Figure 3 shows the evolution of the Hα emission profile in SN 2009ip, with measurements presented by Graham et al. (2017) between phases +251 days and +1027 days. The luminosity of the line decreased steadily over the years and dimmed significantly in comparison to the luminosity presented in Graham et al. (2017): the luminosity decreased by about two orders of magnitude between phases +1027 days and +3274 days, going from log (LHα) ∼ 40 erg s−1 to log (LHα) ∼ 38 erg s−1.
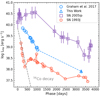 |
Fig. 3. Luminosity evolution of the Hα line in SN 2009ip between 251 and 3274 days after the peak of Event B (in blue). The triangle shows the value presented in this work, while the circles represent the values from Graham et al. (2017). We also show the evolution of the Hα luminosity for the long-lived SN 2005ip (purple squares, Smith et al. 2009, 2017), between 1893 and 3768 days after peak brightness, and SN 1993J (orange pentagons, Chandra et al. 2009), between 170 and 3608 days after peak. The gray dashed line highlights the expected decline rate of the luminosity if the Hα emission was driven by 56Co decay, following L ∝ 2−t/77.3. |
In Fig. 3, we also show the evolution of the Hα luminosity for two long-lived interacting transients, SN IIn 2005ip (Smith et al. 2009, 2017; Fox et al. 2020) and the SN IIb 1993J (Chandra et al. 2009), and a comparison with the expected decline rate of luminosity if the line was powered by 56Co decay, following a L ∝ 2−t/77.3 behavior (although we note that 56Co decay might not be the main powering source of normal Type II SNe at very late times, Dessart et al. 2023). These two SNe have been followed up for a very long period after peak, with their Hα flux evolution being detected up to 3768 days and 3608 days after peak, respectively. Often the scenario of an extended mass loss in a red supergiant (RSG) is used to explain the long-lived emission of SN 1993J and other similar events (see, e.g., Mauerhan & Smith 2012; Milisavljevic et al. 2012; Smith et al. 2015), with an estimate of strong wind with 10−4 M⊙ yr−1 (Mauerhan & Smith 2012). SN 2005ip, however, remained at a much larger luminosity, requiring a more extreme progenitor mass loss rate to explain its increased late-time luminosity. Smith et al. (2017) shows that such luminosities are consistent with a progenitor mass loss rate of 10−3 M⊙ yr−1, which agrees well with the detected emission in radio and X-rays, and requires a long-lived pre-explosion mass loss. Recent analyses estimated the pre-explosion mass loss rate of SN 2005ip to be of 10−2 M⊙ yr−1 and to have produced a total mass loss of ≥1 M⊙ right before explosion (Fox et al. 2020). We note that SN 2009ip shows a very similar fading behavior of the Hα luminosity to these two SNe, therefore it is consistent with a late-time interaction between the ejecta and an extended CSM (although we note that the mechanism behind SN 1993J is different than SN 2005ip and SN 2009ip, and that it presents a very distinct velocity evolution, with a very broad Hα profile and velocities up to ∼5000 − 10 000 km s−1).
The overall luminosity in SN 2009ip is about 1.5 orders of magnitude lower than SN 2005ip, suggesting that the amount of mass lost during the Event B of SN 2009ip should be around 10 times less than for SN 2005ip. Such a smaller luminosity, however, could also be caused by the geometry of the event, as a disk-like geometry would require more energy to emit the same amount of luminosity as observed in a spherical CSM. As can be seen in Fig. 2, the Hα emission has the peak of the line shifted to v ∼ − 100 km s−1. Asymmetries in the Hα emission were noticed at early-times (Margutti et al. 2014; Graham et al. 2017), which suggested a non-spherical CSM around the explosion. However, the shift in the spectrum presented here might not be significant. This and the fact that the previous late-time spectra show a symmetric profile of Hα make the scenario of a non-spherical CSM less likely.
Finally, given the low velocities, it is also possible that the very-late spectrum reported here originated from the inner ejecta of SN 2009ip. If that is the case, this suggests that there are no metals in the emitting region, making the case for a core-collapse event harder to explain and more consistent with a low-metallicity non-terminal explosion. However, more detailed observations of the inner regions are needed to confirm this scenario.
4. Summary and conclusions
In this work, we presented very late-time photometry and spectroscopy of SN 2009ip, obtained on 2021 September 10, 3274 days after the event 2012B. We show that the source faded significantly since the last observations obtained in g and r bands in 2014. The slow fading rate is comparable to long-lived SNe and other interacting events. The source appears to have been fading steadily since 2014, with no strong variability or explosive outbursts like the ones observed in the years before the main events of 2012. However, this could also be consistent with a scenario of a PPI or RLOF event.
We show that the very late-time spectrum of SN 2009ip shows a persistent narrow Hα emission feature, with a luminosity of ∼ 8 × 1037 erg s−1 and an FWHM of ∼ 900 km s−1. The Hα luminosity evolution is very similar to other transients with late-time CSM interaction. The Hα luminosity of SN 2009ip falls between the luminosities for SN 2005ip and SN 1993J, although it has a different velocity evolution than these two SNe. The similarity of the Hα EW to the value observed at the end of Event B might indicate that the line is being produced by the still interaction of the ejecta with the CSM, being the result of the deceleration of the explosion ejecta or the ionization of the shocked CSM. Another possibility is that the spectrum is generated by the inner ejecta of SN 2009ip, a case that is supported by the low velocities reported here. If that is the case, the fact that no metals are detected makes the scenario of a core-collapse of SN 2009ip less likely.
After 9 years of Event B, SN 2009ip is still a dubious and hard-to-explain event. We showed that it is still hard to confirm if it was a true core-collapse supernova event, as other possibilities might explain the 2012 explosions. The only certainty is that the mechanisms behind SN 2009ip are not the same as a regular Type IIn SN. Future late-time observations and modeling of SN 2009ip and similar events might help in understanding the mechanism behind this ambiguous event.
Acknowledgments
T.P. acknowledges the support by ANID through the Beca Doctorado Nacional 202221222222. J.L.P. acknowledges support by ANID through the Fondecyt regular grant 1191038 and through the Millennium Science Initiative grant ICN12_009, awarded to The Millennium Institute of Astrophysics, MAS. This work makes use of the following softwares: kosmos (https://github.com/jradavenport/kosmos), Astropy (Astropy Collaboration 2013); astropy:2018, SWarp (Bertin 2010), Astrometry.net (Lang et al. 2010), DAOPHOT (Stetson 1987, 2011), SUPERBOL (Version 1.7; Nicholl 2018) and Pyphot (https://mfouesneau.github.io/pyphot/).
References
- Astropy Collaboration (Robitaille, T. P., et al.) 2013, A&A, 558, A33 [NASA ADS] [CrossRef] [EDP Sciences] [Google Scholar]
- Astropy Collaboration (Price-Whelan, A. M., et al.) 2018, AJ, 156, 123 [Google Scholar]
- Bertin, E. 2010, Astrophysics Source Code Library [record ascl:1010.068] [Google Scholar]
- Chambers, K. C., Magnier, E. A., Metcalfe, N., et al. 2016, ArXiv e-prints [arXiv:1612.05560] [Google Scholar]
- Chandra, P., Dwarkadas, V. V., Ray, A., Immler, S., & Pooley, D. 2009, ApJ, 699, 388 [CrossRef] [Google Scholar]
- Dessart, L., Hillier, D. J., Audit, E., Livne, E., & Waldman, R. 2016, MNRAS, 458, 2094 [Google Scholar]
- Dessart, L., Gutierrez, C. P., Kuncarayakti, H., Fox, O. D., & Filippenko, A. V. 2023, A&A, 675, A33 [NASA ADS] [CrossRef] [EDP Sciences] [Google Scholar]
- Flewelling, H. A., Magnier, E. A., Chambers, K. C., et al. 2020, ApJS, 251, 7 [NASA ADS] [CrossRef] [Google Scholar]
- Foley, R. J., Berger, E., Fox, O., et al. 2011, ApJ, 732, 32 [NASA ADS] [CrossRef] [Google Scholar]
- Fox, O. D., Fransson, C., Smith, N., et al. 2020, MNRAS, 498, 517 [NASA ADS] [CrossRef] [Google Scholar]
- Fraser, M., Inserra, C., Jerkstrand, A., et al. 2013, MNRAS, 433, 1312 [NASA ADS] [CrossRef] [Google Scholar]
- Fraser, M., Kotak, R., Pastorello, A., et al. 2015, MNRAS, 453, 3886 [Google Scholar]
- Graham, M. L., Sand, D. J., Valenti, S., et al. 2014, ApJ, 787, 163 [NASA ADS] [CrossRef] [Google Scholar]
- Graham, M. L., Bigley, A., Mauerhan, J. C., et al. 2017, MNRAS, 469, 1559 [NASA ADS] [CrossRef] [Google Scholar]
- Jacobson-Galán, W. V., Dessart, L., Jones, D. O., et al. 2022, ApJ, 924, 15 [CrossRef] [Google Scholar]
- Kaiser, N., Aussel, H., Burke, B. E., et al. 2002, in Survey and Other Telescope Technologies and Discoveries, eds. J. A. Tyson, & S. Wolff, SPIE Conf. Ser., 4836, 154 [Google Scholar]
- Lang, D., Hogg, D. W., Mierle, K., Blanton, M., & Roweis, S. 2010, AJ, 139, 1782 [Google Scholar]
- Levesque, E. M., Stringfellow, G. S., Ginsburg, A. G., Bally, J., & Keeney, B. A. 2014, AJ, 147, 23 [Google Scholar]
- Margutti, R., Milisavljevic, D., Soderberg, A. M., et al. 2014, ApJ, 780, 21 [Google Scholar]
- Mauerhan, J., & Smith, N. 2012, MNRAS, 424, 2659 [NASA ADS] [CrossRef] [Google Scholar]
- Mauerhan, J. C., Smith, N., Filippenko, A. V., et al. 2013, MNRAS, 430, 1801 [NASA ADS] [CrossRef] [Google Scholar]
- Mauerhan, J., Williams, G. G., Smith, N., et al. 2014, MNRAS, 442, 1166 [NASA ADS] [CrossRef] [Google Scholar]
- Maza, J., Hamuy, M., Antezana, R., et al. 2009, Cent. Bureau Electr. Telegrams, 1928, 1 [Google Scholar]
- Milisavljevic, D., Fesen, R. A., Chevalier, R. A., et al. 2012, ApJ, 751, 25 [NASA ADS] [CrossRef] [Google Scholar]
- Moriya, T. J. 2015, ApJ, 803, L26 [NASA ADS] [CrossRef] [Google Scholar]
- Nicholl, M. 2018, RAA, 2, 230 [Google Scholar]
- Pastorello, A., Cappellaro, E., Inserra, C., et al. 2013, ApJ, 767, 1 [NASA ADS] [CrossRef] [Google Scholar]
- Prieto, J. L., Brimacombe, J., Drake, A. J., & Howerton, S. 2013, ApJ, 763, L27 [NASA ADS] [CrossRef] [Google Scholar]
- Schlafly, E. F., & Finkbeiner, D. P. 2011, ApJ, 737, 103 [Google Scholar]
- Smith, N., Davidson, K., Gull, T. R., Ishibashi, K., & Hillier, D. J. 2003, ApJ, 586, 432 [NASA ADS] [CrossRef] [Google Scholar]
- Smith, N., Silverman, J. M., Chornock, R., et al. 2009, ApJ, 695, 1334 [Google Scholar]
- Smith, N., Miller, A., Li, W., et al. 2010, AJ, 139, 1451 [NASA ADS] [CrossRef] [Google Scholar]
- Smith, N., Mauerhan, J. C., & Prieto, J. L. 2014, MNRAS, 438, 1191 [NASA ADS] [CrossRef] [Google Scholar]
- Smith, N., Mauerhan, J. C., Cenko, S. B., et al. 2015, MNRAS, 449, 1876 [Google Scholar]
- Smith, N., Andrews, J. E., & Mauerhan, J. C. 2016, MNRAS, 463, 2904 [CrossRef] [Google Scholar]
- Smith, N., Kilpatrick, C. D., Mauerhan, J. C., et al. 2017, MNRAS, 466, 3021 [CrossRef] [Google Scholar]
- Smith, N., Andrews, J. E., Filippenko, A. V., et al. 2022, MNRAS, 515, 71 [NASA ADS] [CrossRef] [Google Scholar]
- Stahl, O., Weis, K., Bomans, D. J., et al. 2005, A&A, 435, 303 [NASA ADS] [CrossRef] [EDP Sciences] [Google Scholar]
- Stetson, P. B. 1987, PASP, 99, 191 [Google Scholar]
- Stetson, P. B. 2011, DAOPHOT: Crowded-field Stellar Photometry Package [Google Scholar]
- Thoene, C., de Ugarte Postigo, A., Leloudas, G., Cano, Z., & Maeda, K. 2015, ATel, 8417, 1 [NASA ADS] [Google Scholar]
- Woosley, S. E. 2017, ApJ, 836, 244 [Google Scholar]
- Yaron, O., & Gal-Yam, A. 2012, PASP, 124, 668 [Google Scholar]
Appendix A: Photometry
Table A.1 reports the gri photometry of SN 2009ip, obtained on 2021 September 10 UT.
IMACS photometry of SN 2009ip
Appendix B: Observed field of view
Figure B.1 shows the observed field of view in r−band of the galaxy NGC 7259, obtained on 2021 September 10, with an inset at the position of SN 2009ip.
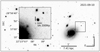 |
Fig. B.1. Observed field of view of the galaxy NGC 7259 in r band, obtained with the IMACS instrument at the 6.5 m Magellan Baade Telescope, on 2021 September 10. The inset shows a bright source at the position of SN 2009ip. The 1′ horizontal bar corresponds to 7.4 kpc at a distance of 25.5 Mpc. The resultant photometry is shown in Table A.1. |
All Tables
All Figures
|
Fig. 1. Late-time photometric evolution of SN 2009ip, with the photometry presented in this work in r (red triangle) and g (green triangle) bands, obtained on 2021 August 10. The figure also shows the photometry in r and g bands around the event 2012B, presented in Graham et al. (2014), and the late-time photometric evolution in these bands, between 251 and 813 days after Event B, presented in Graham et al. (2017). the dashed lines show the inferred slope of the source between the last reported observation and our photometry. Phase is given in relation to the begging of Event B. |
| In the text | |
|
Fig. 2. Very late-time spectrum of SN 2009ip obtained on 2021 September 10, or at phase +3274 relative to the event 2012B, obtained with the IMACS instrument at the 6.5 m Magellan Baade Telescope (in black). The spectrum is available on WISeREP (https://www.wiserep.org/, Yaron & Gal-Yam 2012). We also show the last published spectrum of SN 2009ip from Graham et al. (2017), obtained in 2015 December 11 (at phase +1164 days) and a spectrum from 2013 June 10 (at phase +260). |
| In the text | |
|
Fig. 3. Luminosity evolution of the Hα line in SN 2009ip between 251 and 3274 days after the peak of Event B (in blue). The triangle shows the value presented in this work, while the circles represent the values from Graham et al. (2017). We also show the evolution of the Hα luminosity for the long-lived SN 2005ip (purple squares, Smith et al. 2009, 2017), between 1893 and 3768 days after peak brightness, and SN 1993J (orange pentagons, Chandra et al. 2009), between 170 and 3608 days after peak. The gray dashed line highlights the expected decline rate of the luminosity if the Hα emission was driven by 56Co decay, following L ∝ 2−t/77.3. |
| In the text | |
|
Fig. B.1. Observed field of view of the galaxy NGC 7259 in r band, obtained with the IMACS instrument at the 6.5 m Magellan Baade Telescope, on 2021 September 10. The inset shows a bright source at the position of SN 2009ip. The 1′ horizontal bar corresponds to 7.4 kpc at a distance of 25.5 Mpc. The resultant photometry is shown in Table A.1. |
| In the text | |
Current usage metrics show cumulative count of Article Views (full-text article views including HTML views, PDF and ePub downloads, according to the available data) and Abstracts Views on Vision4Press platform.
Data correspond to usage on the plateform after 2015. The current usage metrics is available 48-96 hours after online publication and is updated daily on week days.
Initial download of the metrics may take a while.