| Issue |
A&A
Volume 676, August 2023
|
|
|---|---|---|
| Article Number | A57 | |
| Number of page(s) | 28 | |
| Section | Extragalactic astronomy | |
| DOI | https://doi.org/10.1051/0004-6361/202346503 | |
| Published online | 07 August 2023 | |
Searching for Milky Way twins: Radial abundance distribution as a strict criterion
1
Institute of Theoretical Physics and Astronomy, Vilnius University, Sauletekio Av. 3, 10257 Vilnius, Lithuania
e-mail: pil620a@gmail.com
2
Main Astronomical Observatory, National Academy of Sciences of Ukraine, 27 Akademika Zabolotnoho St, 03680 Kiev, Ukraine
3
Departamento de Física de la Tierra y Astrofísica, Instituto de Física de Partículas y del Cosmos, IPARCOS, Universidad Complutense de Madrid (UCM), 28040 Madrid, Spain
Received:
26
March
2023
Accepted:
15
May
2023
We search for Milky Way-like galaxies among a sample of approximately 500 galaxies. The characteristics we considered of the candidate galaxies are the following: stellar mass M⋆, optical radius R25, rotation velocity Vrot, central oxygen abundance (O/H)0, and abundance at the optical radius (O/H)R25. If the values of R25 and M⋆ of the galaxy were close to that of the Milky Way, then the galaxy was referred to as a structural Milky Way analogue (sMWA). The oxygen abundance at a given radius of a galaxy is defined by the evolution of that region (astration level, that is, the fraction of gas converted into stars, as well as gas exchange with the surroundings), and we then assumed that the similarity of (O/H)0 and (O/H)R25 in two galaxies suggests a similarity in their (chemical) evolution. If the values of (O/H)0 and (O/H)R25 in the galaxy were close to that of the Milky Way, then the galaxy was referred to as an evolutionary Milky Way analogue (eMWA). If the galaxy was simultaneously an eMWA and sMWA, then the galaxy was considered a Milky Way twin. We find that the position of the Milky Way on the (O/H)0–(O/H)R25 diagram shows a large deviation from the general trend in the sense that the (O/H)R25 in the Milky Way is appreciably lower than in other galaxies of similar (O/H)0. This feature of the Milky Way evidences that its (chemical) evolution is not typical. We identify four galaxies (NGC 3521, NGC 4651, NGC 2903, and MaNGA galaxy M-8341-09101) that are simultaneously sMWA and eMWA and can therefore be considered as Milky Way twins. In previous studies, Milky Way-like galaxies were selected using structural and morphological characteristics, that is, sMWAs were selected. We find that the abundances at the centre and at the optical radius (evolutionary characteristics) provide a stricter criterion for selecting real Milky Way twins.
Key words: galaxies: spiral / galaxies: abundances / ISM: abundances
© The Authors 2023
 Open Access article, published by EDP Sciences, under the terms of the Creative Commons Attribution License (https://creativecommons.org/licenses/by/4.0), which permits unrestricted use, distribution, and reproduction in any medium, provided the original work is properly cited.
This article is published in open access under the Subscribe to Open model. Subscribe to A&A to support open access publication.
1. Introduction
The position of the Milky Way in the context of the general galaxy population is an important subject of study, as it concerns identifying whether the Milky Way is really a typical spiral galaxy and the way(s) in which it differs if it is not. In a number of investigations, there have been attempts to establish how typical the Milky Way is amongst galaxies and how many Milky Way-like galaxies exist. Milky Way-like galaxies are usually referred to as Milky Way analogues (MWAs). Boardman et al. (2020b) noted that there is no single and commonly accepted definition of an MWA; rather, the definition can change depending on the goals of a particular study. Different characteristics of the Milky Way can be used when comparing it to other galaxies (de Vaucouleurs & Pence 1978; Hammer et al. 2007; Mutch et al. 2011; Licquia et al. 2015, 2016; McGaugh 2016; Fraser-McKelvie et al. 2019; Boardman et al. 2020b; Fielder et al. 2021), and galaxies may be identified as being Milky Way-like on the basis of having similar qualitative characteristics to the Milky Way or on the basis of their position relative to the Milky Way in a given parameter space.
de Vaucouleurs & Pence (1978) identified four nearby galaxies (NGC 1073, NGC 4303, NGC 5921, and NGC 6744) as MWAs since their photometric parameters (morphological type T, isophotal diameter, effective diameter, absolute B magnitude, and mean colour index (B − V)) are in remarkably close agreement with the corresponding values of the Milky Way. Mutch et al. (2011) selected MWAs using stellar mass and the structural parameter fDeV as the selection criteria, where the structural parameter fDeV describes the fraction of light that corresponds to the de Vaucouleurs component of the light profile and is correlated with the morphological type of galaxy as well as with the bulge-to-total ratio (B/T). Licquia et al. (2015) selected a large MWA sample from the Eighth Data Release (Aihara et al. 2011) of the Sloan Digital Sky Survey III (SDSS-III; York et al. 2000) on the basis of stellar mass and current star formation rate. Boardman et al. (2020b) presented a sample of 62 galaxies identified as MWAs on the basis of their stellar masses and bulge-to-total ratios from the Mapping Nearby Galaxies at Apache Point Observatory (MaNGA) survey (Bundy et al. 2015). The selection of MWAs using only two characteristics of the Milky Way as the selection criteria is based on the Copernican assumption that the Milky Way is not extraordinary amongst galaxies, that is, any property of the Milky Way is similar to that of the MWA galaxies selected (Mutch et al. 2011; Licquia et al. 2015; Boardman et al. 2020b).
It is evident that when the process of selecting MWAs involves using a larger number of parameters as well as more stringent constraints on a given parameter, it yields a sample of MWA galaxies with properties that are closer to the true properties of the Milky Way. However, the use of a greater number of selection criteria (or an overly strict definition of “analogue”) yields few, if any, MWA galaxies (Boardman et al. 2020a). Indeed, Fraser-McKelvie et al. (2019) found only 176 MWAs amongst over a million galaxies in the Sloan Digital Sky Survey (SDSS) Data Release 7 (Abazajian et al. 2009) when selecting based on stellar mass, bulge-to-total ratio (B/T), and morphology (the presence of spiral arms and the presence of a bar). Boardman et al. (2020b) did not find a single MWA in the SDSS-IV MaNGA survey (Bundy et al. 2015) when attempting to select based on a combination of stellar mass, star formation rate, bulge-to-total ratio (B/T), and disc scale length. Those results suggested that some parameter(s) of the Milky Way galaxy may be unusual or that the combination of its properties may be rare.
Hammer et al. (2007) compared the Milky Way to disc galaxies within the same mass range, using its location in the Tully–Fisher (variant of Vrot versus k-band luminosity) and other diagrams. They found for all relationships that the Milky Way galaxy is systematically offset by 1σ, showing a significant deficiency in stellar mass, angular momentum, disc radius, and Fe/H in the stars in its outskirts at a given Vrot, i.e. on the basis of its location in the (Lk, Vrot, and R25) volume, the fraction of spirals like the Milky Way was found to be around 7%. In contrast, McGaugh (2016) found that the Milky Way appears to be a normal spiral galaxy that obeys scaling relations, such as Tully–Fisher, and the size-mass relation. He noted that the galaxy NGC 3521 has a baryonic mass, rotation velocity, and scale disc length that are very similar to those of the Milky Way; these quantities are identical within the uncertainties. McGaugh (2016) concluded that NGC 3521 is a near twin to the Milky Way. Licquia et al. (2016) considered the three variants of the Tully–Fisher relation (rotation velocity versus i-band luminosity, stellar mass, and baryonic mass) and found that our Galaxy’s properties are in excellent agreement with those Tully–Fisher relations. They also examined the three-dimensional relation (rotation velocity-luminosity-radius) using the disc scale length as a measure of size for spiral galaxies. Licquia et al. (2016) found that the Milky Way lies farther from the relation in comparison to 90% of other spiral galaxies, yielding evidence that it is unusually compact for its rotation velocity and luminosity. The expected disc scale length for the Milky Way from the relation is approximately 5 kpc, nearly twice as large as the observed value. Thus, there is a hint that some parameter(s) of the Milky Way (e.g. size) may not be perfectly typical and that the combination of the parameters may be rather rare.
The characteristics of a galaxy can be conditionally divided into two types. The parameters of the first type (e.g. morphology, luminosity, stellar mass, rotation velocity) describe the structure and global characteristics of a galaxy at the present-day epoch and can be called “structural parameters”. The parameter of the second type is related to the oxygen abundance of a galaxy. The oxygen abundance at a given radius of a galaxy is defined by the evolution of this region of a galaxy (fraction of gas converted into stars, i.e. astration level, and matter exchange with the surroundings). Then the oxygen abundance can be considered as an indicator of a galaxy’s evolution and can be called an “evolutionary parameter”. A galaxy located close to the Milky Way in the field(s) of the first type of parameters is referred to in this work as a structural Milky Way analogue (sMWA). A galaxy located close to the Milky way in the field of the second type of parameters is referred to as an evolutionary Milky Way analogue (eMWA). If a galaxy is simultaneously an sMWA and an eMWA, then such a galaxy is considered a twin of the Milky Way.
In fact, sMWAs were selected and examined in the papers cited above. The oxygen abundance at the optical radius of the Milky Way is appreciably lower in comparison to other galaxies with similar central oxygen abundance (see below). This feature of the Milky Way evidences that its (chemical) evolution is not typical. Therefore, it is highly useful to study the evolutionary analogues of the Milky Way. The goal of the current study is to search for and examine the galaxies that are simultaneously sMWAs and eMWAs. We considered three structural parameters: optical radius, stellar mass, and rotation velocity. Since rotation curve data are not available for some galaxies or the rotation velocity has been measured with a large uncertainty (e.g. in face-on galaxies with low-inclination angles) the position in the M⋆–R25–Vrot has not been determined. The stellar mass – optical radius diagram was therefore used to select the sMWAs. The central abundance versus abundance at the optical radius diagram served in the search for eMWAs. We compared the Milky Way with a sample of spiral galaxies for which radial abundance distributions, optical radii, stellar masses, and rotation curves were derived by us or compiled from the literature. Our sample of the comparison galaxies involves the nearby galaxies and the galaxies from the MaNGA survey. The obtained candidates of Milky Way twins are examined in more detail.
This paper is organised in the following way: the Milky Way characteristics are described in Sect. 2. In Sect. 3, a sample of (comparison) galaxies is reported. The selection of the Milky Way-like galaxies is given in Sect. 4. The discussion is in Sects. 5 and 6 contains a brief summary.
2. Characteristics of the Milky Way Galaxy
2.1. Milky Way optical radius R25
The maximum size of the Galactic stellar disc of the Milky Way is not yet known. Some studies have suggested an abrupt drop-off of the stellar density of the disc at galactocentric distances R ≳ 15 kpc. Minniti et al. (2011) considered the clump giants of the disc as standard candles, calibrated from HIPPARCOS parallaxes. They concluded that there is an edge in the stellar disc of the Milky Way at R = 13.9 ± 0.5 kpc along various lines of sight across the Galaxy. Based on the Two Micron All Sky Survey (2MASS) data, Amôres et al. (2017) found a disc truncation at approximately 16.1 ± 1.3 kpc. If age dependence for disc parameters is considered, then the disc truncation is 19.4 ± 1.4 kpc or 18.7 ± 1.6 kpc. The density drops by 90% within 1 kpc, and therefore the cutoff is sharp. In practice, this means that no disc stars, or very few of them, should be found beyond this limit.
In contrast, López-Corredoira et al. (2018) revealed the presence of disc stars at R > 26 kpc. Chrobáková et al. (2020) calculated the stellar density using star counts obtained from Gaia Data Release 2 up to a galactocentric distance of R = 20 kpc. They found that the stellar density maps can be fitted by an exponential disc in the radial direction hd = 2.07 ± 0.07 kpc, with a weak dependence on the azimuth, up to 20 kpc without any cutoff. The flare and warp are clearly visible. They found the stellar density in the solar neighbourhood ρ = 0.064 stars pc−3 where the solar neighbourhood is defined as the area where 7.5 kpc < R < 8.5 kpc and −0.05 < z < 0.05 kpc. Chrobáková et al. (2020) noted that this does not mean that radial truncations are not possible in spiral galaxies, as there are other galaxies in which they have been observed many years ago (van der Kruit & Searle 1981), though the Milky Way is not one of them. Is should be noted that an exponential distribution was also observed for the gas density of the Milky Way without any truncation up to a distance of 40 kpc from the centre (Kalberla & Dedes 2008).
The optical radius can be estimated from the radial distributions of the surface stellar mass density in the disc described by Eq. (1) by adopting (M/L)B = 1.4 (Flynn et al. 2006). The radial distribution of the surface stellar mass density in the disc is described by the expression
where Σ⋆, R0 is the surface stellar mass density at the solar galactocentric distance (R0 = 8.178 ± 0.013 kpc, GRAVITY Collaboration 2019) and hd is the disc scale length. It should be noted that a two-component disc (thin and thick discs of different scale lengths) is usually considered (e.g. McMillan 2017). The single exponential disc is adopted here.
Flynn et al. (2006) found a local stellar disc surface density of 35.5 M⊙ pc−2, while McKee et al. (2015) found the value of 33.4 M⊙ pc−2. The solar neighbourhood is located in the interarm region, and the “counted” local stellar disc surface density should be corrected for the spiral arm enhancement in order to find the azimuthal average of the surface stellar mass density at the solar galactocentric distance, that is, a 10% enhancement should be added to the “counted” local stellar disc surface density (Flynn et al. 2006; Kubryk et al. 2015). This results in a stellar disc surface density at the solar galactocentric distance of 39 M⊙ pc−2 (Flynn et al. 2006) and 37 M⊙ pc−2 (McKee et al. 2015). We adopted Σ⋆, R0 = 38 M⊙ pc−2. Bland-Hawthorn & Gerhard (2016) analysed 130 papers on disc parameters, with scale lengths ranging from 1.8 to 6.0 kpc. Their analysis of the main papers (15 in all) on this topic led to hd = 2.6 ± 0.5 kpc.
Regarding the conversion of the solar units L⊙ pc−2 to magB arcsec−2, we note that the μB = 25.0 magB arcsec−2 corresponds to 6.44 L⊙ pc−2 with the adopted MB, ⊙ = 5.45 (the relation is μB(mag arcsec2) = −2.5log LB (L⊙ pc−2) +27.022). The value of the surface brightness of μB = 25.0 magB arcsec−2 corresponds to the stellar surface mass density of ∼9.0 M⊙ pc−2, assuming (M/L)B = 1.4 (Flynn et al. 2006). The value of the optical radius R25 is around 12 kpc for the hdisc = 2.6 kpc and the stellar disc surface mass density at the solar galactocentric distance of 38 M⊙ pc−2. This value of the optical radius is close to the early estimation of the optical radius (R25 = 11.5 kpc) obtained by de Vaucouleurs & Pence (1978). We adopted R25 = 12.0 kpc for the Milky Way.
2.2. Stellar mass M⋆ and black hole mass MBH of the Milky Way
The stellar mass of the Milky Way is the sum of the stellar masses of disc and bulge. Two comments on the determination of the stellar mass of the Milky Way should be presented. First, the mass of a single component exponential disc of a given scale length can be estimated through the simple relation (McMillan 2017):

where Σ⋆, 0 is the central surface mass density of the disc and hd is the scale length of the surface mass density distribution. However, a two-component disc (thin and thick disc) is usually considered. Therefore, the above expression should be applied to each component of the disc. Second, it is often used to derive not the mass of the pure bulge, but the sum of the mass of the bulge and disc within the bulge region.
Estimations of the stellar mass of the Milky Way have been reported in many papers (Flynn et al. 2006; Bovy & Rix 2013; Licquia & Newman 2015, 2016; Bland-Hawthorn & Gerhard 2016; McMillan 2017; Cautun et al. 2020, among others). Estimations from some papers are listed in Table 1. We adopted the following value of the stellar mass of the Milky Way: M⋆ = 5.2 × 10¹⁰ M⊙ or log(M⋆/M⊙) = 10.716. The mass of the black hole at the centre of the Milky Way is equal to MBH = 4.15 × 10⁶ M⊙ or log(MBH/M⊙) = 6.618 (GRAVITY Collaboration 2019).
Estimations of the stellar mass of the Milky Way from different publications.
2.3. Rotation velocity Vrot
The rotation curve of the Milky Way has been obtained by many studies (e.g. Burton & Gordon 1978; Eilers et al. 2019; Ablimit et al. 2020; Sofue 2020). Figure 1 shows the rotation curves from one early investigation (Burton & Gordon 1978) and from three recent papers (Eilers et al. 2019; Ablimit et al. 2020; Sofue 2020). Burton & Gordon (1978) have determined the Galactic rotation curve in the galactocentric distance range up to 10 kpc using molecular gas velocities combined with atomic gas velocities. Eilers et al. (2019) have measured the circular velocity curve of the Milky Way with the highest precision to date across galactocentric distances of 5 ≲ R ≲ 25 kpc. They used precise parallaxes, spectral data, and photometric information from the Apache Point Observatory Galactic Evolution Experiment (APOGEE), the Wide-field Infrared Survey Explorer (WISE), 2MASS data, and Gaia for 23 000 luminous red giant stars. Ablimit et al. (2020) analysed about 3500 classical Cepheids identified from different surveys. They used two kinematical methods to measure the Galactic rotation curve in the galactocentric distance range from ∼4 to ∼19 kpc. Sofue (2020) constructed an unified rotation curve of the Milky Way from the Galactic centre to the galactocentric distance of about 100 kpc by averaging the published rotation curves that are based on the molecular gas velocities and on the velocities of approximately 16 000 red clump giants in the outer disc combined with velocities of around 5700 halo K giants.
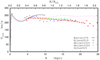 |
Fig. 1. Rotation curves of the Milky Way from Burton & Gordon (1978), Eilers et al. (2019), Ablimit et al. (2020; two variants), and Sofue (2020). |
The obtained values of the maximum rotation velocity are between ∼230 km s−1 and ∼245 km s−1. The value of the rotation velocity of the Milky Way that we adopted is Vrot = 235 km s−1, or log Vrot = 2.371.
2.4. Oxygen abundance
The oxygen abundances of 42 H II regions of the Milky Way determined through the direct Te method have been recently reported by Arellano-Córdova et al. (2020, 2021). Panel a in Fig. 2 shows the radial distribution of the oxygen abundances in the Milky Way obtained by the cited authors. The black circles denote the H II regions from Arellano-Córdova et al. (2020). The dashed black curve is the quadratic fit to those data

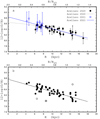 |
Fig. 2. Radial oxygen abundance distribution in the Milky Way. Panel a: radial abundance gradients obtained by Arellano-Córdova et al. (2020, 2021). The black circles designate the H II regions from Arellano-Córdova et al. (2020). The dashed black curve is the quadratic fit to those data. The blue squares mark the H II regions from Arellano-Córdova et al. (2021). The solid blue line shows the linear fit to all the data. Panel b: radial abundance distribution in the Milky Way obtained in this work (see text). The black circles denote the H II regions used in the determination of the radial abundance gradient (solid line). The open circles designate the H II regions excluded from the determination of the abundance gradient. |
The blue squares in panel a of Fig. 2 designate the H II regions from Arellano-Córdova et al. (2021). The solid blue line is the linear fit to all the data

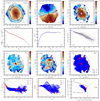 |
Fig. 3. Properties of the MaNGA galaxy M-8934-12701. Panel a1: surface brightness distribution across the image of the galaxy in sky coordinates (pixels). The value of the surface brightness is colour-coded. The circle shows the kinematic centre of the galaxy, the dark solid line indicates the position of the major kinematic axis of the galaxy, and the solid ellipse is the optical radius for kinematic angles. The red cross is the photometric centre, the red dashed line indicates the position of the major photometric axis, and the red dashed ellipse is the optical radius for photometric angles. Panel a2: photometric profile (points) and its fit (line) within the optical radius. Panel b1: line-of-sight velocity field in sky coordinates. Panel b2: rotation velocity curve (points) and its fit (line) within the optical radius. Panel c1: oxygen abundance map. Panel c2: radial abundance distribution. The grey points denote the abundances for the individual spaxels, the solid line is the simple linear fit to those data, while the dashed line is the broken linear fit to the same data. Panel d1: map of the gas velocity dispersion σ. Panel d2: radial distribution of the gas velocity dispersion σ in the disc. The coloured circles denote the gas velocity dispersion for the individual spaxels of H II region-like (blue symbols), intermediate (red symbols), and AGN-like (black symbols) spectra classification. Panel e1: map of the measured flux in the Hα emission line per spaxel in units of 10−17 erg s−1 cm−2/spaxel. Panel e2: radial distribution of the measured Hα flux. The coloured circles denote the flux for the individual spaxels of H-region-like (blue symbols), intermediate (red symbols), and AGN-like (black symbols) spectra classification. Panel f1: map of the BPT spectra classification. The BPT types of radiation for the individual spaxels are colour-coded. Panel f2: BPT diagram for the individual spaxels colour-coded by H II region-like (blue symbols), intermediate (red symbols), and AGN-like (black symbols) spectra. Solid and short-dashed curves mark the demarcation line between AGNs and H II regions defined by Kauffmann et al. (2003) and Kewley et al. (2001), respectively. The long-dashed line is the dividing line between Seyfert galaxies and LINERs defined by Cid et al. (2010). |
It is believed that the Te method, which is based on the measurements of temperature sensitive line ratios, should give accurate oxygen abundances. In practice, however, Te-based oxygen abundances of the same H II region derived in different works can differ for two reasons: First, there may be errors in the line intensity measurements. Second, the Te-based oxygen abundances depend on the relations used to convert the values of the line fluxes to the electron temperatures and to the ion abundances. The determined abundances also depend on the adopted relationship between the electron temperature in low-ionisation zones and electron temperatures in the high-ionisation part of the nebula. Differences between the oxygen abundances in a given H II region produced by different relations used in the Te method can be appreciable. For example, Esteban et al. (2017) found an oxygen abundance of 12 + log(O/H)Te = 8.14 ± 0.05 in the Galactic H II region Sh 2−83, while Arellano-Córdova et al. (2020) found 12 + log(O/H)Te = 8.28 ± 0.08 in the same region using the same spectroscopic measurements. Berg et al. (2015) detected auroral lines in 45 H II regions in the nearby galaxy NGC 628. They determined the Te-based abundances in those H II regions and estimated the radial abundance gradient. They found the central (intersect) oxygen abundance 12 + log(O/H)0 = 8.83 ± 0.07 in NGC 628. In their recent paper (Berg et al. 2020), they recalculated the ionic and total Te-based abundances in the same H II regions and determined the central (intersect) oxygen abundance 12 + log(O/H)0 = 8.71 ± 0.06 in NGC 628.
In this paper, the oxygen abundance of the Milky Way is compared to the oxygen abundances in galaxies determined through the R calibration from Pilyugin & Grebel (2016). The Te-based oxygen abundances in H II regions used as the calibrating data points in the construction of the R calibration were derived using the Te-method equations reported in Pilyugin et al. (2012). Therefore the Te-based oxygen abundance in the Milky Way and the R calibration-based abundances in other galaxies correspond to this unique abundance scale (Pilyugin & Grebel 2016; Pilyugin et al. 2022) if only the Te-based oxygen abundances in H II regions in the Milky Way are determined using the Te-method equations from Pilyugin et al. (2012). We then redetermined the oxygen abundances in H II regions of the Milky Way. The line intensity measurements in the spectra of the H II regions were taken from the same sources as in Arellano-Córdova et al. (2020, 2021). If the measurements of two auroral lines ([O III]λ4363 and [N II]λ5755) were available for the H II region, then the two values of the oxygen abundance were determined. The first value of the abundance is based on the electron temperature in high-ionisation parts of the nebula estimated using the auroral line [O III]λ4363 and the electron temperature in the low-ionisation parts of the nebula obtained from the relationship between the electron temperature in low-ionisation zones and electron temperatures in high-ionisation parts of the nebula. The second value of the abundance is based on the electron temperature in low-ionisation zones estimated from the measured auroral line [N II]λ5755 and the electron temperature in high-ionisation zones determined from the relationship between electron temperatures.
The obtained oxygen abundances are presented in the lower panel of Fig. 2. Because there is no visual evidence for a break in the O/H gradient, we characterised the O/H gradient in the Milky Way with a single linear regression. The points with deviations in excess of 0.3 dex from the regression (open circles in the lower panel of Fig. 2) were rejected when determining the final relation. The obtained relation,

is shown by the solid line in the lower panel of Fig. 2. The scatter in O/H around this relation is 0.092 dex for the 54 data points. The derived O/H–R relation (Eq. (5)) resulted in the value of the oxygen abundance at the optical radius (R25 = 12 kpc) of 12 + log(O/H)R25 = 8.24.
We emphasise that we do not pretend that the values of the Te-based abundances for the Milky Way recomputed here are more accurate than the original abundance values derived by Arellano-Córdova et al. (2020, 2021). Our aim is that the abundances of all the galaxies used here correspond to the same metallicity scale. This is mandatory for the current study.
We also note that the derived value of the central (intersect) oxygen abundance in the Milky Way may be slightly overestimated. The measured radial distributions of the surface mass density of atomic H I and molecular H2 hydrogen in the Milky Way suggests that the gas can be entirely exhausted (fully converted into stars) within a radius of approximately 1 kpc (McMillan 2017). If this is the case, then the gas-phase oxygen abundance reaches the maximum (attainable) value at the radius of around 1 kpc and remains constant within this radius.
Thus, we adopted the following values for the Milky Way characteristics. The stellar mass is M⋆ = 5.2 × 10¹⁰ M⊙ or log M⋆ = 10.716. The rotation velocity is Vrot = 235 km s−1 or log Vrot = 2.371. The optical radius is R25 = 12 kpc or log R25 = 1.079. The mass of the black hole is MBH = 4.15 × 10⁶ M⊙ or log MBH = 6.618. The central oxygen abundance is 12 + log(O/H)0 = 8.76. The oxygen abundance at the optical radius is 12 + log(O/H)R25 = 8.24.
3. A sample of comparison galaxies
The characteristics of the Milky Way are compared with a sample of galaxies. Our sample of the comparison involves two subsamples: a sample of nearby galaxies and a sample of galaxies from the MaNGA survey. Those subsamples are described in this section.
3.1. Nearby galaxies
The spectral measurements of H II regions in nearby galaxies are compiled in Pilyugin et al. (2004, 2014). This data compilation served as the base for the construction of the comparison sample of nearby galaxies. To have the oxygen abundances in a unique metallicity scale, only the galaxies where the radial abundance gradient was determined through the R calibration from Pilyugin & Grebel (2016) were considered, with one exception (see below). Therefore, only the spectra with measured emission lines [O II]λλ3727,3729 from the compilation in Pilyugin et al. (2014) were taken into consideration. New spectral measurements of H II regions in the galaxies were added (if available).
The galaxy NGC 3521 is the one exception, as the abundances in ten H II regions were estimated through the P calibration and were added to the abundances in three H II regions determined through the R calibration (Sect. 4.4.1). The relative accuracy of the P calibration-based abundances is around 0.1 dex, that is, the oxygen abundances estimated through the P calibration agree with the Te-based abundances within ∼0.1 dex (Pilyugin & Thuan 2005). However, the P calibration encounters the following difficulty: It is well known that the relation between the oxygen abundance and the strong oxygen line intensities is double valued, with two distinct parts, traditionally known as the upper and lower branches of the R23–O/H diagram (e.g. Pagel et al. 1979; Pilyugin 2000, 2001). Two distinct relations between the oxygen abundance and the strong oxygen line intensities have been established: one for the upper branch (the high-metallicity calibration) and one for the lower branch (the low-metallicity calibration). There is a transition zone between the upper and lower branches (from 12 + log(O/H) ∼ 8.3 to 12 + log(O/H) ∼ 8.0) where the P calibration cannot be applied (e.g. Pilyugin & Thuan 2005). Thus, one has to know a priori on which of the two branches the H II region lies. In the case of NGC 3521, we overcame this difficulty in the following way. It is known that discs of spiral galaxies show radial oxygen abundance gradients, in the sense that the oxygen abundance is higher in the central part of the disc and decreases with galactocentric distance. Abundances determined through the R calibration in three H II regions in the inner part of NGC 3521 are 12 + log(O/H) ∼ 8.6. We thus started from the H II regions in the inner part of NGC 3521 and moved outward until the radius where the oxygen abundance decreases to 12 + log(O/H) ∼ 8.3 (the start of the transition zone between the upper and lower branches). An unjustified use of the upper branch calibration in the determination of the oxygen abundance in low-metallicity H II regions would result in wrong estimations. Therefore, we used the R calibration everywhere, which is workable over the whole metallicity scale, while we used the P calibration in one galaxy only.
The distances to galaxies, the angular optical radii, the angles of the orientation of the galaxy in space, the stellar masses, the rotation curves, and the masses of the central black holes were taken from the literature. The rotation curves of a number of nearby galaxies (e.g. with small inclination angles) were either not available or estimated with large uncertainties. The estimations of the masses of the central black holes were available for a small fraction of galaxies only.
The sample of nearby galaxies are reported in Table 2; the list includes 53 galaxies. Table 2 lists the general characteristics of each galaxy. The first column provides the name for each galaxy. The optical (isophotal) radius R25 in arcmin of each galaxy is reported in the second column. The inclination and the position angle of the major axis are listed in columns three and four. The distance is reported in column five. The rotation velocity is given in column six. The stellar mass is reported in column seven. The optical radius in kiloparsecs, estimated from the data in columns two and five, is given in column eight. The oxygen abundances at the centre 12 + log(O/H)0 and at the optical radius 12 + log(O/H)R25 are listed in columns nine and ten. The mass of the black hole at the centre of the galaxy is reported in Col. 11. Notes on the individual galaxies and the references to the sources of the data are given in Appendix A. The radial abundance distributions and rotation curves of several candidate Milky Way twins are presented in Sect. 4.4.
Characteristics of nearby galaxies.
3.2. MaNGA galaxies
Using the publicly available spectroscopy obtained by the MaNGA survey (Bundy et al. 2015; Albareti et al. 2017, Data Release 15), the rotation curves, surface brightness profiles, radial distributions of the oxygen abundance, and the gas velocity dispersion were determined for a large sample of late-type galaxies (Pilyugin et al. 2018, 2019, 2020, 2021). As an example, Figs. 3 and 4 show the obtained maps and radial distributions of different characteristics of the MaNGA galaxies M-8934-12701 and M-8341-09101. The characteristics of the MaNGA galaxies were determined using our own emission line measurements. The emission line parameters for those galaxies are also available from the MaNGA Data Analysis Pipeline (DAP) measurements. The geometrical parameters of the galaxies (coordinates of the rotating centre, the position angle of the major kinematic angle, and the inclination angle) were obtained for a number of galaxies using both our measurements and the DAP measurements (we used the datacubes from the publicly available Data Release 16; Pilyugin et al. 2021). We also carried out a quantitative comparison between spaxel properties (oxygen abundance and gas velocity dispersion) based on our measurements and the DAP measurements. The geometrical parameters and spaxel properties of the galaxies based on our measurements agree with those based on the DAP measurements (Pilyugin et al. 2021). Thus, our data on the MaNGA galaxies are robust.
The distances to the galaxies were taken from the NASA/IPAC Extragalactic Database (NED)1. The NED distances use flow corrections for Virgo, the Great Attractor, and the Shapley Supercluster infall (adopting a cosmological model with H0 = 73 km s−1 Mpc−1, Ωm = 0.27, and ΩΛ = 0.73). We note that we considered a rather nearby sample of galaxies, and therefore the choice of parameters for the cosmological model is not very crucial. We chose the spectroscopic stellar masses M⋆ of the SDSS and BOSS (i.e. the Baryon Oscillation Spectroscopic Survey in SDSS-III; see Dawson et al. 2013). The spectroscopic masses were taken from the table STELLARMASSPCAWISCBC03 and were determined using the Wisconsin method (Chen et al. 2012) with the stellar population synthesis models from Bruzual & Charlot (2003).
The oxygen abundances were determined through the R calibration (Pilyugin & Grebel 2016) using the spaxel spectra. The measured line fluxes  were corrected for the interstellar reddening Fλ =
  , where CHβ is the logarithmic extinction at Hβ. The value of CHβ was estimated through a comparison between the measured and the theoretical FHα/FHβ ratios,

using the reddening law (function fλ) of Cardelli et al. (1989) with RV = 3.1. The theoretical value for the (FHα/FHβ)teor line ratio (=2.87) was taken from Osterbrock & Ferland (2006), assuming the case B recombination. If the measured value of the ratio FHα/FHβ was lower than the theoretical one, then the reddening was assumed to be zero.
We classified the excitation of the spaxel spectrum using its position on the standard diagnostic Baldwin–Phillips–Terlevich (BPT) diagram [N II]λ6584/Hα versus the [O III]λ5007/Hβ, as suggested by Baldwin et al. (1981). As in our previous studies (Zinchenko et al. 2019; Pilyugin et al. 2020, 2021), the spectra located to the left (below) the demarcation line of Kauffmann et al. (2003) are referred to as the SF-like or H II region-like spectra; those located to the right (above) the demarcation line of Kewley et al. (2001) are referred to as the AGN-like spectra; and the spectra located between both demarcation lines are classified as intermediate (INT) spectra. The oxygen abundances were determined only in spaxels with H II region-like spectra.
The final sample of MaNGA galaxies was selected by visual inspection, considering the obtained surface brightness profile, rotation curve, and abundance distribution for each galaxy. The spaxels with measured emission lines and surface brightness needed to be well distributed across the galactic disc, that is, covering more than ∼2/3R25. This condition allowed us to estimate values of the rotation velocity, the surface brightness, and the oxygen abundance both at the centre and at the optical radius since the extrapolation is relatively small (if any). Unfortunately, this condition resulted in the loss of galaxies where ongoing star formation does not occur over a significant fraction of galaxy. We note that only the spaxel spectra where the used lines are measured with a S/N > 3 were considered. Therefore, the spaxels with reliable measured spectra can cover less than ∼2/3R25, even if the total spaxel spectra beyond 2/3R25 are available. The deprojected fractional galactocentric distances (normalised to the optical radius R25) of each spaxel were estimated using the kinematic angles for galaxies with inclination angles of i ≳ 30° and photometric angles for face-on galaxies with inclination angles of i ≲ 30°.
For the current study, galaxies from the MaNGA sample were selected when the radial oxygen abundance distribution was satisfactory approximated by a single linear relation. The approximations of the radial abundance distribution in each galaxy for both the simple linear fit and the broken linear fit were estimated (panels c2 in Figs. 3 and 4). We used the differences between the intersect values of the oxygen abundances given by the single linear relation and the abundances given by the broken linear relation at the galaxy centre Δ(O/H)0 and at the optical radius Δ(O/H)R25 as the selection criteria. The absolute values of Δ(O/H)0 and Δ(O/H)R25 are usually within 0.05 dex for the galaxies (Zinchenko et al. 2016; Pilyugin et al. 2017). The galaxies where the sum of the absolute values of Δ(O/H)0 and Δ(O/H)R25 exceed 0.1 dex were rejected.
Thus, our final sample of comparison galaxies includes 504 galaxies, of which 451 are MaNGA galaxies and 53 are nearby galaxies. Unfortunately, the rotation curves are available only for 423 galaxies (e.g. rotation curves are not derived for low-inclination MaNGA galaxies), and the stellar mass estimations are available only for 495 out of 504 galaxies.
4. Milky Way among galaxies
4.1. Comparison of the Milky Way properties with our reference sample
Figure 5 shows the comparison between the characteristics of the Milky Way and the galaxies in our sample. In panel a, we plot the stellar mass of the galaxy M⋆ as a function of its rotation velocity Vrot (Tully–Fisher diagram). Since the gas mass in spiral galaxies with stellar masses similar to the Milky Way is lower than the stellar mass by around an order of magnitude (Parkash et al. 2018), the stellar mass can also be considered in the first approximation as the representative of the baryonic mass of the galaxy. The grey points in the figure denote the data for individual MaNGA galaxies, while the goldenrod points correspond to nearby galaxies from our sample. The linear fit to all the data is given by the expression

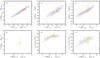 |
Fig. 5. Comparison of the characteristics of the Milky Way and galaxies from our sample. Panel a: stellar masses M⋆ as a function of rotation velocity Vrot (Tully–Fisher diagram). The grey points in each panel denote individual MaNGA galaxies, while the goldenrod points correspond to nearby galaxies in our sample. The solid line is the linear fit to all the data, while the dotted lines are ±σ deviations. The red circle marks the position of the Milky Way. Panel b: optical radius R25 as a function of rotation velocity Vrot. Panel c: optical radius R25 as a function of stellar mass M⋆. Panel d: black hole mass MBH as a function of stellar mass M⋆. Panel e: central oxygen abundance (O/H)0 as a function of stellar mass M⋆. Panel f: oxygen abundance at the optical radius (O/H)R25 as a function of stellar mass M⋆. |
and is shown with the solid line in panel a of Fig. 5. The mean value of the scatter in the M⋆ around the relation is σ = 0.220 dex for the 414 points. The red circle marks the position of the Milky Way. The deviation of the Milky Way stellar mass from the relation is −0.170 dex, or −0.77σ.
Panel b of Fig. 5 shows the optical radius of the galaxy R25 in kiloparsecs as a function of its rotation velocity Vrot. The linear fit to all the data,

is shown with the solid line in panel b of Fig. 5. The mean value of the scatter in the R25 values around the relation is σ = 0.112 dex for the 423 points. The red circle marks the position of the Milky Way. The deviation of the Milky Way optical radius from the relation is −0.134 dex, or −1.21σ.
In panel c of Fig. 5, we plot the optical radius of the galaxy R25 in kiloparsecs versus the stellar mass M⋆. The obtained R25–M⋆ relation is given by

and is shown with the solid line in panel c of Fig. 5. The mean value of the scatter in the R25 values around the relation is σ = 0.100 dex for the 495 points. The red circle marks the position of the Milky Way. The deviation of the Milky Way optical radius from the relation is −0.101 dex, or −1.00σ.
Panel d of Fig. 5 shows the black hole mass MBH as a function of stellar mass M⋆. Unfortunately, the estimations for the central black hole mass are available only for a small fraction of the nearby galaxies.
Panel e of Fig. 5 shows the central oxygen abundance (O/H)0 in the galaxy as a function of stellar mass M⋆. The points designate the data for individual galaxies (grey – MaNGA and goldenrod – nearby galaxies) from our sample. The red circle marks the position of the Milky Way. Panel f of Fig. 5 shows the oxygen abundance at the optical radius (O/H)R25 as a function of stellar mass M⋆.
Inspection of Fig. 5 showed that the most prominent deviation of the position of the Milky Way from the general trends of the galaxies in our sample takes place in the (O/H)0–M⋆ and (O/H)R25–M⋆ diagrams. The difference between oxygen abundances at the optical radius and at the centre log(O/H)R25–log(O/H)0 is, by definition, the radial abundance gradient in the galaxy expressed in units of dex/R25. Panel a in Fig. 6 shows the normalised histogram of the radial oxygen abundance gradients for our sample of galaxies. The solid line denotes the histogram of the measured gradients in bins of 0.025 dex/R25, and the dashed line is the Gaussian fit to those data. The arrow marks the value of the radial abundance gradient of the Milky Way. The mean value of the gradients in our sample of galaxies is −0.20 dex/R25, and the scatter is −0.10 dex/R25. Sánchez et al. (2014) examined the radial abundance gradients in the sample of CALIFA galaxies and found that all galaxies without clear evidence of an interaction present a common gradient in the oxygen abundance with a characteristic slope of −0.16 dex/R25 and a dispersion of 0.12 dex/R25. Thus, the distribution of the gradients for our sample of galaxies is similar to the distribution from Sánchez et al. (2014). Panel a in Fig. 6 shows that the gradient in the Milky Way is in the far wing (or in the tail) of the distribution of gradients. The deviation of the gradient in the Milky Way (−0.5 dex/R25) from the mean value of the gradients for our sample of galaxies (−0.2 dex/R25) is −0.3 dex/R25, which is −3σ. The ratio of the oxygen abundance at the centre to the oxygen abundance at the optical radius is (O/H)0/(O/H)R25 ∼ 3 for the Milky Way, which is twice as large as the mean value of ratios for our sample of galaxies. It should be noted that the (O/H)0/(O/H)R25 ratio in the well studied nearby galaxy NGC 5457 (M 101) is twice as high as that in the Milky Way. Panel b in Fig. 6 shows the normalised histograms of the radial oxygen abundance gradients for subsamples of MaNGA (dotted line) and nearby (solid line) galaxies. The histograms have been normalised to the same value as the histogram in panel a.
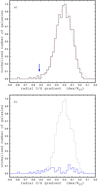 |
Fig. 6. Histograms of the radial oxygen abundance gradients for our sample of galaxies. Panel a: normalised histogram of the radial oxygen abundance gradients for our sample of galaxies (MaNGA + nearby). The solid line denotes the histogram of the obtained gradients, while the dashed line corresponds to the Gaussian fit to those data. The arrow marks the value of the radial abundance gradient of the Milky Way. Panel b: normalised histograms of the radial oxygen abundance gradients for subsamples of MaNGA (dotted line) and nearby (solid line) galaxies. The histograms were normalised to the same value as the histogram in panel a. |
4.2. Searching for Milky Way twin candidates using strict criteria
The optical radius, stellar mass, and rotation curve specify the structure of a galaxy. These characteristics of a galaxy are related to each other. In general, any two of these characteristics can be used to search for galaxies with a similar structure. Rotation velocities are not available for a fraction of the galaxies in our sample. Therefore, a stellar mass versus optical radius diagram was used as the basic diagram to compare the structure of the Milky Way and other spiral galaxies. Galaxies located close to the Milky Way on the M⋆–R25 diagram are referred to as structural Milky Way analogues (sMWAs).
The oxygen abundance at a given radius of a galaxy is defined by the evolutionary stage (the astration level) of that region and by the matter exchange with the surroundings. One can expect that if the oxygen abundances at the centre and at the optical radius (evolutionary stages at the centre and at the optical radius) are similar in two galaxies, then those galaxies have evolved in a more or less similar way. Then the central abundance – abundance at the optical radius diagram can be used to compare the evolution of the Milky Way and other spiral galaxies. Galaxies located close to the Milky Way on the (O/H)0–(O/H)R25 diagram are referred to as evolutionary Milky Way analogues (eMWAs). If a galaxy is simultaneously an sMWA and an eMWA, then such a galaxy can be considered a Milky Way twin candidate.
We defined the distance between the positions of a galaxy and the Milky Way in the R25–M⋆ diagram
![$$ \begin{aligned} D_{\rm MR} = [(\log R_{25} - \log R_{\rm 25,MW})^{2} + (\log M_{\star } - \log M_{\rm \star ,MW})^{2}]^{\frac{1}{2}}. \end{aligned} $$](/articles/aa/full_html/2023/08/aa46503-23/aa46503-23-eq14.gif)
The value of DMR is some kind of measure (index) of the structural difference between a galaxy and the Milky Way. We also defined the distance between the position of each galaxy and the Milky Way in the (O/H)R25–(O/H)0 diagram
![$$ \begin{aligned} D_{\rm OH} = [(Z_{0}-Z_{\rm 0,MW})^{2} + (Z_{R_{25}} - Z_{R_{25},\mathrm{MW}})^{2}]^{\frac{1}{2}}, \end{aligned} $$](/articles/aa/full_html/2023/08/aa46503-23/aa46503-23-eq15.gif)
where the notation Z = 12 + log(O/H) is used for the sake of brevity. The value of the DOH is some kind of measure (index) of the evolutionary difference between a galaxy and the Milky Way.
We plot the index of the structural difference between the galaxy and the Milky Way DMR as a function of the index of the evolutionary difference DOH for our sample of galaxies in panel a of Fig. 7. In this section, we select the Milky Way-like galaxies using a strict criteria for similarity. We adopted galaxies with DOH ≤ 0.1 as eMWAs and galaxies with DMR ≤ 0.1 as sMWAs. Panel b of Fig. 7 shows the (O/H)0–(O/H)R25 diagram. Panel c shows the R25–M⋆ diagram, and panel d shows the R25–Vrot diagram.
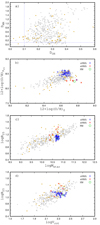 |
Fig. 7. Milky Way twin candidates according to the strict criteria. Panel a: index of the structural differences between galaxies and the Milky Way DMR (Eq. (10)) as a function of the index of the evolutionary difference DOH (Eq. (11)). The points are individual MaNGA (grey) and nearby (goldenrod) galaxies. The dashed lines indicate DMR = 0.1 and DOH = 0.1. Panel b: central oxygen abundance versus abundance at the optical radius. The galaxies with DOH ≤ 0.1 (eMWAs) are marked with red crosses. The galaxies with DMR < 0.1 (sMWAs) are indicated with blue plus signs. The green circle denotes the Milky Way. Panel c: optical radius versus stellar mass diagram. The notations are the same as in panel b. Panel d: optical radius versus rotation velocity diagram. The notations are the same as in panel b. |
Inspection of Fig. 7 shows that the eMWAs are rather rare, while the sMWAs are more numerous. This implies that the Milky Way shows a rather atypical (chemical) evolution. A prominent feature of the Milky Way is its high metallicity (oxygen abundance) at the centre of the disc, which is close to the maximum attainable oxygen abundances in galaxies, while the oxygen abundance at the optical radius is significantly lower in comparison to other galaxies of similar central oxygen abundances. We found that seven galaxies from our sample (six nearby galaxies, NGC 628, NGC 1232, NGC 3521, NGC 4303, NGC 6744, and IC 342, plus the MaNGA galaxy M-8934-12701) satisfy the condition DOH ≤ 0.1 and are hence considered eMWAs. The characteristics of nearby galaxies are listed in Table 2. The MaNGA galaxy M-8934-12701 is at a distance of 240.8 Mpc. The characteristics of M-8934-12701 are the following: the stellar mass is log M⋆ = 10.75; the rotation velocity is Vrot = 235 km s−1; the optical radius is R25 = 18.85 kpc; the central oxygen abundance is 12 + log(O/H)0 = 8.74; and the oxygen abundance at the optical radius is 12 + log(O/H)R25 = 8.28. Figure 3 shows the maps and radial distributions of the properties in the MaNGA galaxy M-8934-12701.
At the same time, we found that 35 galaxies from our sample satisfy the condition DRM ≤ 0.1. Close examination of Fig. 7 showed that six out of seven eMWAs are not sMWAs. The values of the stellar mass and rotation velocity in three eMWAs are relatively close to that in the Milky Way, but their optical radii are significantly larger in comparison to the optical radius of the Milky Way (R25 = 23.18 kpc in NGC 1232, R25 = 27.25 kpc in MGC 6744, and R25 = 18.85 in the MaNGA galaxy M-8934-12701 versus R25 = 12.0 in the Milky Way). Three other eMWAs have noticeably lower values of stellar mass (log M⋆ = 10.36 in NGC 628, log M⋆ = 10.51 in NGC 4303, and log M⋆ = 10.37 in IC 342 versus log M⋆ = 10.72 in the Milky Way) and rotation velocity (Vrot = 150 km s−1 in NGC 4303 and Vrot = 170 km s−1 in IC 342 versus Vrot = 235 km s−1 in the Milky Way). We note that in previous studies, Milky Way-like galaxies were selected using the structural and morphological characteristics of galaxies, that is, sMWAs were selected. We found that the abundances at the centre and at the optical radius (evolutionary characteristics) provide a more strict criterion for selecting real Milky Way twins.
We found that only the galaxy NGC 3521 is simultaneously both an sMWA and an eMWA. All the characteristics considered (stellar mass, optical radius, rotation velocity, central oxygen abundance, and abundance at the optical radius) of NGC 3521 are close to that of the Milky Way. The masses of black holes in those galaxies are also close to each other. Thus, the galaxy NGC 3521 can be a real Milky Way twin candidate. A detailed comparison of the galaxy NGC 3521 with the Milky Way is given in Sect. 4.4.
4.3. Searching for Milky Way twin candidates using weak criteria
Boardman et al. (2020b) noted that the selection of Milky Way analogues using a larger number of simultaneous selection parameters, as well as more stringent constraints on a given parameter, yields a sample of Milky Way-like galaxies with properties that are closer to the true properties of the Milky Way. At the same time, the use of a larger number of the selection criteria (or an overly strict definition of the “analogue”) yields few to no Milky Way-like galaxies (Boardman et al. 2020a). The fact that we found only one Milky Way candidate twin in the previous section can be the result of an overly strict definition of a Milky Way twin. In this section we search for Milky Way twins using a more weak (less strict) criteria.
The difference between the determined values of the parameter for two galaxies does not necessarily coincide with the real difference of the parameter for those galaxies, but it can also involve the uncertainty in the parameter determinations. Therefore, in the search for Milky Way twins, the uncertainty in the parameter determinations should be taken into account in the choice of the allowed difference. Unfortunately, the characteristics of many nearby galaxies can involve significant uncertainties, as noted in many papers. For instance, McQuinn et al. (2017) noted “surprisingly, many of the best-studied spiral galaxies in the Local Volume have distance uncertainties that are much larger than can be achieved with modern observation techniques”. The uncertainty in the distance to the galaxies results in uncertainties in the optical radius in kiloparsecs, as well as in the luminosity and consequently in the stellar mass. The uncertainty in the luminosity to stellar mass conversion also makes a significant (maybe dominant) contribution to the uncertainty in the estimation of the stellar mass of the galaxy.
We noted previously that for this current study, we selected our sample of MaNGA galaxies where radial oxygen abundance distribution could be approximated satisfactorily by a single linear relation. Belfiore et al. (2017) found that the galaxy inclination and the point spread function can generate a flattening in the radial abundance gradient in the MaNGA galaxies, since flux from different galactocentric radii is summed up when the galaxy is projected in the plane of the sky. The metallicity depletion at the galaxy centre depends on the PSF and galaxy inclination, and it can be as large as ∼0.04 dex.
It is difficult to specify the rotation of a galaxy with a single parameter because there is a wide variety of shapes in the rotation curves of galaxies. The rotation velocity of the flat part of the rotation curve Vflat is often used as the characteristic value for the galaxy rotation. However, there is not a commonly accepted way to determine Vflat. Even for galaxies with well measured rotation curves, the estimations of Vflat in different publications can differ by around 20 km s−1. For example, there are several measurements for the rotation curve of NGC 5055 (Thornley & Mundy 1997; Blais-Ouellette et al. 2004; de Blok et al. 2008). The estimations of the Vflat for NGC 5055 are Vflat = 192 km s−1 (Leroy et al. 2008), Vflat = 197 km s−1 (Frank et al. 2016), and Vflat = 179 km s−1 (Lelli et al. 2016).
In this section, we search for Milky Way twins using the following (weak) selection criteria: (1) The absolute value of the difference between the oxygen abundance at the centre of the galaxy and that for the Milky Way should be lower than 0.15 dex, Δ(O/H)0 (=abs(log(O/H)0 – log(O/H)0, MW)) ≤ 0.15. (2) The absolute value of the difference between the oxygen abundance at the optical radius of the galaxy and that for the Milky Way should be lower than 0.15 dex, Δ(O/H)R25 (=abs(log(O/H)R25 – log(O/H)R25,MW)) ≤ 0.15. (3) The optical radii of the galaxy and the Milky Way should agree within ∼30%, ΔR25 (=abs(log R25 – log R25, MW)) ≤ 0.114. (4) The difference between the stellar mass of the galaxy and that of the Milky Way should be less than a factor of approximately two, ΔM⋆ (=abs(log M⋆ – log M⋆, MW)) ≤ 0.3. (5) The rotation velocities of the galaxy and that of the Milky Way agree within ∼20%, ΔVrot (=abs(log Vrot – log Vrot, MW)) ≤ 0.079. The allowed differences of the parameters (criteria) that we adopted in the search for Milky Way twins are somewhat arbitrary.
All five parameters are available for 414 galaxies from our sample (the rotation curve is not determined for low-inclination galaxies). We found that 46 galaxies satisfy criteria 1 and 2. Those galaxies (eMWAs) are shown in Fig. 8 with red crosses. At the same time, only four out of 46 eMWAs (NGC 3521, NGC 4651, NGC 2903, and MaNGA galaxy M-8341-09101) satisfy criteria 3 through 5. Those galaxies (Milky Way twin candidates) are shown in Fig. 8 with blue plus signs.
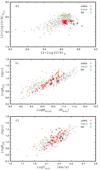 |
Fig. 8. Milky Way twin candidates according to the weak criteria. Panel a: central oxygen abundance versus abundance at the optical radius diagram. The grey points are individual MaNGA galaxies, and the goldenrod pints denote the nearby galaxies. The galaxies with Δ(O/H)0 ≤ 0.15 dex and Δ(O/H)R25 ≤ 0.15 dex (eMWAs) are marked with the red crosses. The eMWAs with ΔR25 ≤ 0.114 dex, ΔM⋆ ≤ 0.3 dex, and ΔVrot ≤ 0.079 dex (Milky Way twin candidates) are marked with the blue plus signs. The green circle denotes the Milky Way. Panel b: optical radius versus stellar mass diagram. The notations are the same as in panel a. Panel c: optical radius versus rotation velocity diagram. The notations are the same as in panel a. |
A comparison between Figs. 7 and 8 showed that the general behaviour of a sample of eMWAs selected with the weak criteria is similar to that of the sample of eMWAs selected with the strict criteria. Only a small fraction of the weak eMWAs (4 out of 46) are sMWAs. For the majority of eMWAs, either the optical radii is significantly larger in comparison to the optical radius of the Milky Way or the stellar mass (and/or rotation velocity) is significantly lower than that of the Milky Way.
4.4. Abundance distributions and rotation curves of the Milky Way twin candidates
In this section, we compare the radial abundance distributions and rotation curves of the Milky Way twin candidates (NGC 3521, NGC 4651, NGC 2903, and MaNGA galaxy M-8341-09101) with that of the Milky Way. Zhou et al. (2023) found that the MaNGA galaxy M-8983-03703 is a Milky Way-like galaxy in the context of their star formation and chemical evolution histories. Hence, this galaxy is also considered here.
4.4.1. NGC 3521
The galaxy NGC 3521 is an SABb galaxy (morphological type code T = 4.0 ± 0.2). It is included in The H I Nearby Galaxy Survey (THINGS) list (Walter et al. 2008). We adopted the following parameters of NGC 3521 used or obtained by the THINGS survey: distance d = 10.7 Mpc; optical radius of 4.16 arcmin; physical optical radius R25 = 12.94 kpc (Walter et al. 2008); inclination angle i = 73°; position angle of the major axis PA = 340° (de Blok et al. 2008); stellar mass M⋆ = 5.01 × 10¹⁰ M⊙, or log(M⋆/M⊙) = 10.70 (Leroy et al. 2008); and rotation velocity Vrot = 227 km s−1 (de Blok et al. 2008; Leroy et al. 2008). The black hole mass in NGC 3521 is log(MBH/M⊙) = 6.85 ± 0.58 (Davis et al. 2014).
The measurements of the emission lines, which are necessary for the determination of the abundance through the R calibration, are available for only three H II regions in the NGC 3521 (Bresolin et al. 1999). However, NGC 3521 was taken into consideration for two reasons: First, McGaugh (2016) noted that NGC 3521 is the closest structural analogue to the Milky Way, having a similar luminosity, scale length, and rotation curve. Second, the measurements of the emission lines R2 and R3, which allow for estimation of the abundance through the P calibration, are available for ten H II regions in NGC 3521 (Zaritsky et al. 1994). The oxygen abundances determined through the R calibration in three H II regions from Bresolin et al. (1999) are denoted with the triangles in panel a of Fig. 9. In order to estimate the oxygen abundances using the oxygen lines R2 and R3 measured by Zaritsky et al. (1994) in ten H II regions in NGC 3521, we obtained the calibration relation (O/H)P = f(R2, R3) for the upper branch (Pilyugin 2001; Pilyugin & Thuan 2005) using the calibration data points from Pilyugin & Grebel (2016) and supplemented by the recent measurements of H II regions in NGC 5457 from Croxall et al. (2016) and Esteban et al. (2020)
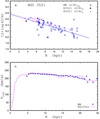 |
Fig. 9. Comparison between the properties of NGC 3521 and the Milky Way. Panel a: comparison between the radial oxygen abundance distributions. The blue circles denote the Te-based abundances in individual H II regions in the Milky Way (comes from panel b of Fig. 2), and the solid line is the best fit to those data. The dark triangles mark the R calibration-based abundances in H II regions in NGC 3521. The crimson plus signs are the P calibration-based abundances in H II regions in NGC 3521, and the dotted line is the linear fit to those data points. Panel b: comparison between rotation curves. The points denote the rotation curve of the Milky Way from Eilers et al. (2019). The line shows the rotation curve of the NGC 3521 from de Blok et al. (2008). |
where P = R3/R23 is the excitation parameter, R23 = R3 + R3, and X = log(1 + R23). The oxygen abundances determined through the P calibration in H II regions from Zaritsky et al. (1994) are shown with plus signs in panel a of Fig. 9. The radial distribution of those oxygen abundances was approximated by the relation

with a scatter of 0.042 dex for the 10 data points.
Thus, the values of the optical radii of NGC 3521 (R25 = 12.9 kpc) and the Milky Way (R25 = 12.0 kpc) are close to each other. The value of the stellar mass of the NGC 3521 (log(M⋆/M⊙) = 10.7) is close to the value of the stellar mass of the Milky Way (log(M⋆/M⊙) = 10.716). The mass of the black hole at the centre of NGC 3521 (log(MBH/M⊙) = 6.85) is close to that in the Milky Way (log(MBH/M⊙) = 6.62). The radial distributions of the oxygen abundances (panel a of Fig. 9) and rotation curves (panel b of Fig. 9) in those galaxies agree satisfactorily with each other. However, in order to make a solid conclusion as to whether the galaxy NGC 3521 is a twin of the Milky Way, the radial distribution of the R calibration-based abundances in NGC 3521 should be established, that is, the measurements of the spectra including emission lines necessary for abundance determinations through the R calibration should be carried out. The distance to NGC 3521 and its optical radius should also be more precise.
4.4.2. NGC 4651
The galaxy NGC 4651 is an Sc galaxy (morphological type code T = 5.1 ± 0.6). The inclination angle of NGC 4651 is i = 53°, and the position angle of the major axis is PA = 77° (Epinat et al. 2008). The optical radius is 1.99 arcmin (de Vaucouleurs et al. 1991). At the distance of d = 19.0 Mpc (Foster et al. 2014), the physical optical radius is R25 = 11.00 kpc. The stellar mass is M⋆ = 2.61 × 10¹⁰ M⊙, or log(M⋆/M⊙) = 10.42 (Leroy et al. 2019) or M⋆ = 1.7 × 10¹⁰ M⊙ or log(M⋆/M⊙) = 10.23 (Foster et al. 2014). The rotation velocity of NGC 4651 is 215 km s−1 (Epinat et al. 2008).
The radial distribution of the oxygen abundances estimated through the R calibration in H II regions from Skillman et al. (1996) was approximated by the relation

with a scatter of 0.039 dex for the six data points (panel a in Fig. 10).
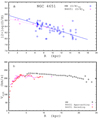 |
Fig. 10. Comparison of properties between NGC 4651 and the Milky Way. Panel a: comparison between radial oxygen abundance distributions. The blue circles denote the Te-based abundances in individual H II regions in the Milky Way (comes from panel b of Fig. 2), and the solid line is the best fit to those data. The crimson plus signs are the R calibration-based abundances in H II regions in NGC 4651, and the dotted line is the linear fit to those data points. Panel b: comparison between rotation curves. The points denote the rotation curve of the Milky Way from Eilers et al. (2019). The rotation curve of NGC 4651 from Epinat et al. (2008) is shown with plus signs (approaching side) and crosses (receding side). |
The values of the optical radii of NGC 4651 (R25 = 11.0 kpc) and the Milky Way (R25 = 12.0 kpc) are close to each other. The radial distributions of the oxygen abundances (panel a of Fig. 10) and the rotation curves (panel b of Fig. 10) in those galaxies agree satisfactorily to each other. While the rotation velocity of NGC 4651 is rather close to that of the Milky Way, the value of the stellar mass of NGC 4651 (log(M⋆/M⊙) = 10.42) is appreciably lower (by a factor of approximately two, or even more) than the stellar mass of the Milky Way (log(M⋆/M⊙) = 10.716). If the estimations of the stellar mass of NGC 4651 are correct, then NGC 4651 can be considered a low(-stellar) mass evolutionary analogue of the Milky Way.
4.4.3. NGC 2903
The galaxy NGC 2903 is an Sbc spiral galaxy (morphological type code T = 4.0 ± 0.1). Its inclination angle is i = 65°, and the position angle of the major axis is PA = 204° (de Blok et al. 2008). The optical radius of NGC 2903 is R25 = 5.87 arcmin (Walter et al. 2008). The distance to NGC 2903 is d = 8.9 Mpc (Drozdovsky & Karachentsev 2000), and it results in a physical optical radius of R25 = 15.21 kpc. The stellar mass of NGC 2903 based on the mean value from Jarrett et al. (2019) and Leroy et al. (2021) and rescaled to the adopted distance is M⋆ = 3.33 × 10¹⁰ M⊙, or log(M⋆/M⊙) = 10.52. The mass of the black hole in NGC 2903 is log(MBH/M⊙) = 7.06 (van den Bosch 2016). The rotation velocity of NGC 2903 is 215 km s−1 (de Blok et al. 2008).
The abundance gradient traced by the R calibration-based abundances in the H II regions from the compilation in Pilyugin et al. (2014) is

with a scatter of 0.047 dex for the 25 data points.
The values of the optical radii of NGC 2903 (R25 = 15.21 kpc) and the Milky Way (R25 = 12.0 kpc) are close to each other, and the rotation curves (panel b of Fig. 11) in those galaxies agree satisfactorily to each other. However, the value of the stellar mass of NGC 2903 (log(M⋆/M⊙) = 10.52) is appreciably lower than the stellar mass of the Milky Way (log(M⋆/M⊙) = 10.716). There is also an appreciable difference between the radial distributions of the oxygen abundances (panel a of Fig. 11) in the galaxies. Thus, NGC 2903 is a Milky Way twin only to some extent.
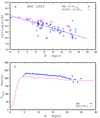 |
Fig. 11. Comparison of properties between NGC 2903 and the Milky Way. Panel a: comparison between radial oxygen abundance distributions. The blue circles denote the Te-based abundances in individual H II regions in the Milky Way (comes from panel b of Fig. 2), and the solid line is the best fit to those data. The crimson plus signs are the R calibration-based abundances in H II regions of NGC 2903, and the dotted line is the linear fit to those data points. Panel b: comparison between rotation curves. The points denote the rotation curve of the Milky Way from Eilers et al. (2019). The rotation curve of NGC 2903 from de Blok et al. (2008) is shown with the line. |
4.4.4. MaNGA galaxy M-8341-09101
The distance to the MaNGA galaxy M-8341-09101 is 216.3 Mpc. The central oxygen abundance in M-8341-09101 is 12 + log(O/H)0 = 8.63, and the oxygen abundance at the optical radius is 12 + log(O/H)R25 = 8.33. The comparison of the radial distribution of the oxygen abundances in the galaxy M-8341-09101 and in the Milky Way is shown in panel a of Fig. 12. One can see that the difference between the radial distribution of the oxygen abundances in the two galaxies is significant.
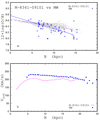 |
Fig. 12. Comparison between the properties of the MaNGA galaxy M-8341-09101 and the Milky Way. Panel a: comparison between the radial oxygen abundance distributions. The blue circles denote the Te-based abundances in individual H II regions in the MW (comes from panel b of Fig. 2) and the solid line is the best fit to those data. The grey points are the R calibration-based abundances in the spaxels of M-8341-09101 and the dashed line is the linear fit to those data points. Panel b: comparison between rotation curves. The points denote the rotation curve of the Milky Way from Eilers et al. (2019). The rotation curve of M-8341-09101 is shown by the line. |
The optical radius of M-8341-09101 (R25 = 13.3 kpc) is close to the radius of the Milky Way (R25 = 12.0 kpc). The stellar mass of M-8341-09101 (log(M⋆/M⊙) = 10.75) is close to that of the Milky Way (log(M⋆/M⊙) = 10.716). The comparison between the rotation curves in M-8341-09101 and the Milky Way is shown in panel b of Fig. 12. Comparison between Figs. 11 and 12 suggested that the properties (rotation curve and the radial abundance distribution) of the galaxy M-8341-09101 and NGC 2903 are close to each other, that is, the galaxy M-8341-09101 is more similar to NGC 2903 than to the Milky Way.
4.4.5. MaNGA galaxy M-8983-03703
Zhou et al. (2023) found that the MaNGA galaxy M-8983-03703 is a Milky Way-like galaxy in the context of their star formation and chemical evolution histories. Figure 13 shows the comparison between the radial oxygen abundance distributions in the MaNGA galaxy M-8983-03703 and the Milky Way. The field-of-view of M-8983-03703 measurement covers the central part of the galaxy only. There is another MaNGA measurement (M-7495-12704) of this galaxy that covers a much larger fraction of the galaxy. The radial oxygen abundance distribution obtained from M-7495-12704 is also shown in Fig. 13. One can see that the difference between the radial distributions of the oxygen abundances in M-8983-03703 (and M-7495-12704) and in the Milky Way is very large. Hence M-8983-03703 cannot be considered as Milky Way twin candidate.
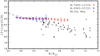 |
Fig. 13. Comparison between the radial oxygen abundance distributions in the MaNGA galaxy M-8983-03703 and the Milky Way. The blue squares are the median values of O/H in bins of 0.05 in the fractional radius R/R25 of M-8983-03703, and the bars show the scatter in O/H around the median values of the bins. The red circles are abundances estimated from other MaNGA measurements (M-7495-12704) of this galaxy. The median values of the oxygen abundances for different measurements were obtained for the same bin, but the positions of the symbols (circles and squares) were shifted slightly along the x-axis for the sake of clarity. The black crosses denote the Te-based abundances of individual H II regions in the Milky Way, while the solid line is the best fit to those data within the optical radius. |
5. Discussion
We found that the position of the Milky Way in the central abundance versus the abundance at optical radius diagram, Fig. 7, shows a significant shift from the general trend. A prominent feature of the Milky Way is a high metallicity (oxygen abundance) at the centre of the disc, which is close to the maximum attainable oxygen abundance in galaxies, while the oxygen abundance at the optical radius is significantly lower in comparison to galaxies of similar central oxygen abundances, that is, the radial abundance gradient (in dex/R25) in the Milky Way is significantly steeper than in other galaxies of similar (high) central metallicity. This evidences in favour of a rather atypical (chemical) evolution of the Milky Way. In this section, we discuss a possible reason for the atypical radial abundance gradient in the Milky Way.
The chemical evolution of a given region of a galaxy is defined by the star formation history and mass exchange with its surroundings. In the standard Λ cold dark matter (ΛCDM) scenario, successive mergings are considered one of the main mechanisms for assembling mass in galaxies (White & Rees 1978; Blumenthal et al. 1984). Galaxy-galaxy interactions and mergers can have a significant effect on galaxy evolution, altering different characteristics of a galaxy. In particular, the gas inflows are predicted to lead to a redistribution of metals, reducing the central gas-phase metallicity and producing an overall flatter abundance gradient (Rupke et al. 2010a; Sillero et al. 2017; Bustamante et al. 2018). These predictions are in agreement with observational data. Measurements of central metallicities of interacting galaxies and galaxy pairs confirm that they have lower central metallicities than isolated galaxies of similar stellar mass (e.g. Rupke et al. 2008; Ellison et al. 2008; Garduño et al. 2021). However, Barrera-Ballesteros et al. (2015) found central oxygen abundances in a sample of interacting galaxies similar to those in a control sample. It has been found (Rupke et al. 2010b; Kewley et al. 2010; Rosa et al. 2014; Croxall et al. 2015; Torres-Flores et al. 2020) that merging and interacting systems exhibit shallow oxygen abundance gradients compared to isolated spiral galaxies. Boardman et al. (2022, 2023) concluded that galaxies that have experienced smooth gas accretion histories produce negative metallicity gradients over time and that the increased merging activity disrupts this process, leading to flatter metallicity gradients. One could suggest that the lack of mergers and interactions is a necessary condition for a galaxy to have a high abundance at the centre and a steep radial abundance gradient. In such a case, the high central metallicity and steep gradient in the Milky Way would be evidence that the Milky Way has evolved without mergers and interactions.
Empirical investigations of the merger history of the Milky Way have been carried out in the past decades. The Sagittarius (Ibata et al. 1994) and Cetus mergers (Newberg et al. 2009) were discovered. Large stellar surveys, such as Gaia (Gaia Collaboration 2016, 2018, 2021) and the Apache Point Observatory Galactic Evolution Experiment, which is one of the programmes in the SDSS (Majewski et al. 2017; Abdurro’uf et al. 2022), have provided homogeneous astrometric, photometric, and spectroscopic data sampling for a large amount of stars in the Milky Way. This has allowed for the detection and characterisation of substructures in the Milky Way that are remnants of the progenitor galaxies that merged with the Milky Way and contributed to its stellar population. Hence, it has become increasingly possible to investigate the merging history of the Milky Way in great detail. Belokurov et al. (2018) and Helmi et al. (2018) argue that the inner halo is dominated by debris from a major accretion event that occurred between 8 and 11 Gyr ago. A captured galaxy was slightly more massive than the Small Magellanic Cloud. This object is referred to as the Gaia-Enceladus-Sausage. Several other merger galaxies have been discovered: Thamnos (Koppelman et al. 2019), Sequoia (Myeong et al. 2019), Kraken (Kruijssen et al. 2019, 2020), and Pontus (Malhan et al. 2022). The Gaia-Enceladus-Sausage is the most recent major merger (Borre et al. 2022; Dropulic et al. 2023). Since this event, the Milky Way has evolved without significant mergers for the last ∼10 Gyr and, consequently, one can expect that the redistribution of metals does not take place in the Milky Way disc. Thus, the Milky Way meets the necessary conditions (i.e. lack of the mergers and interactions) in order to have a high abundance at its centre and a steep radial abundance gradient. The presence of close satellites (Magellanic Clouds) may appear to be in conflict with this picture. However, van den Bergh (2006) argues that the Large and Small Magellanic Clouds may be interlopers from a remote part of the Local Group rather than true satellites of the Milky Way (i.e. the Large Magellanic Cloud is on its first approach to the Milky Way).
Close examination of Fig. 7 shows that among galaxies with central oxygen abundances close to the Milky Way, the radial abundance gradients (in terms of dex/R25, difference between the oxygen abundance at the optical radius and at the centre) for two galaxies in our sample exceed the radial abundance gradient of the Milky Way. Those galaxies are NGC 6744, with 12 + log(O/H)0 = 8.84 and 12 + log(O/H)R25 = 8.20 and consequently grad(O/H) = −0.64 dex/R25, and NGC 5457 (M 101), with 12 + log(O/H)0 = 8.71 and 12 + log(O/H)R25 = 7.87 and consequently grad(O/H) = −0.84 dex/R25. These galaxies are huge compared to the Milky Way, as the optical radius of NGC 6744 is R25 = 27.25 kpc, while the optical radius of NGC 5457 is R25 = 28.73 kpc. The stellar masses of NGC 5457 (3.81 × 10¹⁰ M⊙) and NGC 6744 (5.92 × 10¹⁰ M⊙) are slightly lower or similar to that of the Milky Way (5.2 × 10¹⁰ M⊙). It should be emphasised that it is not necessary for a large galaxy to show a steep radial abundance gradient. Indeed, the galaxy NGC 753 of radius R25 = 26.45 kpc shows a radial gradient of −0.12 dex/R25, and the galaxy NGC 1365 of radius R25 = 31.98 kpc shows a radial abundance gradient of −0.21 dex/R25. The stellar masses of NGC 753 (8.13 × 10¹⁰ M⊙) and NGC 1365 (6.0 × 10¹⁰ M⊙) are slightly higher or similar to that of the Milky Way.
One can expect that the shallow gradients in the majority of large galaxies can be attributed to the fact that the abundances within those galaxies are redistributed due to the mergers or interactions. Robotham et al. (2014) used a subset of the Galaxy And Mass Assembly II redshift sample to compare the effect of in situ star formation versus mass accretion through mergers and found that galaxies of low masses are likely to obtain most of their mass through star formation, whilst massive galaxies are likely to obtain most of their mass build-up through the accretion of smaller galaxies. Conselice et al. (2022) measured the pair fraction and merger fractions for galaxy mergers of different mass ratios and quantified the merger rate for massive galaxies (with stellar masses higher than 1011 M⊙). They found that over the last ∼10 Gyr, major mergers with mass ratios greater than 1:4 occurred 0.85 times on average, while minor mergers down to ratios of 1:10 occurred on average 1.43
 times per galaxy.
Thus, one can suggest that the steep radial abundance gradient in the Milky Way can be attributed to the fact that the Milky Way has evolved without significant mergers and interactions for the last ∼10 Gyr. However, it is not clear whether the evolution without mergers and interactions is a sufficient condition for a steep abundance gradient in a galaxy.
6. Conclusions
We searched for Milky Way-like galaxies, comparing the following characteristics: stellar mass M⋆, optical radius R25, rotation velocity Vrot, central oxygen abundance (O/H)0, and abundance at the optical radius (O/H)R25. Our sample of comparison galaxies contained 504 galaxies: 53 nearby galaxies and 451 MaNGA galaxies.
If the values of the optical radius and the stellar mass of the galaxy were close to that of the Milky Way, then the galaxy was referred to as a structural Milky Way analogue, sMWA. The oxygen abundance at a given radius of a galaxy is defined by the evolution of this region (fraction of gas converted into stars, i.e. astration level, and gas exchange with the surroundings). One can expect that the similarity of the central oxygen abundance and the abundance at the optical radius in two galaxies suggests a similar (chemical) evolution. If the values of (O/H)0 and (O/H)R25 in a galaxy were close to that of the Milky Way, then the galaxy was referred to as an evolutionary Milky Way analogue, eMWA. If the galaxy was simultaneously an eMWA and an sMWA, then it could be considered a Milky Way twin.
We find that the position of the Milky Way on the (O/H)0–(O/H)R25 diagram shows a large deviation from the general trend outlined by galaxies of our comparison sample in the sense that the (O/H)R25 of the Milky Way is appreciably lower than in other galaxies of similar (O/H)0. This feature in the Milky Way evidences that its (chemical) evolution is not typical.
The majority of the eMWAs are not sMWAs. Either the optical radii of the eMWAs are significantly larger in comparison to the Milky Way or the eMWAs have appreciably lower values of stellar mass and rotation velocity than the Milky Way.
We found four galaxies (NGC 3521, NGC 4651, NGC 2903, and MaNGA galaxy M-8341-09101) that are simultaneously an sMWA and an eMWA, that is, they can be considered Milky Way twins. The galaxy NGC 3521 is possibly the most similar to the Milky Way. The characteristics we considered (stellar mass, optical radius, rotation velocity, oxygen abundance) of NGC 3521 are similar to those of the Milky Way. The masses of black holes in those galaxies are also similar to each other.
In previous studies, Milky Way-like galaxies were selected using structural and morphological characteristics of galaxies, that is, sMWAs were selected. We find that the abundances at the centre and at the optical radius (evolutionary characteristics) provide a stricter criterion for selecting real Milky Way twins.
The NASA/IPAC Extragalactic Database is operated by the Jet Propulsion Laboratory, California Institute of Technology, under contract with the National Aeronautics and Space Administration, http://ned.ipac.caltech.edu/
Acknowledgments
We are grateful to the referee, Dr. N. Boardman, for his constructive comments. L.S.P. acknowledges support from the Research Council of Lithuania (LMTLT), grant no. P-LU-PAR-23-28. M.A.L.L. acknowledges support from the Spanish grant PID2021-123417OB-I00, and the Ramón y Cajal program funded by the Spanish Government (RYC2020-029354-I) This research has made use of the NASA/IPAC Extragalactic Database (NED), which is funded by the National Aeronautics and Space Administration and operated by the California Institute of Technology. We acknowledge the usage of the HyperLeda database (http://leda.univ-lyon1.fr). Funding for SDSS-III has been provided by the Alfred P. Sloan Foundation, the Participating Institutions, the National Science Foundation, and the US Department of Energy Office of Science. The SDSS-III website is http://www.sdss3.org/. Funding for the Sloan Digital Sky Survey IV has been provided by the Alfred P. Sloan Foundation, the US Department of Energy Office of Science, and the Participating Institutions. SDSS-IV acknowledges support and resources from the Center for High-Performance Computing at the University of Utah. The SDSS website is www.sdss.org. SDSS-IV is managed by the Astrophysical Research Consortium for the Participating Institutions of the SDSS Collaboration including the Brazilian Participation Group, the Carnegie Institution for Science, Carnegie Mellon University, the Chilean Participation Group, the French Participation Group, Harvard-Smithsonian Center for Astrophysics, Instituto de Astrofísica de Canarias, The Johns Hopkins University, Kavli Institute for the Physics and Mathematics of the Universe (IPMU)/University of Tokyo, Lawrence Berkeley National Laboratory, Leibniz Institut für Astrophysik Potsdam (AIP), Max-Planck-Institut für Astronomie (MPIA Heidelberg), Max-Planck-Institut für Astrophysik (MPA Garching), Max-Planck-Institut für Extraterrestrische Physik (MPE), National Astronomical Observatories of China, New Mexico State University, New York University, University of Notre Dame, Observatário Nacional/MCTI, The Ohio State University, Pennsylvania State University, Shanghai Astronomical Observatory, United Kingdom Participation Group, Universidad Nacional Autónoma de México, University of Arizona, University of Colorado Boulder, University of Oxford, University of Portsmouth, University of Utah, University of Virginia, University of Washington, University of Wisconsin, Vanderbilt University, and Yale University.
References
- Abazajian, K. N., Adelman-McCarthy, J. K., Agüeros, M. A., et al. 2009, ApJS, 182, 543 [Google Scholar]
- Abdurro’uf, Accetta, K., Aerts, C., et al. 2022, ApJS, 259, 35 [NASA ADS] [CrossRef] [Google Scholar]
- Ablimit, I., Zhao, G., Flynn, C., & Bird, S. A. 2020, ApJ, 895, L12 [Google Scholar]
- Aihara, H., Allende, Prieto C., An, D., et al. 2011, ApJS, 193, 29 [NASA ADS] [CrossRef] [Google Scholar]
- Albareti, F. D., Allende, Prieto C., Almeida, A., et al. 2017, ApJS, 233, 25 [Google Scholar]
- Amôres, E. B., Robin, A. C., & Reylé, C. 2017, A&A, 602, A67 [NASA ADS] [CrossRef] [EDP Sciences] [Google Scholar]
- Amorín, R., Aguerri, J. A. L., Muñoz-Tuñón, C., & Cairós, L. M. 2009, A&A, 501, 75 [NASA ADS] [CrossRef] [EDP Sciences] [Google Scholar]
- Amram, P., Le Coarer, E., Marcelin, M., et al. 1992, A&AS, 94, 175 [NASA ADS] [Google Scholar]
- Amram, P., Marcelin, M., Balkowski, C., et al. 1994, A&AS, 103, 5 [NASA ADS] [Google Scholar]
- Anand, G. S., Lee, J. C., Van Dyk, S. D., et al. 2021, MNRAS, 501, 3621 [Google Scholar]
- Arellano-Córdova, K. Z., Rodríguez, M., Mayya, Y. D., & Rosa-González, D. 2016, MNRAS, 455, 2627 [CrossRef] [Google Scholar]
- Arellano-Córdova, K. Z., Esteban, C., García-Rojas, J., & Méndez-Delgado, J. E. 2020, MNRAS, 496, 1051 [Google Scholar]
- Arellano-Córdova, K. Z., Esteban, C., García-Rojas, J., & Méndez-Delgado, J. E. 2021, MNRAS, 502, 225 [CrossRef] [Google Scholar]
- Baldwin, J. A., Phillips, M. M., & Terlevich, R. 1981, PASP, 93, 5 [Google Scholar]
- Barrera-Ballesteros, J. K., Sánchez, S. F., García-Lorenzo, B., et al. 2015, A&A, 579, A45 [NASA ADS] [CrossRef] [EDP Sciences] [Google Scholar]
- Belfiore, F., Maiolino, R., Tremonti, C., et al. 2017, MNRAS, 469, 151 [Google Scholar]
- Belokurov, V., Erkal, D., Evans, N. W., Koposov, S. E., & Deason, A. J. 2018, MNRAS, 478, 611 [Google Scholar]
- Berg, D. A., Skillman, E. D., Croxall, K. V., et al. 2015, ApJ, 806, 16 [NASA ADS] [CrossRef] [Google Scholar]
- Berg, D. A., Pogge, R. W., Skillman, E. D., et al. 2020, ApJ, 893, 96 [NASA ADS] [CrossRef] [Google Scholar]
- Blais-Ouellette, S., Amram, P., Carignan, C., & Swaters, R. 2004, A&A, 420, 147 [NASA ADS] [CrossRef] [EDP Sciences] [Google Scholar]
- Bland-Hawthorn, J., & Gerhard, O. 2016, ARA&A, 54, 529 [Google Scholar]
- Blumenthal, G. R., Faber, S. M., Primack, J. R., & Rees, M. J. 1984, Nature, 311, 517 [Google Scholar]
- Boardman, N., Zasowski, G., Newman, J. A., et al. 2020a, MNRAS, 498, 4943 [NASA ADS] [CrossRef] [Google Scholar]
- Boardman, N., Zasowski, G., Seth, A., et al. 2020b, MNRAS, 491, 3672 [NASA ADS] [CrossRef] [Google Scholar]
- Boardman, N., Zasowski, G., Newman, J. A., et al. 2022, MNRAS, 514, 2298 [NASA ADS] [CrossRef] [Google Scholar]
- Boardman, N., Wild, V., Heckman, T., et al. 2023, MNRAS, 520, 4301 [NASA ADS] [CrossRef] [Google Scholar]
- Bono, G., Caputo, F., Marconi, M., & Musella, I. 2010, ApJ, 715, 277 [Google Scholar]
- Borre, C. C., Aguirre, Børsen-Koch V., Helmi, A., et al. 2022, MNRAS, 514, 2527 [NASA ADS] [CrossRef] [Google Scholar]
- Bose, S., & Kumar, B. 2014, ApJ, 782, 98 [NASA ADS] [CrossRef] [Google Scholar]
- Bovy, J., & Rix, H.-W. 2013, ApJ, 779, 115 [Google Scholar]
- Bresolin, F. 2019, MNRAS, 488, 3826 [NASA ADS] [Google Scholar]
- Bresolin, F., Kennicutt, R. C., & Garnett, D. R. 1999, ApJ, 510, 104 [NASA ADS] [CrossRef] [Google Scholar]
- Bresolin, F., Kennicutt, R. C., & Ryan-Weber, E. 2012, ApJ, 750, 122 [NASA ADS] [CrossRef] [Google Scholar]
- Bruzual, G., & Charlot, S. 2003, MNRAS, 344, 1000 [NASA ADS] [CrossRef] [Google Scholar]
- Bundy, K., Bershady, M. A., Law, D. R., et al. 2015, ApJ, 798, 7 [Google Scholar]
- Burton, W. B., & Gordon, M. A. 1978, A&A, 63, 7 [NASA ADS] [Google Scholar]
- Bustamante, S., Sparre, M., Springel, V., & Grand, R. J. J. 2018, MNRAS, 479, 3381 [Google Scholar]
- Cardelli, J. A., Clayton, G. C., & Mathis, J. S. 1989, ApJ, 345, 245 [Google Scholar]
- Carignan, C. 1985, ApJS, 58, 107 [Google Scholar]
- Carignan, C., & Puche, D. 1990, AJ, 100, 394 [NASA ADS] [CrossRef] [Google Scholar]
- Cautun, M., Benítez-Llambay, A., Deason, A. J., et al. 2020, MNRAS, 494, 4291 [Google Scholar]
- Chen, Y.-M., Kauffmann, G., Tremonti, C. A., et al. 2012, MNRAS, 421, 314 [NASA ADS] [Google Scholar]
- Chrobáková, Ž., Nagy, R., & López-Corredoira, M. 2020, A&A, 637, A96 [NASA ADS] [CrossRef] [EDP Sciences] [Google Scholar]
- Cid, Fernandes R., Stasińska, G., Schlickmann, M. S., et al. 2010, MNRAS, 403, 1036 [NASA ADS] [CrossRef] [Google Scholar]
- Colombo, D., Meidt, S. E., Schinnerer, E., et al. 2014, ApJ, 784, 4 [Google Scholar]
- Conselice, C. J., Mundy, C. J., Ferreira, L., & Duncan, K. 2022, ApJ, 940, 168 [CrossRef] [Google Scholar]
- Corbelli, E., Lorenzoni, S., Walterbos, R., Braun, R., & Thilker, D. 2010, A&A, 511, A89 [NASA ADS] [CrossRef] [EDP Sciences] [Google Scholar]
- Crosthwaite, L. P., Turner, J. L., & Ho, P. T. P. 2000, AJ, 119, 1720 [CrossRef] [Google Scholar]
- Croxall, K. V., Pogge, R. W., Berg, D. A., Skillman, E. D., & Moustakas, J. 2015, ApJ, 808, 42 [NASA ADS] [CrossRef] [Google Scholar]
- Croxall, K. V., Pogge, R. W., Berg, D. A., Skillman, E. D., & Moustakas, J. 2016, ApJ, 830, 4 [NASA ADS] [CrossRef] [Google Scholar]
- Das, M., McGaugh, S. S., Ianjamasimanana, R., Schombert, J., & Dwarakanath, K. S. 2020, ApJ, 889, 10 [Google Scholar]
- Davis, B. L., Berrier, J. C., Johns, L., et al. 2014, ApJ, 789, 124 [NASA ADS] [CrossRef] [Google Scholar]
- Davis, B. L., Graham, A. W., & Combes, F. 2019, ApJ, 877, 64 [NASA ADS] [CrossRef] [Google Scholar]
- Dawson, K. S., Schlegel, D. J., Ahn, C. P., et al. 2013, AJ, 145, 10 [Google Scholar]
- de Blok, W. J. G., Walter, F., Brinks, E., et al. 2008, AJ, 136, 2648 [NASA ADS] [CrossRef] [Google Scholar]
- de Vaucouleurs, G., & Pence, W. D. 1978, AJ, 83, 1163 [CrossRef] [Google Scholar]
- de Vaucouleurs, G., de Vaucouleurs, A., Corvin, H. G., et al. 1991, Third Reference Catalog of Bright Galaxies (New York: Springer-Verlag) [Google Scholar]
- Dropulic, A., Liu, H., Ostdiek, B., & Lisanti, M. 2023, MNRAS, 521, 1633 [NASA ADS] [CrossRef] [Google Scholar]
- Drozdovsky, I. O., & Karachentsev, I. D. 2000, A&AS, 142, 425 [NASA ADS] [CrossRef] [EDP Sciences] [Google Scholar]
- Eilers, A.-C., Hogg, D. W., Rix, H.-W., & Ness, M. K. 2019, ApJ, 871, 120 [Google Scholar]
- Ellison, S. L., Patton, D. R., Simard, L., & McConnachie, A. W. 2008, AJ, 135, 1877 [NASA ADS] [CrossRef] [Google Scholar]
- Epinat, B., Amram, P., Marcelin, M., et al. 2008, MNRAS, 388, 500 [Google Scholar]
- Erroz-Ferrer, S., Knapen, J. H., & Leaman, R. 2015, MNRAS, 451, 1004 [NASA ADS] [CrossRef] [Google Scholar]
- Esteban, C., Fang, X., García-Rojas, J., & Toribio San Cipriano, L. 2017, MNRAS, 471, 987 [NASA ADS] [CrossRef] [Google Scholar]
- Esteban, C., Bresolin, F., García-Rojas, J., & Toribio San Cipriano, L. 2020, MNRAS, 491, 2137 [NASA ADS] [Google Scholar]
- Ferguson, A. M. N., Gallagher, J. S., & Wyse, R. F. G. 1998, AJ, 116, 673 [NASA ADS] [CrossRef] [Google Scholar]
- Fielder, C., Newman, J. A., Andrews, B. H., et al. 2021, MNRAS, 508, 4459 [CrossRef] [Google Scholar]
- Flynn, C., Holmberg, J., Portinari, L., Fuchs, B., & Jahreiß, H. 2006, MNRAS, 372, 1149 [NASA ADS] [CrossRef] [Google Scholar]
- Foster, C., Lux, H., Romanowsky, A. J., et al. 2014, MNRAS, 442, 3544 [NASA ADS] [CrossRef] [Google Scholar]
- Frank, B. S., de Blok, W. J. G., Walter, F., Leroy, A., & Carignan, C. 2016, AJ, 151, 94 [NASA ADS] [CrossRef] [Google Scholar]
- Fraser-McKelvie, A., Merrifield, M., & Aragón-Salamanca, A. 2019, MNRAS, 489, 5030 [CrossRef] [Google Scholar]
- Gaia Collaboration (Brown, A. G. A., et al.) 2016, A&A, 595, A2 [NASA ADS] [CrossRef] [EDP Sciences] [Google Scholar]
- Gaia Collaboration (Brown, A. G. A., et al.) 2018, A&A, 616, A1 [NASA ADS] [CrossRef] [EDP Sciences] [Google Scholar]
- Gaia Collaboration (Brown, A. G. A., et al.) 2021, A&A, 649, A1 [NASA ADS] [CrossRef] [EDP Sciences] [Google Scholar]
- García-Gómez, C., Barberà, C., Athanassoula, E., Bosma, A., & Whyte, L. 2004, A&A, 421, 595 [NASA ADS] [CrossRef] [EDP Sciences] [Google Scholar]
- Garduño, L. E., Lara-López, M. A., López-Cruz, O., et al. 2021, MNRAS, 501, 2969 [CrossRef] [Google Scholar]
- Goddard, Q. E., Bresolin, F., Kennicutt, R. C., Ryan-Weber, E. V., & Rosales-Ortega, F. F. 2011, MNRAS, 412, 1246 [NASA ADS] [Google Scholar]
- GRAVITY Collaboration (Abuter, R., et al.) 2019, A&A, 625, 10 [NASA ADS] [Google Scholar]
- Guhathakurta, P., van Gorkom, J. H., Kotanyi, C. G., & Balkowski, C. 1988, AJ, 96, 851 [NASA ADS] [CrossRef] [Google Scholar]
- Ibata, R. A., Gilmore, G., & Irwin, M. J. 1994, Nature, 370, 194 [Google Scholar]
- Jang, I. S., & Lee, M. G. 2014, ApJ, 792, 52 [NASA ADS] [CrossRef] [Google Scholar]
- Jarrett, T. H., Cluver, M. E., Brown, M. J. I., et al. 2019, ApJS, 245, 25 [Google Scholar]
- Hammer, F., Puech, M., Chemin, L., Flores, H., & Lehnert, M. D. 2007, ApJ, 662, 322 [NASA ADS] [CrossRef] [Google Scholar]
- Helmi, A., Babusiaux, C., Koppelman, H. H., et al. 2018, Nature, 563, 85 [Google Scholar]
- Henry, R. B. C., Balkowski, C., Cayatte, V., Edmunds, M. G., & Pagel, B. E. J. 1996, MNRAS, 283, 635 [NASA ADS] [CrossRef] [Google Scholar]
- Hlavacek-Larrondo, J., Carignan, C., Daigle, O., et al. 2011a, MNRAS, 411, 71 [NASA ADS] [CrossRef] [Google Scholar]
- Hlavacek-Larrondo, J., Marcelin, M., Epinat, B., et al. 2011b, MNRAS, 416, 509 [NASA ADS] [Google Scholar]
- Ho, L. C., Li, Z.-Y., Barth, A. J., Seigar, M. S., & Peng, C. Y. 2011, ApJS, 197, 21 [Google Scholar]
- Kaczmarek, J. F., & Wilcots, E. M. 2012, AJ, 144, 67 [NASA ADS] [CrossRef] [Google Scholar]
- Kalberla, P. M. W., & Dedes, L. 2008, A&A, 487, 951 [NASA ADS] [CrossRef] [EDP Sciences] [Google Scholar]
- Kam, S. Z., Carignan, C., Chemin, L., et al. 2017, AJ, 154, 41 [CrossRef] [Google Scholar]
- Kamphuis, J. J. 1993, Ph.D. Thesis, University of Groningen, The Netherlands [Google Scholar]
- Kamphuis, J., & Briggs, F. 1992, A&A, 253, 335 [NASA ADS] [Google Scholar]
- Kauffmann, G., Heckman, T. M., Tremonti, C., et al. 2003, MNRAS, 346, 1055 [Google Scholar]
- Kewley, L. J., Dopita, M. A., Sutherland, R. S., Heisler, C. A., & Trevena, J. 2001, ApJ, 556, 121 [Google Scholar]
- Kewley, L. J., Rupke, D., Zahid, H. J., Geller, M. J., & Barton, E. J. 2010, ApJ, 721, L48 [NASA ADS] [CrossRef] [Google Scholar]
- Kleiner, D., Koribalski, B. S., Serra, P., et al. 2019, MNRAS, 488, 5352 [NASA ADS] [CrossRef] [Google Scholar]
- Koppelman, H. H., Helmi, A., Massari, D., Price-Whelan, A. M., & Starkenburg, T. K. 2019, A&A, 631, L9 [NASA ADS] [CrossRef] [EDP Sciences] [Google Scholar]
- Kruijssen, J. M. D., Pfeffer, J. L., Reina-Campos, M., Crain, R. A., & Bastian, N. 2019, MNRAS, 486, 3180 [Google Scholar]
- Kruijssen, J. M. D., Pfeffer, J. L., Chevance, M., et al. 2020, MNRAS, 498, 2472 [NASA ADS] [CrossRef] [Google Scholar]
- Kubryk, M., Prantzos, N., & Athanassoula, E. 2015, A&A, 580, A126 [NASA ADS] [CrossRef] [EDP Sciences] [Google Scholar]
- Lang, P., Meidt, S. E., Rosolowsky, E., et al. 2020, ApJ, 897, 122 [CrossRef] [Google Scholar]
- Lapi, A., Salucci, P., & Danese, L. 2018, ApJ, 859, 2 [Google Scholar]
- Lelli, F., McGaugh, S. S., & Schombert, J. M. 2016, AJ, 152, 157 [Google Scholar]
- Leroy, A. K., Walter, F., Brinks, E., et al. 2008, AJ, 136, 2782 [Google Scholar]
- Leroy, A. K., Sandstrom, K. M., Lang, D., et al. 2019, ApJS, 244, 24 [Google Scholar]
- Leroy, A. K., Schinnerer, E., Hughes, A., et al. 2021, ApJS, 257, 43 [NASA ADS] [CrossRef] [Google Scholar]
- Licquia, T. C., & Newman, J. A. 2015, ApJ, 806, 96 [NASA ADS] [CrossRef] [Google Scholar]
- Licquia, T. C., & Newman, J. A. 2016, ApJ, 831, 71 [CrossRef] [Google Scholar]
- Licquia, T. C., Newman, J. A., & Brinchmann, J. 2015, ApJ, 809, 96 [NASA ADS] [CrossRef] [Google Scholar]
- Licquia, T. C., Newman, J. A., & Bershady, M. A. 2016, ApJ, 833, 220 [NASA ADS] [CrossRef] [Google Scholar]
- Lomelí-Núñez, L., Mayya, Y. D., Rodríguez-Merino, L. H., Ovando, P. A., & Rosa-González, D. 2022, MNRAS, 509, 180 [Google Scholar]
- López-Corredoira, M., Allende, Prieto C., Garzón, F., et al. 2018, A&A, 612, L8 [NASA ADS] [CrossRef] [EDP Sciences] [Google Scholar]
- López-Sánchez, Á. R., Westmeier, T., Esteban, C., & Koribalski, B. S. 2015, MNRAS, 450, 3381 [CrossRef] [Google Scholar]
- Lucero, D. M., Carignan, C., Elson, E. C., et al. 2015, MNRAS, 450, 3935 [NASA ADS] [CrossRef] [Google Scholar]
- Lundgren, A. A., Olofsson, H., Wiklind, T., & Rydbeck, G. 2004, A&A, 422, 865 [NASA ADS] [CrossRef] [EDP Sciences] [Google Scholar]
- Majewski, S. R., Schiavon, R. P., Frinchaboy, P. M., et al. 2017, AJ, 154, 94 [NASA ADS] [CrossRef] [Google Scholar]
- Malhan, K., Ibata, R. A., Sharma, S., et al. 2022, ApJ, 926, 107 [NASA ADS] [CrossRef] [Google Scholar]
- McCall, M. L., Rybski, P. M., & Shields, G. A. 1985, ApJS, 57, 1 [CrossRef] [Google Scholar]
- McGaugh, S. S. 2016, ApJ, 816, 42 [Google Scholar]
- McKee, C. F., Parravano, A., & Hollenbach, D. J. 2015, ApJ, 814, 13 [Google Scholar]
- McMillan, P. J. 2017, MNRAS, 465, 76 [NASA ADS] [CrossRef] [Google Scholar]
- McQuinn, K. B. W., Skillman, E. D., Dolphin, A. E., Berg, D., & Kennicutt, R. 2017, AJ, 154, 51 [NASA ADS] [CrossRef] [Google Scholar]
- Minniti, D., Saito, R. K., Alonso-García, J., Lucas, P. W., & Hempel, M. 2011, ApJ, 733, L43 [Google Scholar]
- Mitchell, C. J., Sellwood, J. A., Williams, T. B., et al. 2018, AJ, 155, 123 [CrossRef] [Google Scholar]
- Mutch, S. J., Croton, D. J., & Poole, G. B. 2011, ApJ, 736, 84 [NASA ADS] [CrossRef] [Google Scholar]
- Myeong, G. C., Vasiliev, E., Iorio, G., Evans, N. W., & Belokurov, V. 2019, MNRAS, 488, 1235 [Google Scholar]
- Newberg, H. J., Yanny, B., & Willett, B. A. 2009, ApJ, 700, L61 [NASA ADS] [CrossRef] [Google Scholar]
- Newton, K. 1980, MNRAS, 191, 169 [NASA ADS] [CrossRef] [Google Scholar]
- Oikawa, S., & Sofue, Y. 2014, PASJ, 66, 77 [NASA ADS] [CrossRef] [Google Scholar]
- Olivares, E. F., Hamuy, M., Pignata, G., et al. 2010, ApJ, 715, 833 [NASA ADS] [CrossRef] [Google Scholar]
- Ondrechen, M. P., & van der Hulst, J. M. 1989, ApJ, 342, 29 [Google Scholar]
- Ondrechen, M. P., van der Hulst, J. M., & Hummel, E. 1989, ApJ, 342, 39 [NASA ADS] [CrossRef] [Google Scholar]
- Osterbrock, D. E., & Ferland, G. J. 2006, Astrophysics of Gaseous Nebulae and Active Galactic Nuclei (Mill Valey: University Sciences Books) [Google Scholar]
- Pagel, B. E. J., Edmunds, M. G., Blackwell, D. E., Chun, M. S., & Smith, G. 1979, MNRAS, 189, 95 [NASA ADS] [CrossRef] [Google Scholar]
- Parkash, V., Brown, M. J. I., Jarrett, T. H., & Bonne, N. J. 2018, ApJ, 864, 40 [NASA ADS] [CrossRef] [Google Scholar]
- Pejcha, O., & Prieto, J. L. 2015, ApJ, 799, 215 [NASA ADS] [CrossRef] [Google Scholar]
- Peterson, C. J. 1978, ApJ, 226, 75 [CrossRef] [Google Scholar]
- Pilyugin, L. S. 2000, A&A, 362, 325 [NASA ADS] [Google Scholar]
- Pilyugin, L. S. 2001, A&A, 369, 594 [NASA ADS] [CrossRef] [EDP Sciences] [Google Scholar]
- Pilyugin, L. S., & Grebel, E. K. 2016, MNRAS, 457, 3678 [NASA ADS] [CrossRef] [Google Scholar]
- Pilyugin, L. S., & Thuan, T. X. 2005, ApJ, 631, 231 [CrossRef] [Google Scholar]
- Pilyugin, L. S., Vílchez, J. M., & Contini, T. 2004, A&A, 425, 849 [NASA ADS] [CrossRef] [EDP Sciences] [Google Scholar]
- Pilyugin, L. S., Grebel, E. K., & Mattsson, L. 2012, MNRAS, 424, 2316 [NASA ADS] [CrossRef] [Google Scholar]
- Pilyugin, L. S., Grebel, E. K., & Kniazev, A. Y. 2014, AJ, 147, 131 [NASA ADS] [CrossRef] [Google Scholar]
- Pilyugin, L. S., Grebel, E. K., Zinchenko, I. A., Nefedyev, Y. A., & Vílchez, J. M. 2017, A&A, 608, A127 [NASA ADS] [CrossRef] [EDP Sciences] [Google Scholar]
- Pilyugin, L. S., Grebel, E. K., Zinchenko, I. A., et al. 2018, A&A, 613, A1 [NASA ADS] [CrossRef] [EDP Sciences] [Google Scholar]
- Pilyugin, L. S., Grebel, E. K., Zinchenko, I. A., Nefedyev, Y. A., & Vílchez, J. M. 2019, A&A, 623, A122 [NASA ADS] [CrossRef] [EDP Sciences] [Google Scholar]
- Pilyugin, L. S., Grebel, E. K., Zinchenko, I. A., et al. 2020, A&A, 639, A96 [NASA ADS] [CrossRef] [EDP Sciences] [Google Scholar]
- Pilyugin, L. S., Cedrés, B., Zinchenko, I. A., et al. 2021, A&A, 653, A11 [NASA ADS] [CrossRef] [EDP Sciences] [Google Scholar]
- Pilyugin, L. S., Lara-López, M. A., Vílchez, J. M., et al. 2022, A&A, 668, A5 [Google Scholar]
- Ponomareva, A. A., Verheijen, M. A. W., & Bosma, A. 2016, MNRAS, 463, 4052 [NASA ADS] [CrossRef] [Google Scholar]
- Ponomareva, A. A., Verheijen, M. A. W., Peletier, R. F., & Bosma, A. 2017, MNRAS, 469, 2387 [NASA ADS] [CrossRef] [Google Scholar]
- Ponomareva, A. A., Verheijen, M. A. W., Papastergis, E., Bosma, A., & Peletier, R. F. 2018, MNRAS, 474, 4366 [Google Scholar]
- Robertson, P., Shields, G. A., & Blanc, G. A. 2012, ApJ, 748, 48 [CrossRef] [Google Scholar]
- Robotham, A. S. G., Driver, S. P., Davies, L. J. M., et al. 2014, MNRAS, 444, 3986 [NASA ADS] [CrossRef] [Google Scholar]
- Rosa, D. A., Dors, O. L., Krabbe, A. C., et al. 2014, MNRAS, 444, 2005 [NASA ADS] [CrossRef] [Google Scholar]
- Rots, A. H., Bosma, A., van der Hulst, J. M., Athanassoula, E., & Crane, P. C. 1990, AJ, 100, 387 [NASA ADS] [CrossRef] [Google Scholar]
- Rozas, M., Zurita, A., Beckman, J. E., & Pérez, D. 2000, A&AS, 142, 259 [NASA ADS] [CrossRef] [EDP Sciences] [Google Scholar]
- Rubin, V. C., Whitmore, B. C., & Ford, W. K. 1988, ApJ, 333, 522 [CrossRef] [Google Scholar]
- Rupke, D. S. N., Veilleux, S., & Baker, A. J. 2008, ApJ, 674, 172 [NASA ADS] [CrossRef] [Google Scholar]
- Rupke, D. S. N., Kewley, L. J., & Barnes, J. E. 2010a, ApJ, 710, 156 [Google Scholar]
- Rupke, D. S. N., Kewley, L. J., & Chien, L.-H. 2010b, ApJ, 723, 1255 [NASA ADS] [CrossRef] [Google Scholar]
- Ryder, S. D. 1995, ApJ, 444, 610 [NASA ADS] [CrossRef] [Google Scholar]
- Ryder, S. D., Staveley-Smith, L., Malin, D., & Walsh, W. 1995, AJ, 109, 1592 [NASA ADS] [CrossRef] [Google Scholar]
- Ryder, S. D., Walsh, W., & Malin, D. 1999, PASA, 16, 84 [NASA ADS] [CrossRef] [Google Scholar]
- Sabbi, E., Calzetti, D., Ubeda, L., et al. 2018, ApJS, 235, 23 [Google Scholar]
- Saha, A., Thim, F., Tammann, G. A., Reindl, B., & Sandage, A. 2006, ApJS, 165, 108 [Google Scholar]
- Sánchez, S. F., Rosales-Ortega, F. F., Iglesias-Páramo, J., et al. 2014, A&A, 563, A49 [CrossRef] [EDP Sciences] [Google Scholar]
- Schmidt, B. P., Kirshner, R. P., Eastman, R. G., et al. 1994, ApJ, 432, 42 [NASA ADS] [CrossRef] [Google Scholar]
- Sillero, E., Tissera, P. B., Lambas, D. G., & Michel-Dansac, L. 2017, MNRAS, 472, 4404 [NASA ADS] [CrossRef] [Google Scholar]
- Skillman, E. D., Kennicutt, R. C., Shields, G. A., & Zaritsky, D. 1996, ApJ, 462, 147 [NASA ADS] [CrossRef] [Google Scholar]
- Sofue, Y. 2020, Galaxies, 8, 37 [Google Scholar]
- Springob, C. M., Masters, K. L., Haynes, M. P., Giovanelli, R., & Marinoni, C. 2009, ApJS, 182, 474 [NASA ADS] [CrossRef] [Google Scholar]
- Storchi-Bergmann, T., Rodríguez-Ardila, A., Schmitt, H. R., Wilson, A. S., & Baldwin, J. A. 1996, ApJ, 472, 83 [NASA ADS] [CrossRef] [Google Scholar]
- Swaters, R. A., Schoenmakers, R. H. M., Sancisi, R., & van Albada, T. S. 1999, MNRAS, 304, 330 [NASA ADS] [CrossRef] [Google Scholar]
- Tamburro, D., Rix, H.-W., Walter, F., et al. 2008, AJ, 136, 2872 [NASA ADS] [CrossRef] [Google Scholar]
- Tikhonov, N. A., Lebedev, V. S., & Galazutdinova, O. A. 2015, Astron. Lett., 41, 239 [NASA ADS] [CrossRef] [Google Scholar]
- Thornley, M. D., & Mundy, L. G. 1997, ApJ, 484, 202 [NASA ADS] [CrossRef] [Google Scholar]
- Tilanus, R. P. J., & Allen, R. J. 1991, A&A, 244, 8 [NASA ADS] [Google Scholar]
- Toribio San Cipriano, L., García-Rojas, J., Esteban, C., Bresolin, F., & Peimbert, M. 2016, MNRAS, 458, 1866 [NASA ADS] [CrossRef] [Google Scholar]
- Torres-Flores, S., Amram, P., Olave-Rojas, D., et al. 2020, MNRAS, 494, 2785 [NASA ADS] [CrossRef] [Google Scholar]
- van den Bergh, S. 2006, AJ, 132, 1571 [NASA ADS] [CrossRef] [Google Scholar]
- van den Bosch, R. C. E. 2016, ApJ, 831, 134 [NASA ADS] [CrossRef] [Google Scholar]
- van der Kruit, P. C., & Searle, L. 1981, A&A, 95, 105 [NASA ADS] [Google Scholar]
- van Dokkum, P. G., Abraham, R., & Merritt, A. 2014, ApJ, 782, L24 [Google Scholar]
- van Zee, L., & Bryant, J. 1999, AJ, 118, 2172 [CrossRef] [Google Scholar]
- van Zee, L., Salzer, J. J., Haynes, M. P., O’Donoghue, A. A., & Balonek, T. J. 1998, AJ, 116, 2805 [CrossRef] [Google Scholar]
- Walter, F., Brinks, E., de Blok, W. J. G., et al. 2008, AJ, 136, 2563 [Google Scholar]
- Webster, B. L., & Smith, M. G. 1983, MNRAS, 204, 743 [NASA ADS] [Google Scholar]
- White, S. D. M., & Rees, M. J. 1978, MNRAS, 183, 341 [Google Scholar]
- Wong, T., Blitz, L., & Bosma, A. 2004, ApJ, 605, 183 [NASA ADS] [CrossRef] [Google Scholar]
- York, D. G., Adelman, J., Anderson, J. E., et al. 2000, AJ, 120, 1579 [Google Scholar]
- Zahid, H. J., & Bresolin, F. 2011, AJ, 141, 192 [NASA ADS] [CrossRef] [Google Scholar]
- Zánmar, Sánchez R., Sellwood, J. A., Weiner, B. J., & Williams, T. B. 2008, ApJ, 674, 797 [CrossRef] [Google Scholar]
- Zaritsky, D., Kennicutt, R. C., & Huchra, J. P. 1994, ApJ, 420, 87 [NASA ADS] [CrossRef] [Google Scholar]
- Zhou, S., Aragón-Salamanca, A., Merrifield, M., et al. 2023, MNRAS, 521, 5810 [NASA ADS] [CrossRef] [Google Scholar]
- Zinchenko, I. A., Pilyugin, L. S., Grebel, E. K., Sánchez, S. F., & Vílchez, J. M. 2016, MNRAS, 462, 2715 [Google Scholar]
- Zinchenko, I. A., Pilyugin, L. S., Sakhibov, F., et al. 2019, A&A, 628, A55 [NASA ADS] [CrossRef] [EDP Sciences] [Google Scholar]
- Zurita, A., Florido, E., Bresolin, F., Pérez-Montero, E., & Pérez, I. 2021, MNRAS, 500, 2359 [Google Scholar]
Appendix A: Characteristics of nearby galaxies
In this section we report the general characteristics (the inclination angle of a galaxy, the position angle of the major axis, distance, angular and physical optical radii, stellar mass, rotation velocity, and the black hole mass) and the source of the data for the sample of nearby galaxies. We estimated the abundances in H II regions through the R calibration from Pilyugin & Grebel (2016) and determined the O/H–Rg relation for each galaxy where Rg is a fractional radius normalised to the optical radius R25. The mean value of the uncertainty in the (O/H)R abundance obtained through the R calibration is ∼0.05 dex (Pilyugin & Grebel 2016). We assumed a deviation of the abundance from the O/H–Rg relation larger than 0.15 dex could be attributed to the large uncertainty in the line measurements or could be an indicator of a peculiarity in the abundance of the H II region. Therefore, the points with deviations larger than 0.15 dex in (O/H) were rejected and not used in the determination of the final O/H–Rg relation. The nearby galaxies discussed in the Section 4.4 (NGC 2903, NGC 3521, and NGC 4651) are not considered in this section. The compiled and derived characteristics of nearby galaxies are listed in Table 2.
A.1. NGC 224 (M 31)
Galaxy NGC 224 (M 31, Andromeda galaxy) is an Sb galaxy (morphological type code T = 3.0±0.4). The inclination angle of NGC 224 is i = 77°, and the position angle of the major axis is PA = 38° (Corbelli et al. 2010). The optical radius is 95.27 arcmin (de Vaucouleurs et al. 1991). At the distance of d = 0.82 Mpc (Anand et al. 2021), the physical optical radius of the NGC 224 is R25 = 22.72 kpc. The stellar mass is M⋆ = 1.0 × 10¹¹ M⊙, or log(M⋆/M⊙) = 11.00 (Jarrett et al. 2019). The black hole mass is log(MBH/M⊙) = 8.15 (Davis et al. 2019). The rotation velocity of NGC 224 is 253 km s−1 (Corbelli et al. 2010). The radial distribution of the oxygen abundances based on the H II regions from the compilation in Pilyugin et al. (2014) was approximated by the relation

with a scatter of 0.060 dex for 204 data points.
A.2. NGC 253
Galaxy NGC 253 is an SABc galaxy (morphological type code T = 5.1±0.4). The inclination angle of NGC 253 is i = 76°, and the position angle of the major axis PA = 235° (Lucero et al. 2015). The optical radius is 13.77 arcmin (de Vaucouleurs et al. 1991). At a distance of d = 3.70 Mpc (Anand et al. 2021), the physical optical radius of NGC 253 is R25 = 14.82 kpc. The stellar mass (mean value) is M⋆ = 3.50 × 10¹⁰ M⊙, or log(M⋆/M⊙) = 10.54 (Jarrett et al. 2019; Leroy et al. 2021). The black hole mass is log(MBH/M⊙) = 7.00±0.19 (Davis et al. 2019). The rotation velocity of NGC 253 is 211 km s−1 (Hlavacek-Larrondo et al. 2011a; Lucero et al. 2015). The radial distribution of the oxygen abundances traced by the H II regions from Webster & Smith (1983) was approximated by the relation

with a scatter of 0.061 dex for eight data points.
A.3. NGC 300
Galaxy NGC 300 is an Scd galaxy (morphological type code T = 6.9±0.4). The inclination angle of NGC 300 is i = 42°, and the position angle of the major axis PA = 106° (Carignan 1985). The optical radius is 10.94 arcmin (de Vaucouleurs et al. 1991). At a distance of d = 1.94 Mpc (Bono et al. 2010), the physical optical radius of NGC 300 is R25 = 6.17 kpc. The stellar mass (the mean value for estimations from Jarrett et al. 2019 and Leroy et al. 2021 rescaled to the adopted distance) is M⋆ = 2.10 × 10⁹ M⊙, or log(M⋆/M⊙) = 9.32. The rotation velocity of NGC 300 is 85 km s−1 (Hlavacek-Larrondo et al. 2011b; Ponomareva et al. 2016) The radial distribution of the oxygen abundances estimated using the H II regions from the compilation in Pilyugin et al. (2014) and supplemented by the measurements from Toribio San Cipriano et al. (2016) was approximated by the relation

with a scatter of 0.062 dex for 46 data points.
A.4. NGC 598 (M 33)
Galaxy NGC 598 (M 33) is an Sc galaxy (morphological type code T = 5.9±0.4). The inclination angle of NGC 598 is i = 54°, and the position angle of the major axis is PA = 201° (Kam et al. 2017). The optical radius is 35.40 arcmin (de Vaucouleurs et al. 1991). At a distance of d = 0.94 Mpc (Anand et al. 2021), the physical optical radius of NGC 598 is R25 = 9.68 kpc. The stellar mass is M⋆ = 4.87 × 10⁹ M⊙, or log(M⋆/M⊙) = 9.69 (Jarrett et al. 2019). The rotation velocity of the NGC 598 is 125 km s−1 (Kam et al. 2017). The radial abundance distribution traced by the H II regions from the compilation in Pilyugin et al. (2014) was approximated by the relation

with a scatter of 0.056 dex for 35 data points.
A.5. NGC 628 (M 74)
The nearby galaxy NGC 628 (M 74, the Phantom Galaxy) is an isolated Sc spiral galaxy (morphological type code T = 5.2±0.5). It is a face-on galaxy. Its inclination angle is i = 6°, and the position angle of the major axis PA = 25° (Kamphuis & Briggs 1992). The optical radius of NGC 628 is R25 = 5.24 arcmin (de Vaucouleurs et al. 1991). The H I disc extends out to more than three times the optical radius (Kamphuis & Briggs 1992). There are recent distance estimations for NGC 628 obtained through the tip of the red giant branch method based on Hubble Space Telescope measurements. Jang & Lee (2014) found the distance to NGC 628 to be 10.19 ± 0.14 (random) ± 0.56 (systematic) Mpc. McQuinn et al. (2017) measured the distance to NGC 628 to be 9.77 ± 0.17 (statistical uncertainty) ± 0.32 (systematic uncertainty) Mpc. Sabbi et al. (2018) determined the distances for the central pointing (d = 8.6 ± 0.9 Mpc) and for the outer field (d = 8.8 ± 0.7 Mpc). In this work, we adopted the distance to the NGC 628 used in our previous paper: d = 9.91 Mpc (Pilyugin et al. 2014), which is close to the values obtained by Jang & Lee (2014) and McQuinn et al. (2017). The optical radius of NGC 628 is R25 = 15.09 kpc with the adopted distance. The mean value of the stellar mass from Leroy et al. (2008) and Leroy et al. (2021) rescaled to the adopted distance is M⋆ = 2.3 × 10¹⁰ M⊙, or log(M⋆/M⊙) = 10.36. The radial abundance distribution for the H II regions from McCall et al. (1985), Ferguson et al. (1998), van Zee et al. (1998), Bresolin et al. (1999), Berg et al. (2015) was approximated by the relation

with a scatter of 0.047 dex for 78 data points.
A.6. NGC 753
Galaxy NGC 753 is an SABc galaxy (morphological type code T = 4.9±1.0). The inclination angle of NGC 753 is i = 50°, the position angle of the major axis is PA = 128° (Amram et al. 1994). The optical radius is 1.26 arcmin (de Vaucouleurs et al. 1991). At a distance of d = 72.4 Mpc (Leroy et al. 2019), the physical optical radius of NGC 753 is R25 = 26.45 kpc. The value of the rotation velocity is ∼210 km s−1 (Amram et al. 1994). The stellar mass is M⋆ = 8.13 × 10¹⁰ M⊙, or log(M⋆/M⊙) = 10.91 (Leroy et al. 2019). The abundance gradient traced by the H II regions from Henry et al. (1996) is

with a scatter of 0.055 dex for eight data points.
A.7. NGC 925
Galaxy NGC 925 is an Scd galaxy (morphological type code T = 7.0±0.3). The inclination angle of NGC 925 is i = 66°, and the position angle of the major axis is PA = 287° (de Blok et al. 2008). The optical radius is 5.24 arcmin (de Vaucouleurs et al. 1991). At a distance of d = 9.29 Mpc (Saha et al. 2006), the physical optical radius of NGC 925 is R25 = 14.15 kpc. The stellar mass is M⋆ = 5.62 × 10⁹ M⊙, or log(M⋆/M⊙) = 9.75 (Leroy et al. 2019). The rotation velocity of NGC 925 is 115 km s−1 (Ponomareva et al. 2016). The radial abundance distribution based on the H II regions from van Zee et al. (1998) was approximated by the relation

with a scatter of 0.047 dex for 34 data points.
A.8. NGC 1058
Galaxy NGC 1058 is an Sc galaxy (morphological type code T = 5.1±0.9). The inclination angle of NGC 1058 is i = 15°, and the position angle of the major axis is PA = 145° (García-Gómez et al. 2004). The optical radius is 1.51 arcmin (de Vaucouleurs et al. 1991). At a distance of d = 10.6 Mpc (Schmidt et al. 1994), the physical optical radius of NGC 1058 is R25 = 4.66 kpc. The stellar mass (rescaled to adopted distance) is M⋆ = 2.51 × 10⁹ M⊙, or log(M⋆/M⊙) = 9.40 (Leroy et al. 2019). The radial abundance distribution traced by the H II regions from Ferguson et al. (1998), Bresolin (2019) was approximated by the relation

with a scatter of 0.046 dex for 22 data points.
A.9. NGC 1068 (M 77)
Galaxy NGC 1068 (M 77) is an Sb galaxy (morphological type code T = 3.0±0.3). The inclination angle of NGC 1068 is i = 35°, and the position angle of the major axis PA = 73° (Leroy et al. 2021). The optical radius is 3.54 arcmin (de Vaucouleurs et al. 1991). At a distance of d = 13.97 Mpc (Anand et al. 2021), the physical optical radius of NGC 1068 is R25 = 14.38 kpc. The stellar mass is M⋆ = 8.13 × 10¹⁰ M⊙, or log(M⋆/M⊙) = 10.91 (Leroy et al. 2021). The mass of the black hole in the NGC 1068 is log(MBH/M⊙) = 6.75±0.08 (Davis et al. 2019). The radial distribution of the oxygen abundances in the H II regions from the compilation in Pilyugin et al. (2014) was approximated by the relation

with a scatter of 0.035 dex for 13 data points.
A.10. NGC 1097
Galaxy NGC 1097 is an SBb galaxy (morphological type code T = 3.3±0.5). The inclination angle of NGC 1097 is i = 46°, and the position angle of the major axis is PA = 134° (Ondrechen et al. 1989). The optical radius is 4.67 arcmin (de Vaucouleurs et al. 1991). At a distance of d = 13.58 Mpc (Anand et al. 2021), the physical optical radius of NGC 1097 is R25 = 18.43 kpc. The stellar mass is M⋆ = 5.75 × 10¹⁰ M⊙, or log(M⋆/M⊙) = 10.76 (Leroy et al. 2021). The black hole mass is log(MBH/M⊙) = 8.38±0.04 (Davis et al. 2019). The rotation velocity of NGC 1097 is 253 km s−1 (Ondrechen et al. 1989). The abundance gradient estimated using the H II regions from the compilation in Pilyugin et al. (2014) was approximated by the relation

with a scatter of 0.022 dex for 15 data points.
A.11. NGC 1232
Galaxy NGC 1232 is an SABc galaxy (morphological type code T = 5.0±0.4). The inclination angle of NGC 1232 is i = 30°, and the position angle of the major axis is PA = 270° (van Zee & Bryant 1999). The optical radius is 3.71 arcmin (de Vaucouleurs et al. 1991). At a distance of d = 21.5 Mpc (van Zee & Bryant 1999), the physical optical radius of NGC 1232 is R25 = 23.18 kpc. The stellar mass rescaled to the adopted distance is M⋆ = 4.70 × 10¹⁰ M⊙, or log(M⋆/M⊙) = 10.67 (Leroy et al. 2019). The rotation velocity of the NGC 1232 is 220 km s−1 (van Zee & Bryant 1999). The radial abundance distribution traced by the H II regions from the compilation in Pilyugin et al. (2014) was approximated by the relation

with a scatter of 0.050 dex for 29 data points.
A.12. NGC 1313
Galaxy NGC 1313 is an SBcd galaxy (morphological type code T = 7.0±0.4). The inclination angle of NGC 1313 is i = 48°, and the position angle of the major axis PA = 0° (Ryder et al. 1995). The optical radius is 6.12 arcmin or 367.2 arcsec (Ho et al. 2011). At a distance of d = 4.32 Mpc (Anand et al. 2021), the physical optical radius of NGC 1313 is R25 = 7.69 kpc. The stellar mass (mean value) is M⋆ = 2.91 × 10⁹ M⊙, or log(M⋆/M⊙) = 9.46 (Jarrett et al. 2019; Leroy et al. 2019). The rotation velocity of the NGC 1313 is 112 km s−1 (Ryder et al. 1995). The abundance gradient based on the H II regions from the compilation in Pilyugin et al. (2014) was approximated by the relation

with a scatter of 0.071 dex for 37 data points.
A.13. NGC 1365
Galaxy NGC 1365 is an Sb galaxy (morphological type code T = 3.2±0.7). Its inclination angle is i = 46°, and the position angle of the major axis is PA = 222° (Ondrechen & van der Hulst 1989). The optical radius of NGC 1365 is R25 = 5.61 arcmin (de Vaucouleurs et al. 1991). The distance to NGC 1365 is d = 19.6 Mpc (Saha et al. 2006). The physical optical radius at the adopted distance is R25 = 31.98 kpc. The stellar mass rescaled to the adopted distance is M⋆ = 6.00 × 10¹⁰ M⊙, or log(M⋆/M⊙) = 10.78 Jarrett et al. (2019). The mass of the black hole in the NGC 1365 is log(MBH/M⊙ = 6.60 ± 0.30 (Davis et al. 2019). We adopted Vrot = 300 km s−1 as the rotation velocity of NGC 1365, which is the mean value of Vrot ∼ 280 km s−1 determined by Ondrechen & van der Hulst (1989) and Vrot ∼ 320 km s−1 obtained by Zánmar et al. (2008). The abundance gradient traced by the H II regions from the compilation in Pilyugin et al. (2014) was approximated by the relation

with a scatter of 0.051 dex for 79 data points.
A.14. NGC 1512
Galaxy NGC 1512 is an Sa galaxy (morphological type code T = 1.2±0.5). The inclination angle of NGC 1512 is i = 42°, and the position angle of the major axis is PA = 262° (Lang et al. 2020). The optical radius is 4.46 arcmin (de Vaucouleurs et al. 1991). At a distance of d = 18.83 Mpc (Anand et al. 2021), the physical optical radius of NGC 1512 is R25 = 24.41 kpc. The stellar mass is M⋆ = 5.25 × 10¹⁰ M⊙, or log(M⋆/M⊙) = 10.72 (Leroy et al. 2021). The black hole mass is log(MBH/M⊙) = 7.78±0.19 (Davis et al. 2014). The rotation velocity of NGC 1512 is 179 km s−1 (Lang et al. 2020). The radial distribution of the oxygen abundances for the H II regions from Bresolin et al. (2012), López-Sánchez et al. (2015) is approximated by the relation

with a scatter of 0.050 dex for 59 data points.
A.15. NGC 1598
Galaxy NGC 1598 is an SBc galaxy (morphological type code T = 4.8±0.6). The inclination angle of NGC 1598 is i = 55°, the position angle of the major axis is PA = 123°, and the optical radius is 0.72 arcmin (de Vaucouleurs et al. 1991). At a distance of d = 55.80 Mpc (Springob et al. 2009), the physical optical radius of NGC 1598 is R25 = 11.73 kpc. The stellar mass is M⋆ = 1.62 × 10¹⁰ M⊙, or log(M⋆/M⊙) = 10.21 (Lapi et al. 2018). The rotation velocity of NGC 1598 is 110 km s−1 (Lapi et al. 2018). The radial abundance distribution based on the H II regions from Storchi-Bergmann et al. (1996) was approximated by the relation

with a scatter of 0.030 dex for nine data points.
A.16. NGC 1672
Galaxy NGC 1672 is an Sb galaxy (morphological type code T = 3.3±0.6). The inclination angle of NGC 1672 is i = 43°, and the position angle of the major axis is PA = 134° (Lang et al. 2020). The optical radius is 3.30 arcmin (de Vaucouleurs et al. 1991). At a distance of d = 19.40 Mpc (Anand et al. 2021), the physical optical radius of NGC 1672 is R25 = 18.64 kpc. The stellar mass is M⋆ = 5.37 × 10¹⁰ M⊙, or log(M⋆/M⊙) = 10.73 (Leroy et al. 2021). The mass of the black hole in NGC 1672 is log(MBH/M⊙) = 7.08 ± 0.90 (Davis et al. 2014). The radial distribution of the oxygen abundance estimated using the H II regions from Storchi-Bergmann et al. (1996) was approximated by the relation

with a scatter of 0.028 dex for 15 data points.
A.17. NGC 2403
Galaxy NGC 2403 is an SABc galaxy (morphological type code T = 6.0±0.3). The inclination angle of NGC 2403 is i = 63°, and the position angle of the major axis is PA = 124° (de Blok et al. 2008). The optical radius is 10.94 arcmin (de Vaucouleurs et al. 1991). At a distance of d = 3.19 Mpc (Anand et al. 2021), the physical optical radius of NGC 2403 is R25 = 10.15 kpc. The stellar mass is M⋆ = 4.50 × 10⁹ M⊙ or log(M⋆/M⊙) = 9.65 (Leroy et al. 2008; Jarrett et al. 2019). The rotation velocity of NGC 2403 is 134 km s−1 (de Blok et al. 2008; Leroy et al. 2008). The abundance gradient traced by the H II regions from the compilation in Pilyugin et al. (2014) is

with a scatter of 0.068 dex for 47 data points.
A.18. NGC 2442
Galaxy NGC 2442 is an Sbc galaxy (morphological type code T = 3.7±0.6). The inclination angle of NGC 2442 is i = 29°, and the position angle of the major axis is PA = 27° (Pilyugin et al. 2014). The optical radius is 2.75 arcmin (de Vaucouleurs et al. 1991). At a distance of d = 21.5 Mpc (Leroy et al. 2019), the physical optical radius of NGC 2442 is R25 = 17.18 kpc. The stellar mass is M⋆ = 6.92 × 10¹⁰ M⊙, or log(M⋆/M⊙) = 10.84 (Leroy et al. 2019). The black hole mass is log(MBH/M⊙) = 7.28±0.33 (Davis et al. 2014). The radial distribution of the oxygen abundances estimated using the H II regions from Ryder (1995) was approximated by the relation

with a scatter of 0.035 dex for eight data points.
A.19. NGC 2805
Galaxy NGC 2805 is an SABc galaxy (morphological type code T = 6.9±0.3). The inclination angle of NGC 2805 is i = 36°, and the position angle of the major axis is PA = 123° (Erroz-Ferrer et al. 2015). The optical radius is 3.16 arcmin (de Vaucouleurs et al. 1991). At a distance of d = 28.7 Mpc (Erroz-Ferrer et al. 2015), the physical optical radius of NGC 2805 is R25 = 26.34 kpc. The stellar mass (rescaled to the adopted distance) is M⋆ = 9.44 × 10⁹ M⊙, or log(M⋆/M⊙) = 9.98 (Leroy et al. 2019). The rotation velocity of NGC 2805 is 106 km s−1 (Erroz-Ferrer et al. 2015). The radial abundance distribution based on the H II regions from van Zee et al. (1998) was approximated by the relation

with a scatter of 0.033 dex for 17 data points.
A.20. NGC 2835
Galaxy NGC 2835 is an Sc galaxy (morphological type code T = 5.0±0.4). The inclination angle of NGC 2835 is i = 41.3°, and the position angle of the major axis is PA = 1° (Lang et al. 2020). The optical radius is 3.30 arcmin (de Vaucouleurs et al. 1991). At a distance of d = 12.22 Mpc (Anand et al. 2021), the physical optical radius of NGC 2835 is R25 = 11.74 kpc. The stellar mass is M⋆ = 1.00 × 10¹⁰ M⊙, or log(M⋆/M⊙) = 10.00 (Leroy et al. 2021). The mass of the black hole in the NGC 2835 is log(MBH/M⊙) = 6.72 ± 0.30 (Davis et al. 2014). The abundance gradient for the H II regions measured by Ryder (1995) is

with a scatter of 0.066 dex for 17 data points.
A.21. NGC 2997
Galaxy NGC 2997 is a grand design spiral galaxy of the type SABc (morphological type code T = 5.1±0.5). Its inclination angle is i = 33°, and the position angle of the major axis is PA = 108° (Lang et al. 2020). The optical radius of NGC 2997 is R25 = 4.46 arcmin (de Vaucouleurs et al. 1991). The distance to NGC 2997 is 11.3 Mpc (Lang et al. 2020). The physical optical radius at the adopted distance is R25 = 14.66 kpc. The stellar mass of NGC 2997 is M⋆ = 3.09 × 10¹⁰ M⊙, or log(M⋆/M⊙) = 10.49, rescaled to the adopted distance (Jarrett et al. 2019). The mass of the black hole in NGC 2997 is log(MBH/M⊙) = 5.84±0.75 (Davis et al. 2014). The rotation velocity of NGC 2997 is 185 km s−1 (Peterson 1978). The radial distribution of the oxygen abundances for the H II regions from the compilation in Pilyugin et al. (2014) was approximated by the relation

with a scatter of 0.045 dex for 19 data points.
A.22. NGC 3031 (M 81)
Galaxy NGC 3031 (M 81) is an Sab galaxy (morphological type code T = 2.4±0.6). The inclination angle of NGC 3031 is i = 59°, the position angle of the major axis is PA = 330°, and the optical radius is 10.69 arcmin (de Blok et al. 2008). At a distance of d = 3.63 Mpc (Saha et al. 2006), the physical optical radius of NGC 3031 is R25 = 11.29 kpc. The rotation velocity on the flat part is 215 km s−1 (de Blok et al. 2008; Ponomareva et al. 2017). The mean value of stellar mass out of five estimations is M⋆ = 4.93 × 10¹⁰ M⊙, or log(M⋆/M⊙) = 10.69 (Jarrett et al. 2019; Ponomareva et al. 2018). The mass of the black hole in NGC 3031 is log(MBH/M⊙) = 7.81 ± 0.13 in solar mass (van den Bosch 2016). The abundance gradient traced by the H II regions from the compilation in Pilyugin et al. (2014) and supplemented by the measurements from Arellano-Córdova et al. (2016) is

with a scatter of 0.041 dex for 77 data points.
A.23. NGC 3184
Galaxy NGC 3184 is an SABc spiral galaxy (morphological type code T = 5.9±0.4). It is a face-on galaxy. Its inclination angle is i = 16°, and the position angle of the major axis is PA = 179° (Tamburro et al. 2008). The optical radius of NGC 3184 is R25 = 3.71 arcmin (de Vaucouleurs et al. 1991). The estimations of the distance to NGC 3184 using Type II plateau supernovae as the “standard candle” resulted in the values of d = 12.5 – 12.7 Mpc (Olivares et al. 2010), d = 11.62±0.29 Mpc (Bose & Kumar 2014), and d = 9.68 Mpc (Pejcha & Prieto 2015). In this work we adopted the distance to NGC 3184 of d = 11.62 Mpc obtained by Bose & Kumar (2014). The optical radius of NGC 3184 is R25 = 12.53 kpc at the adopted distance. The value of the stellar mass is M⋆ = 2.57 × 10¹⁰ M⊙, or log(M⋆/M⊙) = 10.41 (Leroy et al. 2008; Das et al. 2020). The rotation velocity of NGC 3184 is Vrot = 210 km s−1 (Leroy et al. 2008). The radial distribution of the oxygen abundances estimated from the H II regions from McCall et al. (1985), van Zee et al. (1998), Berg et al. (2020) was approximated by the relation

with a scatter of 0.028 dex for 72 data points.
A.24. NGC 3351 (M 95)
Galaxy NGC 3351 (M 95) is an Sb galaxy (morphological type code T = 3.1±0.4). The inclination angle of NGC 3351 is i = 41°, and the position angle of the major axis is PA = 192° (Tamburro et al. 2008). The optical radius is 3.71 arcmin (de Vaucouleurs et al. 1991). At a distance of d = 9.96 Mpc (Anand et al. 2021), the physical optical radius of NGC 3351 is R25 = 10.74 kpc. The stellar mass is M⋆ = 2.34 × 10¹⁰ M⊙, or log(M⋆/M⊙) = 10.37 (Leroy et al. 2021). The mass of the black hole in NGC 3351 is log(MBH/M⊙) = 6.52 (van den Bosch 2016). The maximum value of the rotation velocity in NGC 3351 is 210 km s−1 (Tamburro et al. 2008), and the rotation velocity on the flat part of the rotation curve is 196 km s−1 (Leroy et al. 2008). We adopted Vrot = 196 km s−1. The abundance distribution based on the R calibration-based abundances in H II regions from the compilation in Pilyugin et al. (2014) was approximated by the relation

with a scatter of 0.016 dex for 20 data points.
A.25. NGC 3359
Galaxy NGC 3359 is an Sc galaxy (morphological type code T = 5.2±0.5). The inclination angle of NGC 3359 is i = 53°, and the position angle of the major axis is PA = 350° (Rozas et al. 2000). The optical radius is 3.62 arcmin (de Vaucouleurs et al. 1991). At a distance of d = 22.6 Mpc (Leroy et al. 2019), the physical optical radius of NGC 3359 is R25 = 23.81 kpc. The stellar mass is M⋆ = 1.51 × 10¹⁰ M⊙, or log(M⋆/M⊙) = 10.18 (Leroy et al. 2019). The rotation velocity of NGC 3359 is 145 km s−1 (Rozas et al. 2000). The radial distribution of the oxygen abundances estimated through the R calibration in H II regions from Zahid & Bresolin (2011) was approximated by the relation

with a scatter of 0.067 dex for 11 data points. We note that Zahid & Bresolin (2011) suggested the existence of a break in the radial abundance distribution in this galaxy. However, the number of points is small and the scatter is large, thus preventing us from making a solid conclusion about the break.
A.26. NGC 3621
Galaxy NGC 3621 is an SBcd galaxy (morphological type code T = 6.9±0.5). The inclination angle of NGC 3621 is i = 65°, and the position angle of the major axis is PA = 345° (de Blok et al. 2008). The optical radius is 4.88 arcmin (Ho et al. 2011). At a distance of d = 7.06 Mpc (Anand et al. 2021), the physical optical radius of NGC 3621 is R25 = 10.03 kpc. The stellar mass is M⋆ = 1.15 × 10¹⁰ M⊙, or log(M⋆/M⊙) = 10.06 (Leroy et al. 2019). The black hole mass is log(MBH/M⊙) = 6.00 (van den Bosch 2016). The rotation velocity of NGC 3621 is 140 km s−1 (de Blok et al. 2008). The abundance gradient traced by the H II regions from the compilation in Pilyugin et al. (2014) was approximated by the relation

with a scatter of 0.057 dex for 49 data points.
A.27. NGC 4254 (M 99)
Galaxy NGC 4254 (M 99) is a bright Sc galaxy (morphological type code T = 5.2±0.7) in the Virgo Cluster. The inclination angle of NGC 4254 is i = 34°, and the position angle of the major axis is PA = 68° (Lang et al. 2020). The optical radius is 2.68 arcmin (de Vaucouleurs et al. 1991). At a distance of d = 13.1 Mpc (Anand et al. 2021), the physical optical radius of NGC 4254 is R25 = 10.23 kpc. The stellar mass is M⋆ = 2.63 × 10¹⁰ M⊙, or log(M⋆/M⊙) = 10.42 (Leroy et al. 2021). The rotation velocity of NGC 4254 is 183 km s−1 (Lang et al. 2020). The radial distribution of the oxygen abundances for the H II regions from the compilation in Pilyugin et al. (2014) was approximated by the relation

with a scatter of 0.036 dex for 17 data points.
A.28. NGC 4258 (M 106)
Galaxy NGC 4258 (M 106) is an Sbc galaxy (morphological type code T = 4.0±0.2). The inclination angle of NGC 4258 is i = 72°, and the position angle of the major axis is PA = 331° (Ponomareva et al. 2017). The optical radius is 9.31 arcmin (de Vaucouleurs et al. 1991). At distance of d = 7.58 Mpc (Anand et al. 2021), the physical optical radius of NGC 4258 is R25 = 20.53 kpc. The stellar mass is M⋆ = 5.15 × 10¹⁰ M⊙ or log(M⋆/M⊙) = 10.71 (Jarrett et al. 2019). The black hole mass is log(MBH/M⊙) = 7.58±0.03 (van den Bosch 2016). The rotation velocity of NGC 4258 is 200 km s−1 (Ponomareva et al. 2017). The abundance gradient traced by the H II regions from Bresolin et al. (1999) is

with a scatter of 0.013 dex for four data points.
A.29. NGC 4303 (M 61)
Galaxy NGC 4303 (M 61) is an Sbc galaxy (morphological type code T = 4.0±0.1) in the Virgo Cluster. The inclination angle of NGC 4303 is i = 27°, and the position angle of the major axis is PA = 318° (Guhathakurta et al. 1988). The optical radius is 3.23 arcmin (de Vaucouleurs et al. 1991). At a distance of d = 16.99 Mpc (Anand et al. 2021), the physical optical radius is R25 = 15.95 kpc. The stellar mass is M⋆ = 3.24 × 10¹⁰ M⊙, or log(M⋆/M⊙) = 10.51 (Leroy et al. 2021). The black hole mass is log(MBH/M⊙) = 6.58 (Davis et al. 2019). The rotation velocity of NGC 4303 is 150 km s−1 (Guhathakurta et al. 1988), although Vrot = 178 km s−1 has been offered more recently (see Lang et al. 2020). The radial distribution of the oxygen abundances estimated through the R calibration in H II regions from a compilation in Pilyugin et al. (2014), is approximated by the relation

with a scatter of 0.078 dex for the 20 data points.
A.30. NGC 4321 (M 100)
Galaxy NGC 4321 (M 100) is an SABb galaxy (morphological type code T = 4.0±0.3) in the Virgo Cluster. The inclination angle of NGC 4321 is i = 27°, and the position angle of the major axis is PA = 153° (Guhathakurta et al. 1988). The optical radius is 3.71 arcmin (de Vaucouleurs et al. 1991). At a distance of d = 15.21 Mpc (Anand et al. 2021), the physical optical radius of NGC 4321 is R25 = 16.40 kpc. The stellar mass is M⋆ = 5.62 × 10¹⁰ M⊙, or log(M⋆/M⊙) = 10.75 (Leroy et al. 2021). The black hole mass is log(MBH/M⊙) = 6.67 (van den Bosch 2016). The rotation velocity of NGC 4321 is 270 km s−1 (Guhathakurta et al. 1988) for i = 27°, while Lang et al. (2020) found Vrot = 181 km s−1 for i = 38.5°. The radial distribution of the oxygen abundances in the H II regions from the compilation in Pilyugin et al. (2014) was approximated by the relation

with a scatter of 0.022 dex for nine data points.
A.31. NGC 4395
Galaxy NGC 4395 is an Sm galaxy (morphological type code T = 8.8±0.5) in front of the Virgo Cluster. The inclination angle of NGC 4395 is i = 46°, and the position angle of the major axis is PA = 324° (Swaters et al. 1999). The optical radius is 6.59 arcmin (de Vaucouleurs et al. 1991). At a distance (mean value for north and south fields) of d = 4.51 Mpc (Sabbi et al. 2018), the physical optical radius of NGC 4395 is R25 = 8.65 kpc. The stellar mass is M⋆ = 2.63 × 10⁹ M⊙, or log(M⋆/M⊙) = 9.42 (Jarrett et al. 2019). The black hole mass is log(MBH/M⊙) = 5.64 (van den Bosch 2016). The rotation velocity of NGC 4395 is 80 km s−1 (Swaters et al. 1999). The abundance gradient traced by the H II regions from the compilation in Pilyugin et al. (2014) is

with a scatter of 0.054 dex for 14 data points.
A.32. NGC 4501 (M 88)
Galaxy NGC 4501 (M 88) is an Sb galaxy (morphological type code T = 3.3±0.6). The inclination angle of NGC 4501 is i = 64°, and the position angle of the major axis is PA = 141° (Wong et al. 2004). The optical radius is 3.46 arcmin (de Vaucouleurs et al. 1991). At a distance of d = 16.8 Mpc (Leroy et al. 2019), the physical optical radius of NGC 4501 is R25 = 16.90 kpc. The stellar mass is M⋆ = 1.0 × 10¹¹ M⊙, or log(M⋆/M⊙) = 11.00 (Leroy et al. 2019). The black hole mass is log(MBH/M⊙) = 7.13±0.08 (Davis et al. 2019). The rotation velocity of NGC 4501 is 280 km s−1 (Wong et al. 2004). The radial distribution of the oxygen abundances in the H II regions from Skillman et al. (1996) was approximated by the relation

with a scatter of 0.034 dex for four data points.
A.33. NGC 4625
Galaxy NGC 4625 is an SABm galaxy (morphological type code T = 8.7±0.9). The inclination angle of NGC 4625 is i = 31°, and the position angle of the major axis is PA = 303° (Kaczmarek & Wilcots 2012). The optical radius is 1.09 arcmin (de Vaucouleurs et al. 1991). At a distance of d = 11.75 Mpc (McQuinn et al. 2017), the physical optical radius of NGC 4625 is R25 = 3.74 kpc. The stellar mass is M⋆ = 1.19 × 10⁹ M⊙, or log(M⋆/M⊙) = 9.08 (Leroy et al. 2019). The rotation velocity of NGC 4625 is 60 km s−1 (Kaczmarek & Wilcots 2012). The radial distribution of the oxygen abundances from the H II regions from Goddard et al. (2011) was approximated by the relation

with a scatter of 0.025 dex for 12 data points.
A.34. NGC 5055 (M 63)
Galaxy NGC 5055 (M 63) is an Sbc galaxy (morphological type code T = 4.0±0.2). The inclination angle of NGC 5055 is i = 59°, the position angle of the major axis is PA = 102°, and the optical radius is 5.87 arcmin (de Blok et al. 2008; Walter et al. 2008). At a distance of d = 8.87 Mpc (McQuinn et al. 2017), the physical optical radius of NGC 5055 is R25 = 15.16 kpc. The value of the rotation velocity on the flat part is 192 km s−1 (de Blok et al. 2008; Ponomareva et al. 2017). The mean value of the stellar mass from estimations by Leroy et al. (2008) and Jarrett et al. (2019) and rescaled to the adopted distance is M⋆ = 5.40 × 10¹⁰ M⊙, or log(M⋆/M⊙) = 10.73. The mass of the black hole in NGC 5055 is log(MBH/M⊙) = 8.92 ± 0.10 in solar mass (van den Bosch 2016). The abundance gradient traced by the four H II regions measured by McCall et al. (1985) is

with a scatter of 0.017 dex for four data points.
A.35. NGC 5068
Galaxy NGC 5068 is an Sc galaxy (morphological type code T = 6.0±0.4). The inclination angle of NGC 5068 is i = 35°, and the position angle of the major axis is PA = 342° (Lang et al. 2020). The optical radius is 3.62 arcmin (de Vaucouleurs et al. 1991). At a distance of d = 5.20 Mpc (Anand et al. 2021), the physical optical radius of NGC 5068 is R25 = 5.48 kpc. The stellar mass is M⋆ = 2.57 × 10⁹ M⊙, or log(M⋆/M⊙) = 9.41 (Leroy et al. 2021). The radial distribution of the oxygen abundances in the H II regions from Ryder (1995) was approximated by the relation

with a scatter of 0.058 dex for 16 data points.
A.36. NGC 5194 (M 51a)
The nearby galaxy NGC 5194 (M 51a, the Whirlpool Galaxy) is an SABb spiral galaxy (morphological type code T = 4.0±0.3). The bright disc of NGC 5194 ends abruptly at about 5 arcmin radius in both the optical images and the H I. The velocity structure of the gas in NGC 5194 is extremely complicated and difficult to interpret (Rots et al. 1990). There is the misalignment of the major axes of the H I distribution and the velocity field. Therefore, the geometrical parameters of NGC 5194 are rather uncertain. Tamburro et al. (2008) derived the following geometrical projection parameters of the NGC 5194 galaxy disc: The position angle is PA = 172°, and the inclination is i = 42°. Colombo et al. (2014) undertook a detailed kinematic study of NGC 5194 and found a position angle PA = (173 ± 3)° and an inclination i = (22 ± 5)°. The geometrical parameters of NGC 5194 obtained by Colombo et al. (2014) are used here. We adopt the optical radius of NGC 5194 R25 = 5.61 arcmin (de Vaucouleurs et al. 1991). We note that the value of the optical radius of R25 = 3.88 arcmin was used for NGC 5194 within THINGS (Walter et al. 2008). There are recent distance estimations for NGC 5194 made through the tip of the red giant branch method based on Hubble Space Telescope measurements. Tikhonov et al. (2015) found the distance to NGC 5194 to be in the range from 8.88 to 9.09 Mpc. McQuinn et al. (2017) have measured the distance to NGC 5194 to be 8.58 ± 0.10 (statistical uncertainty) ± 0.28 (systematic uncertainty) Mpc. Sabbi et al. (2018) determined the distances for the central pointing (d = 7.6 ± 0.8 Mpc) and for two outer fields (d = 7.2 ± 0.6 Mpc and d = 7.6 ± 0.6 Mpc). The distance to NGC 5194 that we adopted in this work is d = 8.58 Mpc, which was obtained by McQuinn et al. (2017). The optical radius of NGC 5194 is R25 = 14.00 kpc with the adopted distance. The value of the stellar mass rescaled to the adopted distance is M⋆ = 4.54 × 10¹⁰ M⊙, or log(M⋆/M⊙) = 10.66 (Leroy et al. 2008; Jarrett et al. 2019). The rotation curve of NGC 5194 has been measured in several investigations (e.g. Tilanus & Allen 1991; Leroy et al. 2008; Oikawa & Sofue 2014). We adopted the rotation velocity of Vrot = 219 km s−1 from Leroy et al. (2008). We note that the value of the Vrot for NGC 5194 can include a significant error because of the low inclination of the galaxy. The radial distribution of the oxygen abundances estimated through the R calibration in the H II regions from the compilation in Pilyugin et al. (2014) and supplemented by the measurements from Croxall et al. (2015) was approximated by the relation

with a scatter of 0.030 dex for 87 data points.
A.37. NGC 5236 (M 83)
Galaxy NGC 5236 (M 83) is an Sc galaxy (morphological type code T = 5.0±0.3). The inclination angle of NGC 5236 is i = 24°, and the position angle of the major axis is PA = 225° (Leroy et al. 2021). The optical radius is 6.44 arcmin (de Vaucouleurs et al. 1991). At distance of d = 4.89 Mpc (Anand et al. 2021), the physical optical radius of NGC 5236 is R25 = 9.16 kpc. The stellar mass is M⋆ = 3.39 × 10¹⁰ M⊙, or log(M⋆/M⊙) = 10.53 (Jarrett et al. 2019; Leroy et al. 2021). The rotation velocity of NGC 5236 is 190 km s−1 (Lundgren et al. 2004). The abundance gradient traced by the H II regions from the compilation in Pilyugin et al. (2014) was approximated by the relation

with a scatter of 0.022 dex for 51 data points.
A.38. NGC 5248
Galaxy NGC 5248 is an SABb galaxy (morphological type code T = 4.0±0.3). The inclination angle of NGC 5248 is i = 47°, and the position angle of the major axis is PA = 109° (Lang et al. 2020). The optical radius is 3.08 arcmin (de Vaucouleurs et al. 1991). At a distance of d = 14.87 Mpc (Anand et al. 2021), the physical optical radius of NGC 5248 is R25 = 13.34 kpc. The stellar mass is M⋆ = 2.57 × 10¹⁰ M⊙, or log(M⋆/M⊙) = 10.41 (Leroy et al. 2021). The black hole mass is log(MBH/M⊙) = 6.30±0.38 (van den Bosch 2016). The rotation velocity of NGC 5248 is 196 km s−1 (Lang et al. 2020). The radial distribution of the oxygen abundances from the H II regions from the compilation in Pilyugin et al. (2014) was approximated by the relation

with a scatter of 0.040 dex for 11 data points.
A.39. NGC 5457 (M 101)
The giant nearby galaxy NGC 5457 (M 101, the Pinwheel) is a prototype of Sc spiral galaxy (morphological type code T = 5.9±0.3). It is a face-on galaxy. Its inclination angle is i = 18°, and the position angle of the major axis is PA = 37° (Kamphuis 1993). The optical radius of NGC 5457 is R25 = 14.42 arcmin (de Vaucouleurs et al. 1991). There are 79 independent distance measurements of NGC 5457 after the year 2000, including those using Cepheids and tip of the read giant branch (Lomelí-Núñez et al. 2022). The obtained distances are within the range of ∼6 to ∼9 Mpc. In this work, we adopted the distance to NGC 5457 used in our previous study: d = 6.85 (Pilyugin et al. 2014). The optical radius of NGC 5457 is R25 = 28.73 kpc with the adopted distance. The stellar mass of NGC 5457 is M⋆ = 3.81 × 10¹⁰ M⊙, or log(M⋆/M⊙) = 10.58, and the mean value of the estimations from van Dokkum et al. (2014) and Jarrett et al. (2019) were rescaled to the adopted distance. The mass of the black hole in the NGC 5457 is log(MBH/M⊙) = 6.41 (van den Bosch 2016). The abundance gradient traced by the H II regions from the compilation in Pilyugin et al. (2014) and supplemented by the measurements from Croxall et al. (2016) and Esteban et al. (2020) is

with a scatter of 0.061 dex for 213 data points.
A.40. NGC 6384
Galaxy NGC 6384 is an Sbc galaxy (morphological type code T = 3.6±0.6). The inclination angle of NGC 6384 is i = 55°, and the position angle of the major axis is PA = 31° (Mitchell et al. 2018). The optical radius is 3.08 arcmin (de Vaucouleurs et al. 1991). At a distance of d = 25.9 Mpc (Leroy et al. 2019), the physical optical radius of NGC 6384 is R25 = 23.23 kpc. The stellar mass is M⋆ = 5.74 × 10¹⁰ M⊙, or log(M⋆/M⊙) = 10.76 (Leroy et al. 2019). The rotation velocity of NGC 6384 is 230 km s−1 (Mitchell et al. 2018). The radial distribution of the oxygen abundances estimated through the R calibration in H II regions from the compilation in Pilyugin et al. (2014) was approximated by the relation

with a scatter of 0.025 dex for eight data points.
A.41. NGC 6744
Galaxy NGC 6744 is an Sbc galaxy (morphological type code T = 4.0±0.2). The inclination angle of NGC 6744 is i = 50°, and the position angle of the major axis is PA = 16° (Ryder et al. 1999). The optical radius is 9.98 arcmin (de Vaucouleurs et al. 1991) (although Ho et al. 2011 found around half that optical radius). At a distance of d = 9.39 Mpc (Anand et al. 2021), the physical optical radius of NGC 6744 is R25 = 27.25 kpc. The stellar mass (mean value) is M⋆ = 5.92 × 10¹⁰ M⊙, or log(M⋆/M⊙) = 10.77 (Jarrett et al. 2019; Leroy et al. 2021). The black hole mass is log(MBH/M⊙) = 6.89±0.34 (Davis et al. 2014). The rotation velocity of NGC 6744 is 200 km s−1 (Ryder et al. 1999). The abundance gradient traced by the H II regions from Ryder (1995) is

with a scatter of 0.030 dex for 17 data points.
A.42. NGC 6946
Galaxy NGC 6946 is an SABc galaxy (morphological type code T = 5.9±0.3). The inclination angle of NGC 6946 is i = 33°, and the position angle of the major axis is PA = 243° (de Blok et al. 2008). The optical radius is 5.74 arcmin (de Vaucouleurs et al. 1991). At a distance of d = 7.34 Mpc (Anand et al. 2021), the physical optical radius of NGC 6946 is R25 = 12.26 kpc. The stellar mass (mean value) is M⋆ = 2.85 × 10¹⁰ M⊙, or log(M⋆/M⊙) = 10.45 (Jarrett et al. 2019; Leroy et al. 2019). The rotation velocity of NGC 6946 is 186 km s−1 (de Blok et al. 2008; Leroy et al. 2008). The radial distribution of the oxygen abundances estimated using the H II regions from the compilation in Pilyugin et al. (2014) was approximated by the relation

with a scatter of 0.047 dex for 12 data points.
A.43. NGC 7331
Galaxy NGC 7331 is an Sbc galaxy (morphological type code T = 3.9±0.3). The inclination angle of NGC 7331 is i = 76°, and the position angle of the major axis is PA = 168° (de Blok et al. 2008). The optical radius is 5.24 arcmin (de Vaucouleurs et al. 1991). At a distance of d = 14.7 Mpc (Walter et al. 2008), the physical optical radius of NGC 7331 is R25 = 22.39 kpc. The stellar mass (mean value) is M⋆ = 1.0 × 10¹¹ M⊙, or log(M⋆/M⊙) = 11.00 (Jarrett et al. 2019; Leroy et al. 2019). The black hole mass is log(MBH/M⊙) = 8.02±0.18 (van den Bosch 2016). The rotation velocity of NGC 7331 is 244 km s−1 (de Blok et al. 2008; Leroy et al. 2008). The abundance gradient traced by the H II regions from Bresolin et al. (1999) is

with a scatter of 0.014 dex for four data points.
A.44. NGC 7518
Galaxy NGC 7518 is an SABa galaxy (morphological type code T = 1.1±0.6). The inclination angle of NGC 7518 is i = 47°, and the position angle of the major axis is PA = 294° (Amorín et al. 2009). The optical radius is 0.71 arcmin (de Vaucouleurs et al. 1991). At a distance of d = 47.56 Mpc (Amorín et al. 2009), the physical optical radius of NGC 7518 is R25 = 9.77 kpc. The stellar mass is M⋆ = 1.48 × 10¹⁰ M⊙, or log(M⋆/M⊙) = 10.17 (Leroy et al. 2019). The radial distribution of the oxygen abundances estimated for the H II regions from Robertson et al. (2012) was approximated by the relation

with a scatter of 0.019 dex for 12 data points.
A.45. NGC 7529
Galaxy NGC 7529 is an Sbc galaxy (morphological type code T = 4.3±2.2). The inclination angle of NGC 7529 is i = 29°, and the position angle of the major axis is PA = 157° (Zurita et al. 2021). The optical radius is 0.43 arcmin (de Vaucouleurs et al. 1991). At a distance of d = 63.2 Mpc (Zurita et al. 2021), the physical optical radius of NGC 7529 is R25 = 7.82 kpc. The stellar mass is M⋆ = 7.34 × 10⁹ M⊙, or log(M⋆/M⊙) = 9.87 (Leroy et al. 2019). The abundance gradient traced by the H II regions from Robertson et al. (2012) is

with a scatter of 0.045 dex for 11 data points.
A.46. NGC 7591
Galaxy NGC 7591 is an SBbc galaxy (morphological type code T = 3.6±0.6). The inclination angle of NGC 7591 is i = 68°, and the position angle of the major axis is PA = 148° (Rubin et al. 1988). The optical radius is 0.98 arcmin (de Vaucouleurs et al. 1991). At a distance of d = 67.3 Mpc (Leroy et al. 2019), the physical optical radius of NGC 7591 is R25 = 19.08 kpc. The stellar mass is M⋆ = 3.72 × 10¹⁰ M⊙, or log(M⋆/M⊙) = 10.57 (Leroy et al. 2019). The rotation velocity of NGC 7591 is 199 km s−1 (Rubin et al. 1988). The radial distribution of the oxygen abundances estimated through the R calibration in H II regions from Robertson et al. (2012) was approximated by the relation

with a scatter of 0.025 dex for 11 data points.
A.47. NGC 7793
Galaxy NGC 7793 is an Scd galaxy (morphological type code T = 7.4±0.6). The inclination angle of NGC 7793 is i = 50°, the position angle of the major axis is PA = 290°, and the optical radius is 5.24 arcmin (de Blok et al. 2008). At a distance of d = 3.62 Mpc (Anand et al. 2021), the physical optical radius of NGC 7793 is R25 = 5.51 kpc. The maximum value of the rotation velocity of NGC 7793 is 118 km s−1, and the value of the rotation velocity on the flat part is 95 km s−1 (Carignan & Puche 1990; de Blok et al. 2008; Ponomareva et al. 2017). We adopted Vrot = 95 km s−1. The mean value out of six estimations of the stellar mass of NGC 7793 (Ponomareva et al. 2018; Jarrett et al. 2019; Leroy et al. 2021) is M⋆ = 2.54 × 10⁹ M⊙, or log(M⋆/M⊙) = 9.40. The radial distribution of the oxygen abundances for the H II regions from compilation in Pilyugin et al. (2014) was approximated by the relation

with a scatter of 0.068 dex for 38 data points.
A.48. IC 342
Galaxy IC 342 is an SABc galaxy (morphological type code T = 6.0±0.3). The inclination angle of IC 342 is i = 31°, and the position angle of the major axis is PA = 37° (Crosthwaite et al. 2000). The optical radius is 10.69 arcmin (de Vaucouleurs et al. 1991). At a distance d = 3.45 Mpc (Anand et al. 2021), the physical optical radius of IC 342 is R25 = 10.73 kpc. The stellar mass (mean value) is M⋆ = 2.35 × 10¹⁰ M⊙, or log(M⋆/M⊙) = 10.37 (Jarrett et al. 2019; Leroy et al. 2019). (We note the large uncertainties in the mass estimations: M⋆ = 1.45 × 10¹⁰ M⊙, or log(M⋆/M⊙) = 10.16 Leroy et al. 2019, and M⋆ = 3.25 × 10¹⁰ M⊙, or log(M⋆/M⊙) = 10.51 Jarrett et al. 2019). The rotation velocity of IC 342 is 170 km s−1 (Crosthwaite et al. 2000), although Newton (1980) found Vrot = 191 km s−1 for i = 25° and PA = 39°. The radial distribution of the oxygen abundances estimated through the R calibration in H II regions from McCall et al. (1985) was approximated by the relation

with a scatter of 0.030 dex for four data points.
A.49. IC 5201
Galaxy IC 5201 is an Sc galaxy (morphological type code T = 6.1±0.6). The inclination angle of IC 5201 is i = 67°, and the position angle of the major axis is PA = 206° (Kleiner et al. 2019). The optical radius is 4.26 arcmin (de Vaucouleurs et al. 1991). At a distance of d = 9.20 Mpc (Leroy et al. 2019), the physical optical radius of IC 5201 is R25 = 11.39 kpc. The stellar mass is M⋆ = 7.59 × 10⁹ M⊙, or log(M⋆/M⊙) = 9.88 (Leroy et al. 2019). The rotation velocity of IC 5201 is 98 km s−1 (Kleiner et al. 2019). The abundance gradient traced by the H II regions from Ryder (1995) is

with a scatter of 0.085 dex for six data points.
A.50. IC 5309
Galaxy IC 5309 is an Sb galaxy (morphological type code T = 3.1±0.4). The inclination angle of IC 5309 is i = 63°, and the position angle of the major axis is PA = 20° (Amram et al. 1992). The optical radius is 0.67 arcmin (de Vaucouleurs et al. 1991). At a distance of d = 55.7 Mpc (Leroy et al. 2019), the physical optical radius of IC 5309 is R25 = 10.93 kpc. The stellar mass is M⋆ = 1.62 × 10¹⁰ M⊙, or log(M⋆/M⊙) = 10.21 (Leroy et al. 2019). The rotation velocity of IC 5309 is 152 km s−1 (Amram et al. 1992). The radial distribution of the oxygen abundances estimated through the R calibration in H II regions from Robertson et al. (2012) was approximated by the relation

with a scatter of 0.058 dex for 14 data points.
All Tables
All Figures
|
Fig. 1. Rotation curves of the Milky Way from Burton & Gordon (1978), Eilers et al. (2019), Ablimit et al. (2020; two variants), and Sofue (2020). |
| In the text | |
|
Fig. 2. Radial oxygen abundance distribution in the Milky Way. Panel a: radial abundance gradients obtained by Arellano-Córdova et al. (2020, 2021). The black circles designate the H II regions from Arellano-Córdova et al. (2020). The dashed black curve is the quadratic fit to those data. The blue squares mark the H II regions from Arellano-Córdova et al. (2021). The solid blue line shows the linear fit to all the data. Panel b: radial abundance distribution in the Milky Way obtained in this work (see text). The black circles denote the H II regions used in the determination of the radial abundance gradient (solid line). The open circles designate the H II regions excluded from the determination of the abundance gradient. |
| In the text | |
|
Fig. 3. Properties of the MaNGA galaxy M-8934-12701. Panel a1: surface brightness distribution across the image of the galaxy in sky coordinates (pixels). The value of the surface brightness is colour-coded. The circle shows the kinematic centre of the galaxy, the dark solid line indicates the position of the major kinematic axis of the galaxy, and the solid ellipse is the optical radius for kinematic angles. The red cross is the photometric centre, the red dashed line indicates the position of the major photometric axis, and the red dashed ellipse is the optical radius for photometric angles. Panel a2: photometric profile (points) and its fit (line) within the optical radius. Panel b1: line-of-sight velocity field in sky coordinates. Panel b2: rotation velocity curve (points) and its fit (line) within the optical radius. Panel c1: oxygen abundance map. Panel c2: radial abundance distribution. The grey points denote the abundances for the individual spaxels, the solid line is the simple linear fit to those data, while the dashed line is the broken linear fit to the same data. Panel d1: map of the gas velocity dispersion σ. Panel d2: radial distribution of the gas velocity dispersion σ in the disc. The coloured circles denote the gas velocity dispersion for the individual spaxels of H II region-like (blue symbols), intermediate (red symbols), and AGN-like (black symbols) spectra classification. Panel e1: map of the measured flux in the Hα emission line per spaxel in units of 10−17 erg s−1 cm−2/spaxel. Panel e2: radial distribution of the measured Hα flux. The coloured circles denote the flux for the individual spaxels of H-region-like (blue symbols), intermediate (red symbols), and AGN-like (black symbols) spectra classification. Panel f1: map of the BPT spectra classification. The BPT types of radiation for the individual spaxels are colour-coded. Panel f2: BPT diagram for the individual spaxels colour-coded by H II region-like (blue symbols), intermediate (red symbols), and AGN-like (black symbols) spectra. Solid and short-dashed curves mark the demarcation line between AGNs and H II regions defined by Kauffmann et al. (2003) and Kewley et al. (2001), respectively. The long-dashed line is the dividing line between Seyfert galaxies and LINERs defined by Cid et al. (2010). |
| In the text | |
 |
Fig. 4. Properties of the MaNGA galaxy M-8341-09101. The notations are the same as in Fig. 3. |
| In the text | |
|
Fig. 5. Comparison of the characteristics of the Milky Way and galaxies from our sample. Panel a: stellar masses M⋆ as a function of rotation velocity Vrot (Tully–Fisher diagram). The grey points in each panel denote individual MaNGA galaxies, while the goldenrod points correspond to nearby galaxies in our sample. The solid line is the linear fit to all the data, while the dotted lines are ±σ deviations. The red circle marks the position of the Milky Way. Panel b: optical radius R25 as a function of rotation velocity Vrot. Panel c: optical radius R25 as a function of stellar mass M⋆. Panel d: black hole mass MBH as a function of stellar mass M⋆. Panel e: central oxygen abundance (O/H)0 as a function of stellar mass M⋆. Panel f: oxygen abundance at the optical radius (O/H)R25 as a function of stellar mass M⋆. |
| In the text | |
|
Fig. 6. Histograms of the radial oxygen abundance gradients for our sample of galaxies. Panel a: normalised histogram of the radial oxygen abundance gradients for our sample of galaxies (MaNGA + nearby). The solid line denotes the histogram of the obtained gradients, while the dashed line corresponds to the Gaussian fit to those data. The arrow marks the value of the radial abundance gradient of the Milky Way. Panel b: normalised histograms of the radial oxygen abundance gradients for subsamples of MaNGA (dotted line) and nearby (solid line) galaxies. The histograms were normalised to the same value as the histogram in panel a. |
| In the text | |
|
Fig. 7. Milky Way twin candidates according to the strict criteria. Panel a: index of the structural differences between galaxies and the Milky Way DMR (Eq. (10)) as a function of the index of the evolutionary difference DOH (Eq. (11)). The points are individual MaNGA (grey) and nearby (goldenrod) galaxies. The dashed lines indicate DMR = 0.1 and DOH = 0.1. Panel b: central oxygen abundance versus abundance at the optical radius. The galaxies with DOH ≤ 0.1 (eMWAs) are marked with red crosses. The galaxies with DMR < 0.1 (sMWAs) are indicated with blue plus signs. The green circle denotes the Milky Way. Panel c: optical radius versus stellar mass diagram. The notations are the same as in panel b. Panel d: optical radius versus rotation velocity diagram. The notations are the same as in panel b. |
| In the text | |
|
Fig. 8. Milky Way twin candidates according to the weak criteria. Panel a: central oxygen abundance versus abundance at the optical radius diagram. The grey points are individual MaNGA galaxies, and the goldenrod pints denote the nearby galaxies. The galaxies with Δ(O/H)0 ≤ 0.15 dex and Δ(O/H)R25 ≤ 0.15 dex (eMWAs) are marked with the red crosses. The eMWAs with ΔR25 ≤ 0.114 dex, ΔM⋆ ≤ 0.3 dex, and ΔVrot ≤ 0.079 dex (Milky Way twin candidates) are marked with the blue plus signs. The green circle denotes the Milky Way. Panel b: optical radius versus stellar mass diagram. The notations are the same as in panel a. Panel c: optical radius versus rotation velocity diagram. The notations are the same as in panel a. |
| In the text | |
|
Fig. 9. Comparison between the properties of NGC 3521 and the Milky Way. Panel a: comparison between the radial oxygen abundance distributions. The blue circles denote the Te-based abundances in individual H II regions in the Milky Way (comes from panel b of Fig. 2), and the solid line is the best fit to those data. The dark triangles mark the R calibration-based abundances in H II regions in NGC 3521. The crimson plus signs are the P calibration-based abundances in H II regions in NGC 3521, and the dotted line is the linear fit to those data points. Panel b: comparison between rotation curves. The points denote the rotation curve of the Milky Way from Eilers et al. (2019). The line shows the rotation curve of the NGC 3521 from de Blok et al. (2008). |
| In the text | |
|
Fig. 10. Comparison of properties between NGC 4651 and the Milky Way. Panel a: comparison between radial oxygen abundance distributions. The blue circles denote the Te-based abundances in individual H II regions in the Milky Way (comes from panel b of Fig. 2), and the solid line is the best fit to those data. The crimson plus signs are the R calibration-based abundances in H II regions in NGC 4651, and the dotted line is the linear fit to those data points. Panel b: comparison between rotation curves. The points denote the rotation curve of the Milky Way from Eilers et al. (2019). The rotation curve of NGC 4651 from Epinat et al. (2008) is shown with plus signs (approaching side) and crosses (receding side). |
| In the text | |
|
Fig. 11. Comparison of properties between NGC 2903 and the Milky Way. Panel a: comparison between radial oxygen abundance distributions. The blue circles denote the Te-based abundances in individual H II regions in the Milky Way (comes from panel b of Fig. 2), and the solid line is the best fit to those data. The crimson plus signs are the R calibration-based abundances in H II regions of NGC 2903, and the dotted line is the linear fit to those data points. Panel b: comparison between rotation curves. The points denote the rotation curve of the Milky Way from Eilers et al. (2019). The rotation curve of NGC 2903 from de Blok et al. (2008) is shown with the line. |
| In the text | |
|
Fig. 12. Comparison between the properties of the MaNGA galaxy M-8341-09101 and the Milky Way. Panel a: comparison between the radial oxygen abundance distributions. The blue circles denote the Te-based abundances in individual H II regions in the MW (comes from panel b of Fig. 2) and the solid line is the best fit to those data. The grey points are the R calibration-based abundances in the spaxels of M-8341-09101 and the dashed line is the linear fit to those data points. Panel b: comparison between rotation curves. The points denote the rotation curve of the Milky Way from Eilers et al. (2019). The rotation curve of M-8341-09101 is shown by the line. |
| In the text | |
|
Fig. 13. Comparison between the radial oxygen abundance distributions in the MaNGA galaxy M-8983-03703 and the Milky Way. The blue squares are the median values of O/H in bins of 0.05 in the fractional radius R/R25 of M-8983-03703, and the bars show the scatter in O/H around the median values of the bins. The red circles are abundances estimated from other MaNGA measurements (M-7495-12704) of this galaxy. The median values of the oxygen abundances for different measurements were obtained for the same bin, but the positions of the symbols (circles and squares) were shifted slightly along the x-axis for the sake of clarity. The black crosses denote the Te-based abundances of individual H II regions in the Milky Way, while the solid line is the best fit to those data within the optical radius. |
| In the text | |
Current usage metrics show cumulative count of Article Views (full-text article views including HTML views, PDF and ePub downloads, according to the available data) and Abstracts Views on Vision4Press platform.
Data correspond to usage on the plateform after 2015. The current usage metrics is available 48-96 hours after online publication and is updated daily on week days.
Initial download of the metrics may take a while.