| Issue |
A&A
Volume 672, April 2023
|
|
|---|---|---|
| Article Number | A4 | |
| Number of page(s) | 7 | |
| Section | Atomic, molecular, and nuclear data | |
| DOI | https://doi.org/10.1051/0004-6361/202244310 | |
| Published online | 23 March 2023 | |
Electronic spectroscopy of heptacene ions in the search for carriers of diffuse interstellar bands
1
Institut für Ionenphysik und Angewandte Physik, Universität Innsbruck,
Technikerstr. 25,
6020
Innsbruck,
Austria
2
Institut für Atemgasanalytik, Universität Innsbruck,
Innrain 66,
6020
Innsbruck,
Austria
3
Laboratory Astrophysics Group of the MPI for Astronomy at the University of Jena,
Helmholtzweg 3,
07743
Jena,
Germany
e-mail: sergiy.krasnokutskiy@uni-jena.de
4
Institut für Organische Chemie, Universität Tübingen,
Auf der Morgenstelle 18,
72076
Tübingen,
Germany
Received:
20
June
2022
Accepted:
25
December
2022
Context. The absorption bands of the interstellar medium (ISM) in the optical and near-infrared regions called the diffuse interstellar bands (DIBs) have been known for almost a century, yet their origins remain largely unknown. Knowledge of molecular carriers of DIBs would allow for a much better understanding of the chemistry and physics of the ISM. Polycyclic aromatic hydrocarbons (PAHs) and, among them, polyacenes have been suggested as promising candidates for carriers of DIBs.
Aims. In this paper, we report on the spectroscopy of heptacene (Hep), the polyacene molecule consisting of seven aromatic rings in a linear arrangement, in its cationic and anionic forms (Hep+/−). The performed spectroscopic studies made it possible to accurately determine the Hep+/− absorption band positions and to conduct a direct comparison of laboratory and observational spectra.
Methods. We utilized helium-tagging action spectroscopy to measure the spectra of Hep+/− in a wide spectral range of 3000–13 000 Å. In most cases, the spectra obtained by this method can be directly compared with the observational spectra. By analyzing the spectral shift as a function of the number of attached helium atoms, we obtained precise estimates of the gas-phase band positions. Quantum-chemical computations were used to support and interpret the findings. Matrix isolation spectroscopy provided information on the spectral properties of neutral Hep and extended the spectral range for Hep+.
Results. We found several absorption bands characterized by a rather large full width at half maximum in the spectra of Hep+/−. The two most intense bands were found at 4714 ± 5 Å and 12 250 ± 12 Å for Hep+ and at 4673 ± 14 Å and 11326 ± 4 Å for Hep−. We did not find any good match between laboratory and observational spectra. In particular, the intrinsic width of the absorption bands of Hep+/− is much higher than that of most observed DIBs.
Conclusions. The non-detection of Hep+/− in the observational spectra excludes the bottom-up formation route for polyacenes in the ISM. Larger polyacene molecules could still be considered as potential carriers of DIBs in the case of an efficient top-down formation route. All currently measured polyacene ions exhibit relatively broad absorption bands. Therefore, additional spectroscopy studies of neutral polyacenes and larger polyacene ions as well as the study of possible top-down formation routes are suggested.
Key words: ISM: lines and bands / ISM: molecules / molecular data / methods: laboratory: molecular
© The Authors 2023
 Open Access article, published by EDP Sciences, under the terms of the Creative Commons Attribution License (https://creativecommons.org/licenses/by/4.0), which permits unrestricted use, distribution, and reproduction in any medium, provided the original work is properly cited.
This article is published in open access under the Subscribe to Open model. Subscribe to A&A to support open access publication.
1 Introduction
Discovered a century ago (Heger 1922), diffuse interstellar bands (DIBs) are absorption features of the dense regions of the interstellar medium (ISM). In spite of the many studies since their discovery, there is little solid information on the carriers of these bands. The intensities of most DIBs correlate with the amount of dust present in the ISM (Adamson et al. 1991). However, the lack of polarization and the band profiles suggest that the carriers are molecules present in the gas phase (Cox et al. 2011; Galazutdinov et al. 2002). There is also a small class of so-called C2 DIBs whose intensity does not correlate with optical extinction (meaning the amount of dust) but with the abundance of C2 molecules in the gas phase. Recently,  has been confirmed as a carrier of five DIBs (Campbell et al. 2015; Lallement et al. 2018; Rouillé et al. 2021; Schlarmann et al. 2021). Therefore, it is commonly considered that the carriers of DIBs are likely carbonaceous molecules or ions present in the gas phase. Several types of molecules have been suggested for the role of DIB carriers – for a brief review see Snow (2001). Among them, polycyclic aromatic hydrocarbons (PAHs) are one of the most studied classes of molecules. They have been suggested to have a notable abundance in different astrophysical environments (Allamandola et al. 1989; Salama et al. 1994) and often have absorption bands in the spectral range where DIBs are observed. This suggests PAHs as very promising candidates for being DIB carriers. Though there have been many spectral studies devoted to these molecules, for example (Krasnokutski et al. 2005; Meyer et al. 2021; Rouillé et al. 2004; Salama et al. 2011; Staicu et al. 2006), none of the measured absorption spectra of PAHs have shown a coincidence with observed DIBs to date.
In space, PAHs can be formed by both top-down and bottom-up mechanisms (Bierbaum et al. 2011; Jäger et al. 2006; Merino et al. 2014; Zhao et al. 2016). High-temperature bottom-up synthesis of PAHs was found to occur mainly through anthracene and phenanthrene molecules (Jäger et al. 2006), which are among the smallest PAHs that are photostable in the molecular area of the ISM in its neutral state (Jochims et al. 1999). Thus, missing absorption of anthracene and phenanthrene molecules in observational spectra (Gredel et al. 2011; Meyer et al. 2021) reduces the chances that PAHs formed in a bottom-up pathway can be carriers of DIBs. The top-down formation of PAHs is not well understood. Assuming that top-down pathways may allow for the formation of elongated PAH molecules, the family of polyacene molecules with about 10 to 18 rings has been suggested as a possible carrier of DIBs (Omont et al. 2019).
Polyacenes have several important properties that allow us to consider them as possible DIB carriers. First, the large members of the polyacenes that are expected to be stable in the ISM are also thought to have very strong absorption bands in the visible range. Therefore, even a small amount of formed polyacenes would result in a detectable absorption. An estimation has shown that even 10 ppm of the total PAH abundance is enough to account for medium-strength DIBs (Omont et al. 2019). This indicates that even in the case of the predominance of pericondensed PAHs, polyacenes can still be DIB carriers. Second, for the same size range, the number of polyacene molecules is tremendously smaller compared to the overall number of PAHs, which reduces the number of possible PAH isomers that should be formed in the ISM. On the other hand, the number of isomers increases rapidly with size for non-acene PAHs, resulting in a very large number of absorption bands that far exceeds the number of DIBs. These bands can even overlap and create an absorption continuum (Steglich et al. 2012). However, long polyacenes are more reactive than other PAH molecules (Mattioda et al. 2014; Biermann & Schmidt 1980). Therefore, they are likely destroyed more quickly via chemical reactions in the ISM (Krasnokutski et al. 2017). Nonetheless, given the previous studies indicating the strong possibility of polyacenes contributing to the DIBs combined with the lack of knowledge regarding polyacenes formation and destruction rates in the ISM, these molecules should still be analyzed.
Currently, the charge states of DIB carriers are not yet known. And in the case of the C60 molecule, only bands associated with cations can be detected in observations (Campbell & Maier 2017; Maier & Campbell 2017; Rouillé et al. 2021). While not surprising, considering the high flux of UV photons available in the ISM, this suggests that other molecules present in the same environments should also be ionized to a notable fraction. Jochims et al. (1999) has established that all studied polyacenes have a favorable structure for photostability. For such stable structures, the smallest photostable cation is predicted to contain at least 30 carbon atoms, exactly the size of the hep-tacene (Hep) molecule. At the same time, the photostability index of polyacenes decreases with increasing size. Therefore, larger molecular sizes may be required to achieve photostability of polyacene cations. Yet almost all molecules found in space to date, even in photon-dominated regions, are not photostable as cations.
In this work, we performed a set of laboratory measurements to characterize the spectral properties of the Hep molecule and probe its presence in the ISM. Helium-tagging spectroscopy was performed to reveal the spectra of Hep+/− in a wide spectral range and to allow us to obtain accurate parameters of the absorption bands of these species in the gas phase and search for the absorption of Hep+/− in observational spectra. Previous results from matrix isolation spectroscopy (Bettinger et al. 2007) were used to obtain information on neutral Hep molecules.
2 Methods
Superfluid helium nanodroplets (HNDs) with a mean droplet size of a few million helium atoms (Gomez et al. 2011) were formed in a supersonic expansion of pressurized helium gas (2.5–2.7 MPa stagnation pressure for measurements of cations and 2.8–3.0 MPa stagnation pressure for measurements of anions, 99.9999% purity) through a precooled pinhole nozzle (9.5–9.9 K for cations, 9.4–9.6 K for anions, 5 µm orifice diameter) into vacuum. The HNDs were ionized via electron impact after passing through a skimmer of 0.8 mm in diameter. The droplets were positively charged after impact with 50 eV electrons, resulting in an average charge state of about +10 (Laimer et al. 2019), or negatively charged after impact with 27 eV electrons, with a subsequent average charge state of about –2 (Laimer et al. 2021). Coulomb repulsion between the charge centers distributed charges in regular patterns close to the surface of the HNDs, where they serve as nucleation centers for cluster growth. The charged HNDs then passed through a pick-up chamber and were doped with Hep vaporized in a resistively heated oven kept at 180°C (Hep+) or 185°C (Hep−) and where solid diheptacene underwent cycloreversion to Hep molecules (Einholz et al. 2017). The first Hep molecule approaching a charge center in the HND became ionized via charge transfer. In the case of cations, charge centers were most likely linear  cores solvated by a dense layer of He atoms (Mateo & Eloranta 2014). The potential energy of these charge centers either led to single or double ionization of a Hep molecule. In the case of single ionization, the difference in the ionization energy of the dopant and the potential energy of the charge center that was more than 10 eV would be transferred into the Hep cation. However, we observed only intact, singly charged Hep cations in the experiment. This is likely a consequence of the efficient energy dissipation to the surrounding He matrix followed by evaporation of 1600 helium atoms per eV from the large droplet (Albertini et al. 2021; Ellis & Yang 2015) and the fact that doubly charged dopants are prone to Coulomb explosion when a second dopant attaches and forms two singly charged dopants (Mahmoodi-Darian et al. 2018). In the case of anions, the initial charge center was either an electron bubble or a metastable He*− (He2*−). Both the fragmentation of dopants upon electron attachment (Mauracher et al. 2018) and the formation of dianions (Mauracher et al. 2014) were previously observed in HNDs. However, in comparison to the cationic measurements, only intact, singly charged Hep anions were observed. In the present experiment, the dopant cluster ions were extracted from the large HNDs upon collision with a polished stainless steel surface at a normal incidence angle (Martini et al. 2021). The extracted ions were guided by weak electrostatic fields into a time-of-flight mass spectrometer (TOF-MS; Tofwerk AG model HTOF, operated at 10 kHz) oriented orthogonally with respect to the HND beam. Mass spectra were recorded with a mass resolving power of approximately m/Δm = 1800 for cations and m/Δm = 1300 for anions. Most of the extracted ions were decorated with up to several tens of helium atoms (Meyer et al. 2021; Schiller et al. 2021; Martini et al. 2021). To perform action spectroscopy through monitoring of the photodissociation of helium-tagged Hep ions, a tunable pulsed laser (EKSPLA NT242; pulse energy up to 450 µJ, laser bandwidth <3.5 cm−1, 1 kHz repetition rate) was overlapped with the beam of extracted ions. Mass spectra (action mass spectra) with and without laser illumination (background mass spectra) were recorded almost simultaneously by synchronizing the laser with the TOF-MS and saving every tenth extraction pulse (when the laser was on) into the first section. The following nine extraction pulses (when the laser was off) were saved into the next sections of a multichannel scaler card. Photon absorption by helium-tagged dopant ions led to the evaporation of helium atoms and therefore a change in the recorded ion yields, namely an increase of the signal of the photoproduct (i.e., Hep+/−) and a decrease of the ion yield of He-tagged Hep ions. By scanning the laser wavelength and comparing the corresponding action and background mass spectra as a function of the laser wavelength, an absorption spectrum was generated. Separate wavelength scans were performed in the range from 300 nm to 1260 nm for cations and between 370 nm and 1300 nm for anions, with a step size of 0.2 nm. The method was expected to provide spectra very similar to the spectra of ions in the gas phase. The determination of
  as a DIB carrier was made based on a direct comparison of helium tagging and observational spectra (Campbell et al. 2015).
The spectra of matrix isolated Hep+/− presented in the current article were taken from earlier work by the Bettinger group (Bettinger et al. 2007). The matrix isolation setup and formation of matrix isolated Hep is described in detail in the group’s publication. In short, the Hep photoprecursor 7,16-dihydro-7,16-ethanoheptacene-19,20-dione is evaporated from an oven at approximately 225 °C. The flux of these molecules together with Ar gas and about 1% of CH2Cl2 is frozen onto a substrate, cooled down to 15 K, and placed in a vacuum chamber with a pressure of about 10−5 mbar under deposition conditions. After irradiation (λ > 385 nm, 14.25 h), Hep molecules are formed from the above-mentioned photoprecursor. The ionization of Hep and formation of Hep+ is achieved by irradiation (λ = 185 nm, 30 min) of the matrix. Molecular geometries and vibrational frequencies of Hep+ in the ground and exited states are obtained with density-functional theory (DFT) and time-dependent density-functional theory (TDDFT) methods, respectively, at the B3LYP/6-311+G(d,p) level using the Gaus-sian16 package (Frisch et al. 2016). To simulate the absorption spectrum, multidimensional Franck-Condon factors are calculated using Gaussian16. Finally, a Boltzmann distribution is used to simulate a spectrum at 10 K. The observational spectra used in this research for comparison with the laboratory measurements were obtained from the ESO Science Archive Facility (data files ADP.2014-05-15T16_14_28.703 and ADP.2018-11-22T14_15_19.781).
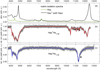 |
Fig. 1 Laboratory spectra of Hep+/0/−. (a) Absorption spectra of Hep and Hep+ isolated in an Ar matrix at 15 K. The weak sinusoidal oscillation in the NIR range is not a real absorption and is associated with an interference. The Hep+ spectrum was recorded after irradiation of matrix-isolated Hep with 185 nm photons for 30 min. (b) Photodissociation spectrum of Hep+ obtained by monitoring the ion signals on the masses of Hep+He1−30 as a function of the laser wavelength. (c) Photodissociation spectrum of Hep− obtained by monitoring the ion signals on the masses of Hep−He1−30 as a function of the laser wavelength. The parameters of peaks marked with asterisks in panel (b) and the shoulder marked by an arrow in panel (c) cannot be reliably defined. |
3 Results and discussion
Figure 1a shows the spectra of matrix-isolated neutral Hep and Hep+ as described in Sect. 2 and by Bettinger et al. (2007). The spectrum after irradiation (labeled Hep+ (with Hep)) mainly displays the spectral features of cations. However, some bands that are also found in the neutral spectrum (labeled Hep), most notably between 6000 and 8000 Å, can be assigned to residual neutral molecules still present after irradiation. Hep and Hep+ have several absorption bands lying in the visible range, while Hep+ also has a strong band in the near-infrared (NIR). As can be seen in Fig. 1a, the absorption bands of cations are much more intense compared to that of the neutral molecule. Our calculations also show a much higher oscillator strength of the electronic transitions of the cations in the spectral range covered by the experiment. Hep has strong absorption bands in the UV range. We note that the spectrum of matrix-isolated Hep+ also shows a weak absorption band at roughly 21 340 Å, which was assigned to the first electronic transition (Bettinger et al. 2007). However, the intensity of this absorption band is quite weak, and it is therefore not well suited for the detection of Hep+ in space. The computed oscillator strength of the most intense 2Au(0) ← 2B2g(0) transition. The spectra of Hep+ is about 0.4, which is more than 10 times higher than the oscillator strength of any electronic transition of the neutral molecule in the spectral range where DIBs are observed. The strong transitions of the neutral molecule lie in the UV range, where no DIBs were detected. Non-detection of absorption bands of neutral molecules can be explained by these bands having a high width in the gas phase. This large width of the spectral bands would exclude the possibility of these bands being detected in the observational spectra. A good example here is  , whose strong but broad UV bands were not detected in observational spectra. Therefore, the most promising way to detect Hep molecules in space is to search for the NIR absorption bands of Hep cations in observational spectra.
Figure 2 shows the comparison of the spectra of Hep+/− obtained by using the described matrix isolation, He-tagging, and quantum chemical methods in the range of the most intense 2Au(0) ← 2B2g(0) transition. The spectra of Hep+ and Hep− are similar. The position of the 0–0 bands in the spectra of cations and anions are 12265 Å and 11 330 Å, respectively. The vibrational frequencies associated with vibronic bands are also quite similar. However, the width of vibronic bands of anions is much larger. The width of the Hep− absorption bands, as observed with the helium-tagging method, is similar to those observed in the matrix isolation spectrum for Hep+. This may be at least partly due to the lower intensity of these bands and, accordingly, the lower signal-to-noise ratio, which makes it impossible to resolve these bands in the experimental spectrum. This notable difference in relative intensities of vibronic bands is likely due to the saturation of the very strong 0–0 band in the Hep+ spectrum. This was confirmed by calculations that show similar intensities of vibronic bands in the spectra of Hep+ and Hep− and have a closer match to the spectrum of anions. Moreover, the relative intensities of vibronic bands of Hep+ reduce with decreasing laser power. The greatest discrepancy between the measured intensities was observed for the vibronic bands at 11 071 and 11 355 Å. The computational spectrum shows only a number of very weak absorption bands in this region. This complicates the unambiguous attribution of these bands to the excitation of certain vibrational modes.
However, the intensities of all vibronic bands in all spectra are considerably lower compared to that of the 0–0 band. Therefore, they are poorly suited for searching for Hep in observational spectra. Based on our measurements, we selected the 2Au(0) ← 2B2g(0) transition band for this purpose. The precise positions of the absorption bands of species in the gas phase are required to be able to search for their absorption in observational spectra. In order to correctly account for the shift caused by the attachment of He atoms, we compared the spectra of Hep+Hen with different n, as shown in Fig. 3. The attachment of each He atom caused a small blueshift, and the peak positions of the absorption bands exhibited a linear dependence on n. As shown in Fig. 3b, the extrapolation of the linear fit of the band positions (λmax) to n = 0 revealed a position of the 2Au(0) ← 2B2g(0) band of Hep+ in the gas phase of λmax = 12250.2 ± 12.4 Å. The relatively high uncertainty of the peak position was due to the high width of the band. The full width at half maximum (FWHM) of this band is equal to (120 ± 20 Å). As shown previously, the 0–0 band in the spectrum of cations was saturated. This resulted in an increase in the FWHM of this band. In order to reveal the accurate value of the FWHM, we decreased the laser intensity to the lowest value that still allowed for reliable measurements. With these settings, we obtained a FWHM of 41 ± 5.1 Å. Unfortunately, these settings did not allow us to measure weaker absorption bands. The positions and FWHMs of the most intense peaks are listed in Table 1. The peaks marked with asterisks in Fig. 1 are not listed in Table 1 because their signal-to-noise ratios were very low, making it impossible to reliably determine their parameters.
The abundance of PAH anions is usually considered to be quite low in diffuse and translucent clouds (Le Page et al. 2003). However, by increasing the local density, the abundance of anions should increase. If these anions had strong absorption bands, they could also be detected in observational spectra. Therefore, we also measured the spectra of Hep−. The spectrum of Hep−He1–30 in the full measured range can be seen in Fig. 1c. It has a strong NIR absorption band at 11326 Å but no detectable absorption in the visible range down to a weak absorption band at 5042 Å. All observed spectral bands of Hep− are intrinsically quite broad, which either complicates or makes practically impossible the detection of these bands in observational spectra. The FWHM of the most intense NIR peak is about 100 Å, while the most intense peak in the visible range has a FWHM of about 80 Å. The most intense NIR peak has a long tail toward longer wavelengths. This profile can be best fitted by including an additional peak at the position marked with an arrow in Fig. 1c. However, since computations predict only one electronic transition in this region and hot bands cannot be observed in our spectra, such an additional band at lower energy compared to the 0–0 band cannot be simply rationalized. Therefore, the origin of this Hep− absorption band profile remains unclear.
To estimate the accurate band positions of Hep− in the gas phase, we performed the same analysis as in the case of cations. The positions of the peaks of Hep−Hen were plotted against n and extrapolated to n = 0. The positions of the two most intense bands of Hep− were derived as λmax =11 326 ± 4 Å and 4673 ± 14 Å.
In the literature, there are no reported DIBs that match the absorption bands of Hep+/−. However, the observational spectra in this wavelength range are heavily contaminated by telluric bands. Moreover, the absorption bands of Hep+/− are intrinsically quite broad, which may complicate their detection in the observational spectra. To better understand the possibility of detecting these bands and in an attempt to estimate the upper limits of Hep+/− abundances, we compared the experimentally obtained bands, corrected for the shift caused by the addition of He atoms, with observational spectra along the lines of sight towards HD 183 143 and HD 172 028. The first line of sight probes a characteristic DIB object, where most of the DIBs were detected. However, this object has a low abundance of C2 molecules, which correlates with the intensities of the C2 DIBs. Therefore, we also selected the line of sight toward HD 172028, where strong absorption bands of C2 molecules were observed (Gredel 1999). As can be seen in Fig. 4, we can confidently conclude that the most intense band of Hep+ is not detected in the observational spectra along these lines of sight. Since Hep+ is not a carrier of any DIBs and the absorption bands of the neutral molecule are very weak in the visible range, the same conclusion can be applied to Hep. The intensities of its absorption bands are more than an order of magnitude lower than those of the 2Au(0) ← 2B2g(0) band of Hep+. In the areas where DIBs are detected, we would expect some notable level of ionization for any molecule. In the case of the C60 molecule, the level of ionization is at least 30% and could be much higher since no DIBs associated with neutral C60 molecules have been detected (Rouillé et al. 2021). Therefore, the non-detection of the strong 2Au(0) ← 2B2g(0) absorption band of Hep+ excludes the possibility that weak bands of Hep can be detected. Moreover, no DIBs were detected in the UV range where Hep has strong absorption bands. Analogously to Hep+, the search for the absorption bands of Hep− in the observational spectra was unsuccessful.
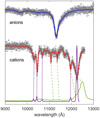 |
Fig. 2 Comparison of the Hep+/− spectra obtained by using the He-tagging (Hep+/−He1–30) method (upper curves) with the absorption spectrum of Hep+ isolated in an Ar matrix (green spectrum) and with the calculated spectrum computed at B3LYP/6-311+G(d,p) level (the lowest curve, purple). The open circles in the He-tagged spectra are measured data, while the solid curves (red, blue) were obtained by fitting multiple Lorentz curves to the measured data. |
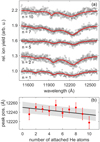 |
Fig. 3 Dependence of Hep+Hen spectra on n. (a) Photodissociation spectra of Hep+Hen. (b) The positions of the peak maxima of the most intense 2Au(0) ← 2B2g(0) band of Hep+Hen as function of n. |
Positions and FWHMs of absorption peaks of helium-tagged cationic and anionic Hep.
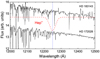 |
Fig. 4 Comparison of observational spectra along the lines of sight HD 183143 and HD 172028 with the most intense 2Au(0) ← 2B2g(0) band of Hep+ with the parameters evaluated for the gas phase. The vertical dashed line marks the position of the peak maximum of this band. |
4 Astrophysical implications
In order for any class of molecules to be a DIB carrier, a number of requirements must be satisfied. First, the molecules should have absorption features in the range where DIBs are detected and at the same time must not have strong absorption features in the wavelength range where there are no DIBs. In addition, the species should be capable of reaching a notable abundance in the ISM. Therefore, they should either be very stable against all destructive processes available in these regions or have very efficient formation pathways under the conditions of the ISM. In this section, we evaluate the polyacenes with respect to these requirements.
There are two main pathways of molecular destruction in the ISM: photodissociation of the molecules and destruction through chemical reactions. Polyacenes should be quite stable against photodissociation in the ISM. Jochims et al. (1999) found that already the smallest polyacene, the anthracene molecule is stable in the neutral state in the H I regions of the ISM. In the same study, all studied polyacenes were found to have a structure resulting in a high photostability index. However, the chemical stability of large polyacenes is less evident, as they become more reactive with increasing molecular size (Zade & Bendikov 2012). This may result in their efficient destruction after collisions with other species present in the gas phase in the same areas. In particular, the collision with atomic carbon could have a major impact on their abundances (Krasnokutski et al. 2017). Therefore, efficient formation of these molecules in the ISM is required so that they can be carriers of DIBs. The low estimated abundance of naphthalene (McGuire et al. 2021) as well as the non-detection of anthracene+/0/− (Gredel et al. 2011; Meyer et al. 2021) and Hep+/− (this study) suggest that polyacenes are not efficiently formed by bottom-up chemistry. The other possibility is the top-down formation, as suggested in the original study (Omont et al. 2019). At present, there is practically no reliable information about the top-down formation route of PAHs. Therefore, more studies in this direction are required to be able to predict the abundances of large polyacenes in the ISM.
An increase in the size of PAH molecules shifts the charge state balance toward cations (Andrews et al. 2016; Le Page et al. 2003). Moreover, the shift of charge state from positive to negative with increasing local density in a molecular cloud is expected for molecules present in the gas phase. At the same time, the intensities of most DIBs also increase with the optical extinction Av. The DIBs associated with  show the same behavior. This can be an indication that at least at lower Av, C60 cations are much more abundant compared to neutral C60. Therefore, in molecular clouds, one should also expect the presence of a significant, probably predominant, number of cations for large polyacenes, especially at lower Av.
Notably, Hep+ has strong absorption bands in the NIR range, where only a few DIBs were detected. With increasing molecular size, the corresponding bands further shifts to the IR range (Tönshoff & Bettinger 2010; Mattioda et al. 2005; Weisman et al. 2005). The width of the absorption bands in He-tagging spectra of all measured polyacene cations is relatively high. This is probably due to the short lifetimes of the excited states. Therefore, if any DIBs in the visible range were caused by the absorption of neutral polyacenes, a number of very broad absorption bands should be present in the observational spectra in the NIR and IR ranges. This was not observed, but we should mention the considerable difficulties associated with the detection of such wide absorption bands. A set of very strong but broad absorption bands in the visible range was only recently detected using a space-based instrument (Massa et al. 2020). It should be noted that, even in this study, it was not possible to detect the very intense but wide UV absorption bands of  , while its weaker but narrower bands in the NIR range have long been known as DIBs. We did not find a clear discussion about the sensitivity of the detection of such wide absorption bands in observational spectra in the literature. Therefore, we do not provide an upper limit for the abundance of Hep+ in our article.
Since many cations of astrophysical interest have broad absorption bands, attention should be paid to their detection in observational spectra. In particular, a straightforward method for estimating the sensitivity of detecting these bands in the observational spectra would be useful. As all measured bands of polyacene cations were found to be quite broad, we can conclude that the width of the absorption band of neutral molecules must be much smaller compared to the absorption band of cations in order for them to be considered as DIB carriers.
5 Conclusions and outlook
The performed studies allow us to state that Hep+/0/− are not the carriers of DIBs. Since Hep+ may not be large enough to be photostable in the ISM, more studies of at least a few larger polyacene cations should be conducted to test the polyacene-DIB hypothesis and draw a conclusion about the properties of the whole class of these molecules. Since Hep is currently the largest polyacene molecule to be successfully brought into the gas phase, this approach does not appear to be feasible in the near future. Another possible way to test the polyacene-DIB hypothesis is to perform measurements of intense absorption bands of neutral polyacenes in the gas phase. These measurements would allow for characterization of the electronic transitions that are expected to be responsible for the absorption bands associated with DIBs. In particular, the width of these absorption bands would be of interest. Finally, studying the top-down formation route of PAHs would also be extremely interesting, as the formation of strongly elongated structures or even polyacenes in experiments could be strong arguments in favor of the polyacene-DIB theory.
Acknowledgements
The work of M.K. and A.S. was supported by the FWF, projects I4130 and P31149. S.A.K. is grateful for the support by the Max Plank Institute for Astronomy and by the Deutsche Forschungsgemeinschaft DFG (grant no. KR 3995/4-2).
References
- Adamson, A.J., Whittet, D.C.B., & Duley, W.W. 1991, MNRAS, 252, 234 [NASA ADS] [CrossRef] [Google Scholar]
- Albertini, S., Hechenberger, F., Kollotzek, S., et al. 2021, Int. J. Mass Spectrom., 459, 116472 [NASA ADS] [CrossRef] [Google Scholar]
- Allamandola, L.J., Tielens, A.G.G.M., & Barker, J.R. 1989, ApJS, 71, 733 [NASA ADS] [CrossRef] [Google Scholar]
- Andrews, H., Candian, A., & Tielens, A.G.G.M. 2016, A&A, 595, A23 [NASA ADS] [CrossRef] [EDP Sciences] [Google Scholar]
- Bettinger, H.F., Mondal, R., & Neckers, D.C. 2007, Chem. Commun., 1, 5209 [CrossRef] [Google Scholar]
- Biermann, D., & Schmidt, W. 1980, JACS, 102, 3163 [CrossRef] [Google Scholar]
- Bierbaum, V., Le Page, V., & Snow, T. 2011, EAS Publ. Ser., 46, 427 [NASA ADS] [CrossRef] [EDP Sciences] [Google Scholar]
- Campbell, E.K., & Maier, J.P. 2017, J. Chem. Phys., 146, 160901 [CrossRef] [Google Scholar]
- Campbell, E.K., Holz, M., Gerlich, D., & Maier, J.P. 2015, Nature, 523, 322 [NASA ADS] [CrossRef] [Google Scholar]
- Cox, N.L.J., Ehrenfreund, P., Foing, B.H., et al. 2011, A&A, 531, A25 [NASA ADS] [CrossRef] [EDP Sciences] [Google Scholar]
- Einholz, R., Fang, T., Berger, R., et al. 2017, JACS, 139, 4435 [CrossRef] [Google Scholar]
- Ellis, A.M., & Yang, S.-f. 2015, Chinese J. Chem. Phys., 28, 489 [NASA ADS] [CrossRef] [Google Scholar]
- Frisch, M.J., Trucks, G.W., Schlegel, H.B., et al. 2016, Gaussian~16 Revision C.01 (Wallingford, CT: Gaussian Inc.) [Google Scholar]
- Galazutdinov, G., Moutou, C., Musaev, F., & Krelowski, J. 2002, A&A, 384, 215 [NASA ADS] [CrossRef] [EDP Sciences] [Google Scholar]
- Gomez, L.F., Loginov, E., Sliter, R., & Vilesov, A.F. 2011, JCP, 135, 154201 [Google Scholar]
- Gredel, R. 1999, A&A, 351, 657 [NASA ADS] [Google Scholar]
- Gredel, R., Carpentier, Y., Rouillé, G., et al. 2011, A&A, 530, A26 [CrossRef] [EDP Sciences] [Google Scholar]
- Heger, M. 1922, Lick Observ. Bull., 10, 146 [Google Scholar]
- Jäger, C., Krasnokutski, S., Staicu, A., et al. 2006, ApJS, 166, 557 [CrossRef] [Google Scholar]
- Jochims, H.W., Baumgärtel, H., & Leach, S. 1999, ApJ, 512, 500 [NASA ADS] [CrossRef] [Google Scholar]
- Krasnokutski, S., Rouillé, G., & Huisken, F. 2005, Chem. Phys. Lett., 406, 386 [NASA ADS] [CrossRef] [Google Scholar]
- Krasnokutski, S.A., Huisken, F., Jäger, C., & Henning, T. 2017, ApJ, 836, 32 [NASA ADS] [CrossRef] [Google Scholar]
- Laimer, F., Kranabetter, L., Tiefenthaler, L., et al. 2019, Phys. Rev. Lett., 123, 165301 [NASA ADS] [CrossRef] [Google Scholar]
- Laimer, F., Zappa, F., Scheier, P., & Gatchell, M. 2021, Chemistry, 27, 7283 [CrossRef] [Google Scholar]
- Lallement, R., Cox, N.L.J., Cami, J., et al. 2018, A&A, 614, A28 [NASA ADS] [CrossRef] [EDP Sciences] [Google Scholar]
- Le Page, V., Snow, T.P., & Bierbaum, V.M. 2003, ApJ, 584, 316 [NASA ADS] [CrossRef] [Google Scholar]
- Mahmoodi-Darian, M., Raggl, S., Renzler, M., et al. 2018, J. Chem. Phys., 148, 174303 [NASA ADS] [CrossRef] [Google Scholar]
- Maier, J.P., & Campbell, E.K. 2017, Angew. Chem. Int. Ed., 56, 4920 [CrossRef] [Google Scholar]
- Martini, P., Albertini, S., Laimer, F., et al. 2021, Phys. Rev. Lett., 127, 263401 [NASA ADS] [CrossRef] [Google Scholar]
- Massa, D., Fitzpatrick, E.L., & Gordon, K.D. 2020, ApJ, 891, 67 [NASA ADS] [CrossRef] [Google Scholar]
- Mateo, D., & Eloranta, J. 2014, J. Phys. Chem. A, 118, 6407 [NASA ADS] [CrossRef] [Google Scholar]
- Mattioda, A.L., Hudgins, D.M., & Allamandola, L.J. 2005, ApJ, 629, 1188 [NASA ADS] [CrossRef] [Google Scholar]
- Mattioda, A.L., Bauschlicher, C.W., Bregman, J.D., et al. 2014, Spectrochim. Acta A, 130, 639 [NASA ADS] [CrossRef] [Google Scholar]
- Mauracher, A., Daxner, M., Huber, S.E., et al. 2014, Angew. Chem. Int. Ed., 53, 13794 [CrossRef] [Google Scholar]
- Mauracher, A., Echt, O., Ellis, A.M., et al. 2018, Phys. Rep., 751, 1 [NASA ADS] [CrossRef] [Google Scholar]
- McGuire, B.A., Loomis, R.A., Burkhardt, A.M., et al. 2021, Science, 371, 1265 [NASA ADS] [CrossRef] [Google Scholar]
- Merino, P., Svec, M., Martinez, J.I., et al. 2014, Nat. Commun., 5, 3054 [NASA ADS] [CrossRef] [Google Scholar]
- Meyer, M., Martini, P., Schiller, A., et al. 2021, ApJ, 913, 136 [NASA ADS] [CrossRef] [Google Scholar]
- Omont, A., Bettinger, H.F., & Tonshoff, C. 2019, A&A, 625, A41 [NASA ADS] [CrossRef] [EDP Sciences] [Google Scholar]
- Rouillé, G., Krasnokutski, S., Huisken, F., et al. 2004, J. Chem. Phys., 120, 6028 [CrossRef] [Google Scholar]
- Rouillé, G., Krasnokutski, S., & Carpentier, Y. 2021, A&A, 656, A100 [NASA ADS] [CrossRef] [EDP Sciences] [Google Scholar]
- Salama, F., Joblin, C., & Allamandola, L.J. 1994, J. Chem. Phys., 101, 10252 [NASA ADS] [CrossRef] [Google Scholar]
- Salama, F., Galazutdinov, G.A., Krelowski, J., et al. 2011, ApJ, 728, 154 [NASA ADS] [CrossRef] [Google Scholar]
- Schiller, A., Meyer, M., Martini, P., et al. 2021, J. Phys. Chem. A, 125, 7813 [NASA ADS] [CrossRef] [Google Scholar]
- Schlarmann, L., Foing, B., Cami, J., & Fan, H. 2021, A&A, 656, L17 [NASA ADS] [CrossRef] [EDP Sciences] [Google Scholar]
- Snow, T.P. 2001, Spectrochim. Acta A, 57, 615 [NASA ADS] [CrossRef] [Google Scholar]
- Staicu, A., Krasnokutski, S., Rouillé, G., Henning, T., & Huisken, F. 2006, J. Mol. Struct., 786, 105 [NASA ADS] [CrossRef] [Google Scholar]
- Steglich, M., Carpentier, Y., Jäger, C., et al. 2012, A&A, 540, A110 [NASA ADS] [CrossRef] [EDP Sciences] [Google Scholar]
- Tönshoff, C., & Bettinger, H.F. 2010, Angew. Chem. Int. Ed., 49, 4125 [CrossRef] [Google Scholar]
- Weisman, J.L., Mattioda, A., Lee, T.J., et al. 2005, PCCP, 7, 109 [CrossRef] [Google Scholar]
- Zade, S.S., & Bendikov, M. 2012, J. Phys. Org. Chem., 25, 452 [CrossRef] [Google Scholar]
- Zhao, T.Q., Li, Q., Liu, B.S., et al. 2016, PCCP, 18, 3489 [NASA ADS] [CrossRef] [Google Scholar]
All Tables
Positions and FWHMs of absorption peaks of helium-tagged cationic and anionic Hep.
All Figures
|
Fig. 1 Laboratory spectra of Hep+/0/−. (a) Absorption spectra of Hep and Hep+ isolated in an Ar matrix at 15 K. The weak sinusoidal oscillation in the NIR range is not a real absorption and is associated with an interference. The Hep+ spectrum was recorded after irradiation of matrix-isolated Hep with 185 nm photons for 30 min. (b) Photodissociation spectrum of Hep+ obtained by monitoring the ion signals on the masses of Hep+He1−30 as a function of the laser wavelength. (c) Photodissociation spectrum of Hep− obtained by monitoring the ion signals on the masses of Hep−He1−30 as a function of the laser wavelength. The parameters of peaks marked with asterisks in panel (b) and the shoulder marked by an arrow in panel (c) cannot be reliably defined. |
| In the text | |
|
Fig. 2 Comparison of the Hep+/− spectra obtained by using the He-tagging (Hep+/−He1–30) method (upper curves) with the absorption spectrum of Hep+ isolated in an Ar matrix (green spectrum) and with the calculated spectrum computed at B3LYP/6-311+G(d,p) level (the lowest curve, purple). The open circles in the He-tagged spectra are measured data, while the solid curves (red, blue) were obtained by fitting multiple Lorentz curves to the measured data. |
| In the text | |
|
Fig. 3 Dependence of Hep+Hen spectra on n. (a) Photodissociation spectra of Hep+Hen. (b) The positions of the peak maxima of the most intense 2Au(0) ← 2B2g(0) band of Hep+Hen as function of n. |
| In the text | |
|
Fig. 4 Comparison of observational spectra along the lines of sight HD 183143 and HD 172028 with the most intense 2Au(0) ← 2B2g(0) band of Hep+ with the parameters evaluated for the gas phase. The vertical dashed line marks the position of the peak maximum of this band. |
| In the text | |
Current usage metrics show cumulative count of Article Views (full-text article views including HTML views, PDF and ePub downloads, according to the available data) and Abstracts Views on Vision4Press platform.
Data correspond to usage on the plateform after 2015. The current usage metrics is available 48-96 hours after online publication and is updated daily on week days.
Initial download of the metrics may take a while.