| Issue |
A&A
Volume 663, July 2022
|
|
|---|---|---|
| Article Number | A28 | |
| Number of page(s) | 21 | |
| Section | Extragalactic astronomy | |
| DOI | https://doi.org/10.1051/0004-6361/202142760 | |
| Published online | 08 July 2022 | |
The molecular gas properties in local Seyfert 2 galaxies⋆
1
INAF – Osservatorio Astrofisico di Arcetri, Largo E. Fermi 5, 50125 Firenze, Italy
e-mail: francesco.salvestrini@inaf.it
2
Dipartimento di Astronomia “Augusto Righi”, Università degli Studi di Bologna, Viale Carlo Berti Pichat 6/2, 40127 Bologna, Italy
3
INAF – Osservatorio di Astrofisica e Scienza dello Spazio di Bologna, Via Gobetti 93/3, 40129 Bologna, Italy
4
ESO, Karl-Schwarzschild-Str 2, 85748 Garching bei München, Germany
5
INAF – Istituto di Radioastronomia, Via P. Gobetti 101, 40129 Bologna, Italy
6
Department of Physics and Astronomy, Clemson University, Kinard Lab of Physics, Clemson, SC 29634, USA
7
Department of Space, Earth and Environment Chalmers University of Technology, 412 96 Gothenburg, Sweden
8
Italian ALMA Regional Centre, Via P. Gobetti 101, 40129 Bologna, Italy
Received:
26
November
2021
Accepted:
25
March
2022
Aims. We present a multiwavelength study of the molecular gas properties of a sample of local Seyfert 2 galaxies to assess if, and to what extent, the presence of an active galactic nucleus (AGN) can affect the interstellar medium (ISM) properties in a sample of 33 local Seyfert 2 galaxies.
Methods. We compare the molecular gas content (MH2) derived from new and archival low-J CO line measurements of a sample of AGN and a control sample of star-forming galaxies (SFGs). Both the AGN and the control sample are characterized in terms of host-galaxy properties, for example stellar and dust masses (M⋆ and Mdust, respectively) and the star formation rate (SFR). We also investigate the effect of AGN activity on the emission of polycyclic aromatic hydrocarbon (PAH) molecules in the mid-infrared (MIR), a waveband where the dust-reprocessed emission from the obscured AGN contributes the most.
Result. The AGN hosted in less massive galaxies (i.e., M⋆ < 1010.5 M⊙; Mdust < 107.5 M⊙) show larger molecular gas contents with respect to SFGs that have the same stellar and dust masses. When comparing their depletion times (tdep ∝ MH2/SFR), AGN show tdep ∼ 0.3 − 1.0 Gyr, similar to the times observed in the control sample of SFGs. Seyfert 2 galaxies show fainter PAH luminosity the larger the dominance of the nuclear activity in the MIR.
Conclusions. We find no clear evidence for a systematic reduction in the molecular gas reservoir at galactic scales in Seyfert galaxies with respect to SFGs. This is in agreement with recent studies that show that molecular gas content is only reduced in sub-kiloparsec-sized regions, where emission from the accreting supermassive black hole dominates. Nonetheless, we show that the impact of AGN activity on the ISM is clearly visible as a suppression of the PAH luminosity.
Key words: galaxies: Seyfert / galaxies: ISM / galaxies: nuclei
The new APEX spectra are only available at the CDS via anonymous ftp to cdsarc.u-strasbg.fr (130.79.128.5) or via http://cdsarc.u-strasbg.fr/viz-bin/cat/J/A+A/663/A28
© ESO 2022
1. Introduction
The star formation (SF) activity in galaxies can be affected by the presence of an accreting supermassive black hole (SMBH). Active galactic nuclei (AGN) have been known to both suppress and enhance the SF activity in their host galaxy (e.g., Feruglio et al. 2010; Cano-Díaz et al. 2012; Cicone et al. 2014; Carniani et al. 2015; Fiore et al. 2017; Cresci & Maiolino 2018), through negative and positive feedback, respectively. For instance, by injecting a large amount of energy into the circumnuclear region, the AGN may prevent the gravitational collapse of molecular clouds, and hence the formation of new stars, in processes referred to as “negative” feedback (e.g., Ellison et al. 2021).
In recent years, a multitude of studies have been dedicated to the investigation of the physical properties of the molecular gas in galaxies, aimed at understanding the effect of nuclear activity on gas kinematics (feeding and feedback; e.g., García-Burillo et al. 2003; Combes et al. 2013; Fluetsch et al. 2019; Fernández-Ontiveros et al. 2020) or the driving mechanism of the excitation of the molecular component (e.g., Daddi et al. 2015; Pozzi et al. 2017; Mingozzi et al. 2018; Leroy et al. 2021; Esposito et al. 2022 and reference therein). Interferometric facilities such as the Atacama Large Millimeter Array (ALMA) and the NOrthern Extended Millimeter Array (NOEMA) provide a powerful tool for spatially resolved studies of the nuclear region, looking for AGN-driven outflows in active galaxies (e.g., Combes et al. 2013; Cicone et al. 2014; García-Burillo et al. 2014; Fiore et al. 2017; Alonso-Herrero et al. 2018), while single-dish observations are needed to recover the large-scale emission of the host galaxy (e.g., Leroy et al. 2009; Saintonge et al. 2011, 2017; Jiménez-Donaire et al. 2019; Sorai et al. 2019).
When comparing the properties of active and inactive galaxies, a major issue is the uncertain determination of the level to which the presence of an AGN affects the star-formation rate (SFR) proxies in the far-infrared (FIR) as well in the ultraviolet (UV). To address this issue, a multiwavelength approach is crucial for disentangling the relative contribution from AGN and host-galaxy SF in the global output of the galaxy.
In recent years, our group has developed a multiwavelength strategy aimed at characterizing the emission from the AGN in a statistical sample of local Seyfert galaxies. This method requires the collection of observations in different bands (from X-rays to the millimeter band) and their coherent analysis to provide a complete picture of the interplay between the AGN and the host-galaxy SF activity. Previous work from our group (Gruppioni et al. 2016, hereafter G16) exploited the collection of photometric measurements – from the UV to the FIR, including in particular Spitzer/infrared spectrograph (IRS) mid-infrared (MIR) spectra – to perform a detailed spectral energy distribution (SED) decomposition for a sample of 76 Seyfert galaxies. The 76 objects are MIR-selected objects drawn from the active galaxies of the extended 12 micron galaxy sample (12MGS; Rush et al. 1993) where Spitzer/IRS spectra are available. G16 derived an almost complete characterization of the sources in terms of the relative contributions from stellar and nuclear activities to the global energy output of the galaxy. Here, we extend the work by G16 by quantifying, when present, the impact of AGN activity on the cold molecular gas reservoir and MIR emission (3–25 μm) in 33 Seyfert 2 galaxies out of the 76 objects in G16. Our approach is twofold: (i) We derive the molecular gas masses for the targets by using new observations with the Atacama Pathfinder EXperiment (APEX) antenna of the CO(2–1) emission line for 23 AGN and by collecting low-J CO observations from the literature for the remaining ten targets. We then compare the molecular gas content and consumption timescales in this well-defined sample of obscured AGN with a control sample of star-forming galaxies (SFGs). (ii) We study the emission in the MIR to investigate the effects of the AGN radiation on interstellar medium (ISM) tracers in this band, as polycyclic aromatic hydrocarbon (PAH) features.
Several comparative studies of the molecular gas content and SF efficiency between local active galaxies and SFGs have been presented over the years (e.g., Maiolino et al. 1997; Bertram et al. 2007; Rosario et al. 2018), which suggest that local AGN hosts do not differ from inactive sources, in contrast with the results observed in high-redshift quasars (z ∼ 1–3; e.g., Brusa et al. 2018; Talia et al. 2018). While detailed studies are nowadays flourishing thanks to ALMA and NOEMA (e.g., García-Burillo et al. 2021; Leroy et al. 2021), which provide insight into the physical conditions of the molecular component down to the size of the molecular clouds (a few tens of parsecs), spatially integrated studies remain powerful tools for investigating and comparing the properties of active and inactive galaxies. Galactic-scale studies are also important for comparing the properties of local galaxies with objects at higher redshift (z > 1), where highly spatially resolved studies on large samples are challenging. In this context, we compare the molecular gas properties (namely, the molecular gas masses and depletion time) of a finely characterized sample of local Seyfert galaxies with a control sample of SFGs. For the study of the MIR emission, we focus on the PAH features from the wealth of diagnostics present in the MIR band (e.g., emission line ratios and both emission and absorption spectral features). The PAH features are usually associated with the presence of ongoing SF activity, and they have been proposed as an alternative to CO for tracing the molecular gas content in SFGs (Cortzen et al. 2019, hereafter Co19). However, it is widely debated how the presence of nuclear activity affects the PAH luminosity since the high ionizing radiation field from the AGN is able to destroy PAH molecules. Indeed, AGN have been observed to suppress the PAH emission (Diamond-Stanic & Rieke 2010), especially the features at the shortest wavelengths (i.e., at 6.2 and 7.7 μm). To the contrary, strong PAH emission was detected in local Seyfert galaxies (e.g., Hönig et al. 2010; Alonso-Herrero et al. 2014), with recent works suggesting that AGN may enhance PAH features (e.g., Jensen et al. 2017). In this work, we investigate if the presence of the AGN affects the luminosity of PAH features with respect to a control sample of SFGs. G16 provided the characterization of the AGN emission (namely, the bolometric luminosity and relative contribution to the global infrared emission of the galaxy) in the sample of Seyfert 2 galaxies, which makes the G16 sample a reference sample for this kind of study.
The present paper is structured as follows: The sample is presented in Sect. 2, and the CO spectra of the new APEX observations and archival CO spectroscopy, along with the multiwavelength data included in the analysis, are presented in Sect. 3. We introduce the control sample of inactive galaxies used during the analysis in Sect. 4. In Sect. 5 we analyze the effect of AGN activity on the molecular gas masses and properties of the host galaxy, as well as the effect on the emission from MIR features. Conclusions are drawn in Sect. 6. In Appendix A we report the results of the statistical test used to evaluate the difference between the properties of AGN and SFGs.
Throughout the paper, distance-dependent quantities are calculated for a standard flat Λ cold dark matter cosmology with the matter density parameter ΩM = 0.30, the dark energy density parameter ΩΛ = 0.70, and the Hubble constant H0 = 70 km s−1 Mpc−1 (Komatsu et al. 2009). We adopt the solar oxygen abundance of 12 + log(O/H) = 8.69 ± 0.05 from Asplund et al. (2009). Errors are given at the 68 per cent confidence level.
2. The sample
In the present work, we study the Seyfert 2 galaxies drawn from the sample of 76 Seyfert galaxies studied in G16. From the 76 MIR-selected active galaxies presented in G16, we selected 33 optically classified obscured sources with available CO spectroscopy from new and preexisting observations (objects are listed in Table 1). The bulk of the sample consists of 23 objects for which we were granted 18h of observing time for CO(2–1) spectroscopy with the APEX telescope (Güsten et al. 2006). Ten more sources with low-J CO (J = 1–0; 2–1) observations collected with several other telescopes were added to the sample (references to the literature are reported in Table 2).
Sample properties.
Molecular gas properties of the Seyfert 2 galaxies.
The sources benefit from a detailed SED decomposition performed in G16, which provides the estimates of the SFRs and the stellar and dust masses of the targets, as well as the relative contribution from the AGN and host galaxy to the total infrared emission. To compare the properties of the AGN with a control sample of SFGs, we needed reliable characterizations of the AGN host galaxies from the SED decomposition, including the emission of stars, dust heated by SF, and AGN circumnuclear tori. For this reason, we focused on Seyfert 2 galaxies since the UV-optical is dominated by stellar emission, making it easier to constrain the contribution from stars (and hence the stellar content, M⋆) with respect to type 1 AGN. Indeed, when looking at Seyfert 2 galaxies, the primary AGN UV-optical emission, which arises from the accretion disk surrounding the SMBH, is blocked and absorbed by obscuring material (i.e., the circumnuclear dust, which is often assumed to have a toroidal shape) and is then reemitted by the same dust in the MIR.
3. Data
The multiwavelength data used in this study consist of single-dish observations of CO emission lines, to trace the molecular gas content, optical emission line intensities, to determine the metal abundances, the results from the SED decomposition performed in G16, and the measurements of PAH features derived from the literature (Hernán-Caballero & Hatziminaoglou 2011; HC11 hereafter).
3.1. Single-dish observations
3.1.1. APEX data reduction
The observations of the CO(2–1) emission line (at 230.5 GHz rest-frame frequency) for 23 (out of 33) galaxies were carried out with the PI230 receiver (project 0103.F-9311, PI: F. Salvestrini) mounted on the APEX 12 m antenna. The CO spectra were obtained with single-beam observations pointed at the optical positions of the targets, as provided by the NASA/IPAC Extragalactic Database (NED)1. Since we were interested in the integrated line emission, we requested a spectral resolution of 50 km s−1. The requested spectral resolution was sufficient to resolve the line profile with at least six channels assuming a Gaussian line profile with a full width half maximum (FWHM) of ∼300 km s−1, as typically observed in the case of low-J transition in local active galaxies (e.g., Papadopoulos et al. 2012). Observations were designed to obtain a signal-to-noise ratio (S/N) of at least ∼6 at the peak of the line, corresponding to S/N ∼ 15 for the integrated line emission. The resulting integration times on source ranged from a few minutes up to a couple of hours, depending on the brightness of the source. At the observing CO(2–1) frequency, the average main beam size is θmb = 27″, corresponding to a physical scale of ∼10 kpc at median redshift (z ∼ 0.02) for the sample.
Data reduction was performed using the Continuum and Line Analysis Single-dish Software (CLASS), which is part of the GILDAS2 software package. Calibrators were chosen according to the standard guideline for APEX observations3. The CO(2–1) emission line profiles for the 23 sources are presented in Fig. 1. We first fit the CO line emission with a single Gaussian profile, an approach that allows for a preliminary assessment of the central velocity (v0), strength, and width (i.e., the FWHM, WCO) of the line. Where the line profile shows clear evidence of more than one peak, we repeated the fit with two Gaussian functions, as done for MCG-03-34-064, MCG+00-29-023, Mrk 0897, NGC 2992, NGC 5506, and NGC 5995 (see Fig. 1). In this case, we assumed as the central velocity and width of the CO line the mean of the central velocities and the squared sum of the FWHM of the two Gaussian functions, respectively. However, neither the single nor the double Gaussian components allow us to properly model the CO emission, due to the complex profile and the low spectral resolution of the observations (i.e., δvC = 50 km s−1). This motivated our decision to estimate the total line fluxes by integrating the emission in a fixed velocity range of [−1100, 1100] km s−1centered on the systemic velocity of each source, once the baseline was subtracted. This approach secured uniform and solid estimates of the line intensity, even in those cases where the observed line profile differs significantly from that of a single – or double – Gaussian function. The error on the CO line fluxes was calculated as

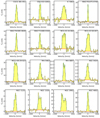 |
Fig. 1. Continuum-subtracted CO(2–1) emission line profile for 23 Seyfert 2 galaxies observed by APEX. Fluxes are expressed as antenna temperatures ( |

 |
Fig. 1. continued. |
where σrms is the root-mean-square (RMS) noise in K (reported in Table 2), WCO is the CO line width in km s−1, and δvC is the spectral resolution (δvC = 50 km s−1). The RMS was calculated as the quadratic mean of the signal in the line-free channels (i.e., over the remaining side bands, for a total of ∼2000 km s−1) once the edge channels were flagged (three channels per side). Calibration uncertainties, being larger than the spectral noise, significantly affect the estimates of the CO line intensities. We conservatively assumed them to be 10% of the intensity, as usually done for similar observations (e.g., Csengeri et al. 2016; Giannetti et al. 2017). The uncertainties reported in Table 2 are the quadratic sum of the calibration uncertainties and the spectral noise integrated over the line profile.
To convert the line integrated intensities to fluxes in units of Jy km s−1, we adopted a constant Jy/K conversion factor of 37 ± 3, suitable for the PI230 receiver4. In Table 2, we present the new CO fluxes obtained with APEX.
3.1.2. Literature single-dish data
To extend the sample coverage, we included in the analysis a set of low-J CO emission line fluxes retrieved from the literature for ten additional Seyfert 2 galaxies from G16 (references are reported in Table 2). In particular, we searched for CO(1–0) and CO(2–1) spectroscopy obtained with single-dish telescopes to avoid the filtering out of the flux due to missing short baselines, inherent to the interferometric observations5. More precisely, we retrieved the CO(1–0) emission line intensities of four objects from Papadopoulos et al. (2012; Mrk 0273, NGC 5135, NGC 5256, and UGC 05101), obtained with the Institut de Radioastronomie Millimetrique (IRAM) 30 m antenna (θmb ∼ 23″). The CO(1–0) line intensities for NGC 0034 and NGC 7130 were measured by Albrecht et al. (2007) with the 15 m antenna of the Swedish-ESO Submillimeter Telescope (θmb ∼ 45″). In the work by Maiolino et al. (1997), the authors exploited the 12 m single-dish facility of the National Radio Astronomy Observatory to study the molecular gas properties of a large sample of local galaxies, from which we retrieved the CO (1–0) flux measurements for NGC 0513, NGC 3079, and NGC 5347. Finally, Rosario et al. (2018) provided the flux of the CO(2–1) transition for NGC 4388, observed with the 15 m dish of the James Clerk Maxwell Telescope (θmb ∼ 22 ″).
3.1.3. Aperture correction for the CO flux
Proprietary data from APEX as well as literature data are single-dish observations pointed at the center of the galaxy (i.e., at the optical position), with a typical field-of-view smaller than the dimension of the optical emission from the galaxy. To account for potential CO flux loss, we applied aperture correction to the CO line flux based on the relation between the galactic extension determined through optical observations and CO maps. The spatial distribution of the molecular gas, traced by the CO emission, is well described by an exponentially decreasing disk, both perpendicularly to the galactic plane and in the radial direction. The CO scale radius has been shown to be proportional to the optical size of the sources (D256; e.g., Lisenfeld et al. 2011; Casasola et al. 2017). Following Boselli et al. (2014), we assumed

where SCO(0) is the central emission and rCO and zCO are the CO scale radius and height, respectively. This method is the three-dimensional extension of the two-dimensional approach proposed by Lisenfeld et al. (2011), valid for low-inclination galaxies. Here we assumed rCO/r25 = 0.27, following Lisenfeld et al. (2011), and zCO/z25 = 0.01, as suggested by Boselli et al. (2014). These assumptions have been tested in nearby galaxies with morphological classifications similar to that of Seyfert 2 galaxies (mostly spirals and S0 objects; see also Boselli et al. 2014; Ca20). The inclination angles and optical diameters of the Seyfert 2 galaxies are reported in Table 1. The resulting aperture correction factor is
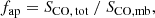
where SCO, tot is the total CO flux integrated over the entire galaxy and SCO, mb is the scaled CO flux measured in the center of the galaxy, convolved with the main beam profile.
The estimated values for the aperture correction are reported in Table 2. The mean aperture correction factor is fap = 2.8, and the standard deviation is σfap = 1.5. A large fraction of the sample (19 out of 33 targets, i.e., ∼60%) have fap < 2; in other words, the resulting CO flux is increased by less than a factor of 2. The only exception is NGC 4388, whose large optical dimension (D25 ∼ 5′) led to fap ∼ 15. The CO(1–0) luminosities presented in Table 2 are derived from aperture-corrected fluxes assuming Eq. (3), while the uncertainties on  include a contribution from the error on fap.
3.1.4. The molecular gas content
Low-rotation transitions of the 12CO molecules – the second most abundant molecule in the ISM (Young & Scoville 1991) – are widely used as tracers of the cold molecular gas components in galaxies. By measuring the total luminosity of the CO(1–0) emission line ( ), we are able to estimate the molecular gas reservoir. Here, we derived the CO(1–0) luminosity by applying the aperture correction to the CO intensities presented in Table 2. For the 24 sources with CO(2–1) line intensities, we assumed an intensity ratio R21 = ICO(2 − 1)/ICO(1 − 0) = 0.9 (corresponding to a flux ratio of ∼3.6) to extrapolate the intensity of the lowest-J transition, as observed for similar objects in the local Universe (e.g., Papadopoulos et al. 2012). Given the CO(1–0) intensity, we calculated
  in units of K km s−1 pc2 following Eq. (3) from Puschnig et al. (2020), which is adapted from Eq. (2) from Solomon & Vanden Bout (2005) with the inclusion of the aperture correction factor

where fap is the aperture correction factor, Ω the solid angle of the Gaussian beam in arcsec2, ICO the CO integrated line intensity in K km s−1, DL the luminosity distance in Mpc, and z the redshift.
The resulting  are reported in Table 2 and plotted in Fig. 2 as a function of the infrared luminosity produced by SF (
 8, one of the outcomes of the SED decomposition performed by G16); further discussion of this figure is provided in Sect. 5.
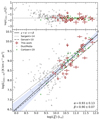 |
Fig. 2. Infrared versus CO(1–0) luminosity. Bottom: aperture-corrected CO(1–0) luminosity ( |


The cold molecular gas mass (Mgas) is usually derived from the luminosity of the CO(1–0) by assuming a CO-to-H2 conversion factor,
as in Solomon & Vanden Bout (2005) and Bolatto et al. (2013). Theoretical and observational studies have suggested that the αCO factor assumes a large range of values depending on the galaxy properties (e.g., compactness and merging), the physical conditions (presence of intense radiation fields), and the composition (metallicity) of the ISM (e.g., Leroy et al. 2011; Narayanan et al. 2012; Papadopoulos et al. 2012; Bolatto et al. 2013; Sandstrom et al. 2013). Low CO-to-H2 conversion factors (αCO = 0.3–2.5 M⊙ pc−2 (K km s−1)−1) have been measured in local ultra-luminous infrared galaxies (U-LIRGs) and starburst galaxies, while higher values have been observed in Milky Way-like objects and main-sequence (MS) galaxies (αCO = 4.3 M⊙ pc−2 (K km s−1)−1; e.g., Solomon et al. 1997; Tacconi et al. 2006; Daddi et al. 2010; Magdis et al. 2011, 2013; Bolatto et al. 2013; Casey et al. 2014). Indeed, relatively low αCOvalues (∼1.1 M⊙ pc−2 (K km s−1)−1) have been used to estimate  in the central metal-rich regions of local active and inactive galaxies with properties (e.g., M⋆ and SFRs) similar to those of our sample of Seyfert 2 galaxies (e.g., Pozzi et al. 2017; Rosario et al. 2018).
Given the diverse nature of the Seyfert 2 galaxies presented in this work, which include several LIRGs, we adopted the prescription by Narayanan et al. (2012) to determine the proper αCO factor for each object, that is,
where Z is the metallicity, derived from the O/H abundance in proportion to the solar abundance (see Sect. 3.2), and ICO is the CO brightness intensity. Equation (6) is based on a semi-analytic relation from Narayanan et al. (2012), where the αCO conversion factor depends on both the metallicity and the CO intensity (ICO). The dependence on the CO brightness makes αCO sensitive to varying environmental properties, such as the diverse density and temperature of the molecular gas. This is even truer in U-LIRGs, where starbursting regions would make the molecular gas denser and hotter, thus resulting in brighter CO emission (and thus lower αCO; for further details, see the appendix in Puschnig et al. 2020). We obtained αCO values in the range αCO = 0.6–5.2 M⊙ pc−2 (K km s−1)−1, with ∼90% of the sample (29 out of 33 objects) having a αCO between 1.1 and 4.3 M⊙ pc−2 (K km s−1)−1, the αCO usually adopted for AGN and Milky Way-like galaxies, respectively. Only four targets show αCO outside this range: NGC 3079 and NGC 5135, with αCO < 1.1 M⊙ pc−2 (K km s−1)−1 (i.e., the galaxies with the highest oxygen abundances in the sample; see Table 1), and IC 5063 and Mrk 0463, with αCO > 4.3 M⊙ pc−2 (K km s−1)−1 (i.e., the galaxies with the lowest oxygen abundances in the sample). These two pairs of objects show Z measurements at the higher and lower tails of the gas-phase metallicity distribution, respectively, and there is no evidence suggesting a nature different from that of the rest of the sample for these four galaxies. In Table 2, for each galaxy we present the best estimate for the adopted αCO and  derived using Eq. (5) and including the helium contribution, along with the corresponding uncertainties. In Sect. 5 we graphically show how the estimate for the
  would change by assuming αCO values in the range αCO = 1.1–4.3 M⊙ pc−2 (K km s−1)−1 (i.e., the CO-to-H2 conversion factors usually adopted for local AGN and Milky Way-like objects, respectively), as well as how the αCO assumption affects the results.
3.2. Optical emission lines
The αCO proposed by Narayanan et al. (2012) requires the determination of the gas-phase metallicity in units of solar metallicity. Here, we assume that the oxygen abundance is a good tracer of the total gas-phase metallicity. From the diverse calibrations present in the literature to derive the oxygen abundance, we adopted the empirical calibration by Pettini & Pagel (2004), based on the N2 index:

where N2 = log([NII]λ6583 Å/Hα). We opted for Eq. (7) because the N2 index only requires the flux ratio of the [NII]λ6583 Å and Hα emission lines, which is available in the literature for the entire sample. Optical line flux measurements for 31 out of the 33 Seyfert 2 galaxies are from ancillary UV-optical spectra analyzed by Malkan et al. (2017), while for the remaining two objects (IRAS F04385-0828 and NGC 4602) we collected the optical line ratios from the optical spectra obtained with the South African Large Telescope by Feltre et al. (in prep.). Errors on the optical emission lines include a contribution from the calibration uncertainty, which we conservatively assumed to be 30% (see Malkan et al. 2017 for further details). In Table 1 we report the oxygen abundance with the associated uncertainty.
3.3. Decomposed SED
The sources in the sample of Seyfert 2 galaxies benefit from the detailed SED decomposition analysis performed by G16, which provides a complete description of each source in terms of the different components (e.g., stars, dust, and AGN) and the ongoing processes (e.g., SF and nuclear accretion). Here, we briefly summarize the approach adopted in G16, where the SED fitting procedure and the processing of the selection of the archival data are illustrated in great detail. The SED-fitting code adopted is SED3FIT9 (Berta et al. 2013), which simultaneously reproduces the stellar emission and the reprocessed emission from the dust – heated by both stars and the AGN. The code relies on a collection of libraries, in particular the library from Bruzual & Charlot (2003) for the stellar contribution, the one from da Cunha et al. (2008) for the infrared dust emission, and the library of AGN tori from Fritz et al. (2006), updated by Feltre et al. (2012). An ancillary compilation of photometric data, from the UV to the FIR wavelengths, was collected from NED. Furthermore, to properly constrain and disentangle the AGN contribution, with the dusty torus contributing the most in the MIR, archival Spitzer/IRS data were included (see G16 for further details). The sources in the sample being optically classified as Seyfert 2 galaxies (i.e., narrow-line AGN), the contribution from stars dominates over the AGN in the optical-UV band, making it easier to differentiate between the contributions from AGN and the host galaxy in the global outcome of the source. This led to a more reliable characterization of the source in terms of the stellar content and the SF activity with respect to sources with an unobscured AGN.
An example of a decomposed SED for one of the objects (IRAS F04385-0828) is presented in Fig. 3. In Table 3 of G16, the authors report the results of the SED decomposition for their entire sample, among which the 33 Seyfert 2 galaxies can be found. For our purposes, we retrieved the main host-galaxy properties, namely the SFR (obtained through the Kennicutt 1998 relation), stellar and total dust masses (measured as prescribed by da Cunha et al. 2008), infrared luminosity (integrated over the 8–1000 μm spectral range), and the relative contribution of the AGN (fAGN) to the global outcome of the source in the 5–40 μm band (fAGN), which we present in Table 1.
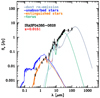 |
Fig. 3. Example of a decomposed SED (from G16). The unabsorbed stellar component (blue line) is scaled down due to the dust absorption to match observations (black dots). The resulting absorbed stellar emission is represented in orange. In the MIR band, the dusty torus component is shown with the dashed green line, and the dust reemission in the FIR is in gray. |
3.4. MIR features
The Spitzer/IRS MIR spectra of the central region of local sources offer a wealth of spectral features, which are fundamental diagnostics of the SF versus AGN interplay. This spectral range is characterized by the concurrent contributions from the thermal continuum emission from the dust associated with SF, as well as spectral features and lines arising from the different gas components (molecular, atomic, and ionized) and the dust-reprocessed emission from the AGN, as in the case of the Seyfert 2 galaxies. Many of these spectral features have been widely used to determine the impinging mechanism responsible for the observed emission, including the PAH features, which are associated with SF activity but can be affected by the presence of strong radiation fields from the AGN.
We collected measurements of MIR features from HC11 for 32 out of the 33 Seyfert 2 galaxies. In HC11, the authors analyzed the Spitzer/IRS spectra of 739 sources, both active galaxies and SFGs with redshifts of up to ∼3.7, gathered from many observational campaigns (see Table 1 in HC11 for more details and references). HC11 provided MIR measurements, such as the main PAH properties, the strength of the silicates in emission or absorption around 9.7 μm, and rest-frame monochromatic luminosities or colors, used as diagnostics to classify the sources in terms of their MIR properties. In the case of local objects from HC11 – including the 32 in common with the present sample of Seyfert 2 galaxies – the Spitzer/IRS spectra sample the emission from the nuclear region, where the contribution from the AGN is more relevant. The actual extraction area depends on the slit mode and the distance of the source10, but the central kiloparsec-scale region was sampled even in the most nearby objects in the sample.
Since a significant fraction of the Spitzer/IRS spectra included in the work by HC11 had a low S/N, a proper modeling of the MIR features was difficult. For this reason, the authors defined a homogeneous and concise method, providing solid estimates for each source by combining the linear interpolation of the continuum with the integration of the emission from the features. In particular, in the case of the PAH features we are interested in, the authors selected two narrow, continuum bands at both sides of each feature, performed a linear interpolation to estimate the continuum underlying the feature, and then subtracted it from the spectrum. The residuals were integrated in a band centered at the expected wavelength of the peak of the PAH feature to obtain the integrated PAH flux. The uncertainties on the PAH intensities and the continuum were estimated by performing Monte Carlo simulations. The authors also provided the equivalent widths (EWs) of the PAH features by dividing the integrated PAH flux by the interpolated continuum at the center of the feature. Further details about the procedure are available in Sect. 4 of HC11. We collected the luminosity and EW for the 6.2 and 11.3 μm PAH features for 28 and 32 out of the 33 Seyfert 2 galaxies, respectively.
4. Control sample
To assess the effect of AGN on the properties of the host galaxy (e.g., in terms of either the molecular gas content or the SF activity), we need to compare the AGN sample with local SFGs that do not harbor an active nucleus. Among the plethora of samples of local objects that have been studied in the literature, we focused on those samples that benefit from a complete characterization of the sources in terms of their molecular gas, dust and stellar content, and SF activity.
The sample of local objects in the DustPedia11 project is ideal for this purpose, given the multiwavelength imaging and photometry database of the 875 nearby galaxies studied as part of this project (Davies et al. 2017; Clark et al. 2018). The DustPedia sample consists of all the galaxies observed by Herschel with optical diameters > 1′, recessional velocities > 3000 km s−1, and with a WISE 3.4 μm detection with a minimum S/N of 5 (Davies et al. 2017). Each galaxy benefits from the results of a CIGALE12 SED fitting decomposition, which provides a description of the sources in terms of ongoing SF and stellar content (Nersesian et al. 2019). In particular, we selected the control sample from a recent work of the DustPedia collaboration (Casasola et al. 2020, hereafter Ca20), which focused on the molecular gas properties of a subsample of 255 spirals. Using single-dish archival observations, the authors derived the molecular gas masses from aperture-corrected low-J CO spectroscopy using a procedure similar to the one described in Sect. 3.1.4 and assuming αCO = 3.2 M⊙ pc−2 (K km s−1)−1, which is a value suitable for inactive galaxies (see Ca20 for further details). To compare the control sample with the sample of Seyfert 2 galaxies, we corrected the  from Ca20 for αCO = 4.3 M⊙ pc−2 (K km s−1)−1 to account for the He contribution to the mass.
To build a control sample of inactive galaxies that matches the host-galaxy properties of the Seyfert 2 galaxies, in particular in terms of the stellar mass and SFR, we excluded the dwarf galaxies by removing the objects with M⋆ < 109 M⊙ (25 objects). Nevertheless, the remaining 230 SFGs from the Ca20 sample still do not perfectly match the AGN sample in terms of SFRs and stellar masses, as shown in Table 3. To pair the high-SFR and stellar mass tails of the sample of Seyfert 2 galaxies, we included the Co19 sample, where the authors investigated the use of MIR features, in particular the PAH features, as tracers of the molecular gas content in local and intermediate-redshift galaxies. The target sample presented by Co19 consists of 283 MIR-selected objects, drawn from the 5 mJy Unbiased Spitzer Extragalactic Survey (5MUSES; Wu et al. 2010) when low-J CO spectroscopy, MIR PAH feature detection, and infrared photometry were available. We further selected those objects (144 out of 283) where stellar mass, SFR, molecular gas, and dust estimates as well as measurements of the 6.2 μm PAH feature were available. Co19 chose the PAH feature at 6.2 μm as it is less affected by the contribution from the warm dust, which is stronger at longer wavelengths. Stellar and dust parameters were obtained through an SED decomposition (Shi et al. 2011), while the SFR was derived assuming the LIR-SFR relation from Kennicutt (1998). Co19 also provided aperture-corrected  measurements for 33 (out of 144) 5MUSES objects, derived from CO(1–0) spectroscopy acquired with the IRAM 30 m antenna. The measurements of the PAH features were obtained using the PAHFIT code (see Magdis et al. 2013). Co19 provided the molecular gas masses derived from the dust content, assuming a well-calibrated metallicity-dependent gas-to-dust ratio (GDR)13. This way, the author avoided the dependence on the αCO conversion factor, although in this case the molecular gas masses are affected by the uncertainties related to the assumed GDR. Nevertheless, we tested the consistency of the method to measure the
  adopted by Co19 with the procedure presented in Ca20 and our Sect. 3.1.4 for the objects from Co19 with
  measurements. Then, by assuming αCO = 4.3 M⊙ pc−2 (K km s−1)−1 in Eq. (5), we derived the molecular gas mass and compared these values with those reported by Co19 (i.e., values obtained assuming a GDR). We verified that the two methods provide consistent estimates (within 1σ) for
  , but, given the larger statistics, we used the
  derived from the dust content. We refer to Co19 for the details on the measurements of the galaxy properties. Among the 144 galaxies with full sets of PAH measurements, we conservatively excluded the sources with an EW of the 6.2 μm PAH feature smaller than 0.4 μm, which is usually adopted as an indicator for AGN or composite objects (i.e., where AGN and SF coexist; e.g., Spoon et al. 2007; Magdis et al. 2013; Co19), since PAH emission EWs have been observed to decrease with increasing AGN activity (Tommasin et al. 2010). The remaining 95 objects are putative SFGs.
Properties for the studied AGN sample and the control samples from Ca20 (DustPedia) and Co19 (5MUSES), after removing AGN-dominated objects.
Since we were interested in collecting SFGs free from any AGN contamination, we further checked for the potential presence of nuclear activity by cross-matching the SFGs from the DustPedia (230 objects) and 5MUSES (95 objects) samples with the most recent catalogs of X-ray observations: 4th X-ray Multi-Mirror data release 9 (4XMM-DR914; Webb et al. 2020) and the Swift-Burst Alert Telescope (BAT) 105-Month Hard X-ray Survey15 (Oh et al. 2018). Of the 230 DustPedia sources, 96 (42%) have a counterpart within 30 arcsec in the 4XMM DR9 catalog that potentially hosts a relatively luminous AGN (i.e., with an observed X-ray luminosity of L0.2 − 12 keV > 1041 erg s−1). Given the low threshold adopted, we expected to find intrinsically weak or extremely obscured objects (e.g., Salvestrini et al. 2020) in addition to canonical AGN. We used the hardness ratio (HR) as a selection criteria to infer the presence of nuclear activity. It is calculated as HR = (H − S)/(H + S), the normalized difference of the fluxes in the hard 2–12 keV (H) and soft 0.2–2 keV (S) energy bands (for further details on the flux estimates, see Webb et al. 2020 and Oh et al. 2018). The signature of nuclear activity in low- and intermediate-redshift AGN is the peak of the X-ray emission in the hard band (E > 2 keV), resulting in positive HR, while the diffuse emission associated with the host-galaxy SF peaks in the soft band, which means a negative HR. A total of 60 potential AGN with HR > 0 were excluded in the end. We also searched for objects from the DustPedia sample in the Swift-BAT catalog. Since the emission in the hard X-ray band (E > 10 keV) is almost exclusively associated with nuclear activity, we further excluded one source that was detected in the 14–195 keV band as part of the Swift-BAT monitoring. In the end, we retrieved the properties for the 169 local inactive galaxies from the official DustPedia web page, namely the molecular gas and dust masses, the SFR, and the stellar mass.
As previously done for the DustPedia objects, we further checked for evidence of nuclear activity by searching for detection in the X-rays of the 5MUSES galaxies. Then, we cross-matched the 95 5MUSES objects with the 4XMM-DR9 and the Swift-BAT 105-Month Hard X-ray Survey. We found that none of the 95 5MUSE galaxies was detected within the Swift-BAT catalog; on the other hand, 41 galaxies were detected with XMM-Newton, all of them with HR < 0. Since there were no common sources between the two sets of objects, we used the 95 objects from Co19 combined with the 169 SFGs from Ca20 as the control sample for our study. From here on, we refer to the 264 SFGs presented in this section as the control sample. A brief summary of the main properties of the control sample and the Seyfert 2 galaxies are shown in Table 3. We assumed the appropriate conversion factor to correct M⋆ and SFR measurements for the initial mass function by Chabrier (2003), which is the one assumed by G16.
5. Results and discussion
In this section we discuss the relations between the properties of the sample of Seyfert 2 galaxies and the control sample of SFGs. In particular, we focus on the molecular gas content, traced by the CO emission, and physical properties, such as LIR, SF, PAH feature emission, and star and dust content. To compare the population of AGN considered in this study with the control sample of SFGs, we used the standard Kolmogorov–Smirnov (KS) test for two samples. We assumed p = 0.05 as a threshold for the p-value, above which we cannot reject the null hypothesis that the samples are drawn from the same distribution. It is worth noticing that the results of the KS tests used to statistically compare the samples (AGN and SFGs) may be affected if the uncertainties on the galaxy properties are not properly taken into account. To tackle this issue, we simulated 1000 copies of the samples of AGN and SFGs, with each of their properties (e.g., M⋆, Mdust, and SFR) randomly drawn from a normal distribution centered on the best estimate (see Tables 1 and 2 for the AGN sample and the Ca20 and Co19 samples for the SFGs), with the relative uncertainty as the standard deviation. Thus, we were able to limit the impact, if present, of poorly constrained measurements on the shaping of the one-dimensional distribution of the physical properties of both the AGN and SFG samples. Moreover, simulations may also reduce the impact of the lack of homogeneity between the selection criteria adopted to build the AGN control sample. It is worth mentioning that the KS test is most sensitive when the empirical distribution functions differ in a global fashion near the center of the distribution, while it less sensitive in the case of the difference arising in the wings of the distribution curves. An alternative to the KS test is the Anderson-Darling (AD) test (Rahman et al. 2006), which is more sensitive to the distribution wings, but it is not recommended for small samples (as is the case for the Seyfert 2 galaxy sample). Since both the KS and AD tests have limitations, we ran both test to highlight any difference between the simulated AGN and SFG samples. For the sake of simplicity, in the following sections we only present the median of the p-values obtained by the KS tests since we do not find conflicting outcomes from the KS and AD tests. The distribution of the KS test p-values on the simulated copies of the AGN and SFG samples is shown as histograms in Appendix A.
5.1. AGN and control sample properties
At first, we compared the physical properties (namely M⋆, SFR, and Mdust; see Sect. 3 for details) of the 33 Seyfert 2 galaxies with those of the control sample. In Fig. 4 we show the distribution of the AGN sample and the control sample in SFR-M⋆ (top) and Mdust-M⋆ (bottom) diagrams. To highlight hidden trends that may differentiate AGN from SFGs, in the right panels of Fig. 4 we present the binned version of the scaling relation presented in the left panels. Bins were chosen to contain the same number of objects; the mean and the error bars (representing the standard deviation measured within the single bin) were obtained with bootstrap procedures, using 10 000 iterations. The M⋆ distribution for the Seyfert 2 galaxies deviates from that of the control sample (p = 0.02) due to a gap in objects at intermediate masses (M⋆ ∼ 1010 − 10.5 M⊙), which is likely due to the lower source statistics of the AGN sample with respect to the sample of SFGs. When matched in the low (M⋆ < 1010.5 M⊙) and high-stellar-mass regime (M⋆ > 1010.5 M⊙), AGN and SFGs have almost identical distributions (p > 0.5). The SFR distribution in AGN deviates from that in SFGs (p < 0.001) due to the objects with the smallest M⋆, which show larger SFRs than SFGs (p < 0.001). Conversely, in the highest-M⋆ regime, the two samples populate a similar region of the SFR-M⋆ diagram (p = 0.10 when testing the SFR in the subsamples with M⋆ > 1010.5 M⊙), as can be clearly seen in the top-left corner of Fig. 4. Looking at the bottom row, the Seyfert 2 galaxies show a distribution of Mdust similar to that of SFGs over two orders of magnitude in M⋆ (p ∼ 0.5). To summarize, the AGN sample and the control sample appear to be drawn from the same parent population since they show similar distributions in terms of M⋆ and Mdust, with small differences in the M⋆ distribution that likely arise from the different object statistics of the AGN sample. Regarding the SF activity, the AGN are likely hosted in galaxies with similar SFRs to the control sample in the more massive regime (M⋆ > 1010.5 M⊙). Less massive objects (M⋆ < 1010.5 M⊙) that host an AGN show larger SFRs than SFGs. This deviation is further discussed in Sect. 5.3.
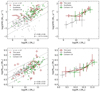 |
Fig. 4. Properties of the Seyfert 2 galaxies and control samples. Left panels: SFR (top row) and dust mass (bottom row) as a function of the stellar mass (M⋆) for Seyfert 2 galaxies (red diamonds) and the control sample (gray circles for DustPedia galaxies and green squares for 5MUSES sources). For purely illustrative purposes, the best-fit trend (dashed black line) for the control sample of inactive galaxies is shown, and the two dotted black lines are the same trend shifted by a factor of 0.5 dex in either direction. The best-fit slope (α) and normalization (β) are reported in each panel. Right panels: same SFR-M⋆ and Mdust − M⋆ planes as in the left panels, but with binned data to underline the average trend of active and inactive galaxies. The bins were chosen to include the same number of sources. The mean value and the error bars (standard deviations) in each bin were determined with a bootstrap procedure using 10 000 iterations. |
5.2. LIR– relation
Normal SFGs, for which a relation between stellar mass and SF has been found (i.e., the so called MS; e.g., Speagle et al. 2014), are thought to follow a unique LIR- relation at all redshifts (e.g., Daddi et al. 2010; Genzel et al. 2010; Sargent et al. 2014), suggesting a ubiquitous relation between SF activity and the molecular gas reservoir in normal SFGs. Conversely, objects with higher SF efficiency, such as local U-LIRGs and high-redshift starburst sources (z > 1 galaxies with SFRs of many hundreds of M⊙ yr−1; e.g., Puglisi et al. 2017), have higher LIR/
 ratios, implying a possible bimodal SF scenario. Here, we investigate how the sample of local AGN populates the SF-molecular gas parameter space. At first, to avoid the systemic effects introduced by the assumption of both the CO-to-H2 and the SFR-to-infrared conversion factors, we investigated the aperture-corrected CO(1–0) luminosity (
 ) from the single-dish observations as a function of the infrared luminosity (LIR; Fig. 2) derived from SED fitting. The 33 Seyfert 2 galaxies show a
  -LIR ratio similar to that of the control sample of SFGs (upper panel of Fig. 2) over two orders of magnitude in LIR.
We then fit a line to the logarithms of  and LIR of the Seyfert 2 galaxies of the form
  , using the “emcee” package, a pure-Python implementation of Goodman & Weare’s affine invariant Markov chain Monte Carlo (MCMC) ensemble sampler (Foreman-Mackey et al. 2013). The best-fit parameters of the LIR–
 relation for the sample of Seyfert 2 galaxies (shown as a solid black line in the bottom panel of Fig. 2) are consistent with the trends observed in the literature for local and intermediate-redshift SFGs (e.g., Daddi et al. 2010; Genzel et al. 2010; Sargent et al. 2014). By comparing the AGN and the control samples, we see that they populate common regions of the LIR–
 diagram, and the
  of the brightest AGN in the infrared in the AGN sample in particular (
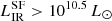 ) are statistically indistinguishable (p > 0.5) from the SFGs. This is in agreement with what is observed in the upper row of Fig. 4, where the AGN populate a common SFR-M⋆ plane, at least for the M⋆ > 1010.5 M⊙ (p = 0.1).
5.3. Molecular gas mass scaling relations
The molecular gas masses for the 33 Seyfert galaxies are presented in Table 2, following the recipe described in Sect. 3.1.4. We recall that the best estimates of  are obtained with the prescription in Narayanan et al. (2012) for the αCO conversion factor; we also graphically present the range of
  (red-shaded area in the right panels of Figs. 5 and 6.) that can be obtained by assuming different CO-to-H2 conversion factors in the range between the Milky Way-like value (αCO = 4.3 M⊙ pc−2 (K km s−1)−1) and αCO = 1.1 M⊙ pc−2 (K km s−1)−1, typically used for the central region of local AGN (e.g., Pozzi et al. 2017; Rosario et al. 2018).
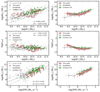 |
Fig. 5. Comparison of the molecular gas properties, part I. Left panels: scaling relations of the molecular gas mass (MH2) as a function of the host-galaxy stellar mass (M⋆; top row) and SFR (bottom row); in the central panel, we show the molecular gas fraction (fmol = MH2/M⋆) as a function of M⋆. Seyfert 2 galaxies are shown as red diamonds, and the control sample is represented by gray circles (DustPedia) and green squares (5MUSES). For purely illustrative purposes, the best-fit trend (dashed black line) for the control sample of inactive galaxies is shown, and the two dotted black lines are the same trend shifted by a factor of 0.5 dex in either direction. The best-fit slope (α) and normalization (β) are reported in each panel. Right panels: same scaling relations as in the left panels, but with binned data to underline the average trend of active and inactive galaxies. The red-shaded regions represent the range of |

To assess if, and to what extent, AGN can affect the host-galaxy molecular gas content and SF activity, we compared the molecular gas masses ( ) as a function of different host-galaxy properties in the AGN sample – namely the stellar mass (M⋆), the SFR, the dust mass (Mdust), and the offset from the MS (δMS) – with those of the control sample (Figs. 5 and 6, respectively). Looking at the top-left panel of Fig. 5, it is clear that the
  distribution of the AGN sample deviates significantly (p ∼ 0.01) from that of normal SFGs if we compare the two samples over the two orders of magnitude in M⋆. The low p-value observed over the entire M⋆ range is likely due to the low-M⋆ regime (M⋆ < 1010.5 M⊙), where AGN show larger
  with respect to SFGs. Conversely, for more massive objects (M⋆ > 1010.5 M⊙), we cannot reject the hypothesis that the two distributions are similar (p ∼ 0.6). This trend is also present when we compare the molecular gas fraction (fmol = MH2/M⋆) as a function of M⋆ with the less massive Seyfert 2 galaxies that show larger fmol than the SFGs (p < 0.02).
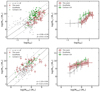 |
Fig. 6. Comparison of the molecular gas properties, part II. Left panels: molecular gas mass (MH2) versus the offset from the MS (derived assuming the relation by Sargent et al. 2014; top panel) and host-galaxy dust mass (Mdust; bottom panel). Seyfert 2 galaxies are shown with red diamonds, and the control sample is represented by gray circles (DustPedia) and green squares (Co19). Bottom panel: we show the MH2 − Mdust diagram, where the MH2 of the 33 5MUSES SFGs were derived from the CO luminosity (Co19), assuming αCO = 4.3 M⊙ pc−2 (K km s−1)−1. We do not represent the entire sample of 5MUSES SFGs since their |

This discrepancy between the low- and high-M⋆ ends can be justified by again considering the SFR-M⋆ diagram in the top row of Fig. 4. Since the SF activity is tightly related to the amount of molecular gas available to form new stars, in the low-M⋆ regime we expect to observe higher SFRs in the same AGN that showed larger  than SFGs.
To further test the correlation between SF and molecular gas mass, in the bottom row of Fig. 5 the molecular gas masses are presented as a function of SFR. The two quantities show a tighter correlation with respect to the  –M⋆ distribution, and they are in agreement with the LIR–
 relation discussed in Sect. 5.2. In the sample of 33 Seyfert 2 galaxies, we do not have objects with SFR < 10 M⊙ yr−1, which is likely due to the 12MGS being an infrared-selected sample. However, they match the distribution of
  of normal galaxies with SFR > 10 M⊙ yr−1 (p ∼ 0.25), as is clearly visible in the lower-right corner of Fig. 5, where the binned values of
  and SFR are shown. By assuming a lower αCO value (e.g., αCO = 1.1 M⊙ pc−2 (K km s−1)−1), the KS test produced a low probability (p < 0.001), suggesting a statistical difference between the distribution of AGN and SFGs with SFR > 10 M⊙ yr−1.
In the upper-left corner of Fig. 6, the molecular gas content as a function of the offset from the MS (δMS) is shown. The excess (or deficiency) of the specific SFR (sSFR; i.e., SFR/M⋆) with respect to that expected for MS galaxies can be expressed as δMS = sSFR/sSFRMS. The normalization of the MS was derived from the relation by Sargent et al. (2014), which provides the sSFR for MS galaxies, assuming the stellar mass (M⋆) and redshift of the sample of Seyfert 2 galaxies. On average, AGN show larger offsets from the MS with respect to the normal galaxies in the control sample, as is also visible in the top-right panel of Fig. 6. This is consistent with what is observed in high-redshift AGN (z ∼ 1–3) and obscured quasars (e.g., Kakkad et al. 2017; Brusa et al. 2018), which share an offset from the MS that is similar to that of local Seyfert 2 galaxies. The distribution of  over the entire range of δMS covered by the AGN sample is statistically different (p < 0.01) from that of the control sample. Since δMS, as defined above, depends on the sSFR, it is clear that the subset of Seyfert 2 galaxies with larger SFRs than those of the SFGs in the common low-M⋆ regime (see the top panels of Fig. 4) is more likely to populate the higher end of the δMS distribution with respect to the corresponding SFGs with similar M⋆.
The  –Mdust diagram is presented in the bottom panels of Fig. 6. In this case, we do not include the entire Co19 sample, since in that work the authors derive the molecular gas mass from Mdust by assuming a GDR, therefore making the two quantities proportional by definition. Nevertheless, Co19 provided the
  for 41 galaxies (out of the 95 we collected in Sect. 4), which we used to derive the corresponding
  by assuming αCO = 4.3 M⊙ pc−2 (K km s−1)−1 as the CO-to-H2 conversion factor. Therefore, when discussing the
  –Mdust distribution, we considered a control sample limited to 210 objects. Looking at the bottom panels of Fig. 6, AGN seem to host larger molecular gas reservoirs when compared to the SFGs over a wide range of dust masses, something that results in a low KS test p-value (p < 0.001). Furthermore, the distribution of the
  in the most massive AGN (i.e., with Mdust > 107.5 M⊙) are more statistically similar to the corresponding distribution of SFGs (p > 0.5) with respect to the lower-mass regime. Interestingly, as the shaded region in the bottom-right panel would suggest, repeating the KS test assuming a lower αCO value for the AGN results in an increased statistical significance for the null hypothesis (p > 0.1).
To conclude, we observe that AGN with larger M⋆ are likely to host molecular gas content similar to that of SFGs. This is in contrast with what was observed by Koss et al. (2020), who found that a large sample of local AGN, selected in the hard X-ray band, show larger  with respect to their control sample of SFGs for M⋆ > 1010.8 M⊙. In the work by Koss et al. (2020), the
  for both AGN and normal galaxies were derived with a single αCO = 4.3 M⊙ pc−2 (K km s−1)−1, while here we adopted the prescription by Narayanan et al. (2012) for AGN, which provides lower αCO factors (mean value αCO ∼ 3 M⊙ pc−2 (K km s−1)−1 and ∼1 M⊙ pc−2 (K km s−1)−1 as the standard deviation). However, even if we assume αCO = 4.3 M⊙ pc−2 (K km s−1)−1 for the Seyfert 2 galaxies, AGN and SFGs show similar
  content only in the more massive regime in terms of M⋆ (p ∼ 0.2). Therefore, the different selection criterion adopted to build the samples (hard X-ray selection in Koss et al. 2020 versus the infrared-selected objects considered in this work) is likely the reason behind this discrepancy.
The  distribution of the sample of Seyfert 2 galaxies does not differentiate them from the SFGs (p = 0.25) when matched in the high-SFR regime (SFR > 10 M⊙ yr−1). This higher SFR and higher molecular gas content in local AGN could be linked to the nuclear activity. The AGN may have had higher H2 content than SFGs, but this molecular gas may have been used both as the main fuel for SF (resulting in a higher SFR) and for accretion onto the central SMBH (losing H2). The deviation of the low-dust-mass (Mdust < 107.5 M⊙) AGN from the
  –Mdust relation is likely due to the large scatter that affects such a relation, as observed in several studies on nearby galaxies (e.g., Orellana et al. 2017; Ca20). Owing to the higher SFRs, Seyfert 2 galaxies show a larger offset from the MS since δMS depends on the SFR by definition.
5.4. Molecular gas depletion times
The depletion time, that is, the ratio between the molecular gas mass and the SFR, is a widely used indicator (e.g., Daddi et al. 2010; Genzel et al. 2010; Brusa et al. 2018; Koss et al. 2020) of the timescale necessary for the galaxy to convert the available  into new stars at the rate of the currently ongoing SF activity. If the AGN is able to remove part of the molecular gas, this would result in a shorter tdepl with respect to SFGs with similar SFRs. By considering the gas mass computed in Sect. 3.1.4 and the SFR provided by G16, we computed the depletion times for the sample of Seyfert 2 galaxies. We found tdepl in the range 0.1 < tdepl < 7 Gyr (with a median value of ∼1 Gyr; see the right panel of Fig. 7), consistent with what has been reported in previous literature for local AGN (Lbol ∼ 1043 − 46 erg s−1) with similar host-galaxy properties in terms of M⋆ and SFRs (0.1 < tdepl < a few Gyr; e.g., Casasola et al. 2015; Rosario et al. 2018; Koss et al. 2020). Conversely, shorter timescales (0.01 < tdepl < 0.1 Gyrs) for the gas consumption have been observed in the case of high-redshift AGN and quasars (z ∼ 1–3; e.g., Brusa et al. 2018; Kakkad et al. 2017; Talia et al. 2018), likely due to the combined enhancement of both SF and AGN activity at cosmic noon (Madau & Dickinson 2014).
 |
Fig. 7. Depletion time (in units of Gyr) versus the distance from the MS (δMS) in terms of the sSFR (main panel). The Seyfert 2 galaxies are the red diamonds, and the control sample is shown with the gray circles (DustPedia) and green squares (Co19). The dashed region represents the tdepl − δMS relation from Tacconi et al. (2018) in the interval of the Seyfert 2 galaxy stellar masses and redshifts. Upper and right panels: projected histograms of the distance from the MS and the depletion times, respectively, for the AGN sample and the control sample, following the same color coding. |
In the central panel of Fig. 7, we plot the depletion times as a function of the offset from the MS. In the top panel of Fig. 7, the histogram of δMS is shown: Seyfert 2 galaxies show systematically larger distances from the MS with respect to the distribution of SFGs. Looking at the depletion time distribution for the Seyfert 2 galaxies and the control sample (right panel of Fig. 7), both samples peak in a similar regime (mean tdepl ∼ 0.6 and 1 Gyr for the AGN and control samples, respectively), but the KS test rules out the two samples being drawn from a common distribution (p ∼ 0.01). The low p-value is likely driven by the large tail of DustPedia galaxies with relatively long tdepl. We also test how the distribution of tdepl for the AGN changes by assuming αCO = 4.3 M⊙ pc−2 (K km s−1)−1 for both AGN and SFGs. In this case, we find that the Seyfert 2 galaxies and the control sample are statistically indistinguishable (p = 0.8), with the resulting tdepl distribution for AGN peaking at tdepl ∼ 0.9 Gyr. Conversely, by shifting the tdepl for the AGN along the vertical axis, which is equivalent to assuming progressively smaller αCO values down to αCO = 1.1 M⊙ pc−2 (K km s−1)−1, the tdepl distribution would consequently be shifted toward lower values, making it deviate significantly from that of SFGs (p < 0.001) and bringing them closer to the MS. At the same time, the large δMS of AGN cause them to deviate from the trend observed in MS galaxies, represented by the relation by Tacconi et al. (2018), which describes the expected tdepl for MS galaxies, at a given M⋆ and redshift (shown in Fig. 7 at the representative median redshift and M⋆ of the Seyfert 2 galaxies).
We conclude that the sample of local Seyfert 2 galaxies covers the shorter-tdepl regime of local galaxies, with ∼70% of the AGN sample having tdepl ∼ 0.3 − 1.0 Gyr, while the corresponding fraction of SFGs show tdepl ∼ 0.3 − 3.0 Gyr), which makes the distributions statistically different.
5.5. PAH as tracer of the molecular gas
The LIR–LPAH relation has been widely used as a diagnostic to distinguish between different galaxy populations (e.g., MS, starburst, and AGN; e.g., Co19; Minsley et al. 2020) as they tend to occupy different parts of the diagram. When comparing LPAH at a given LIR between AGN and SFGs, AGN usually appear as outliers of the relation, suggesting that LPAH can be used to assess the impact of the AGN emission in the central region of the galaxy with respect to other excitation mechanisms. Since only the Co19 sample has available PAH feature measurements, in this section we only compare the AGN sample to the Co19 SFGs, as shown in Fig. 8.
 |
Fig. 8. The emission from PAH features. Top-left panel: 6.2 μm PAH feature luminosity versus infrared luminosity. Seyfert 2 galaxies are shown as red diamonds, and green squares and blue triangles indicate the inactive and active galaxies in the Co19 sample, classified based on the EW of the PAH features at 6.2 and 11.3 μm. The best-fit relation is the solid black line (best-fit parameters are reported in the lower-right corner), and the dotted gray line is the result of the best fit from Co19. Top-right panel: 11.3 μm PAH feature luminosity versus infrared luminosity for the Seyfert 2 galaxies. Points and lines are coded as in the left panel. Bottom panels, from left to right: 6.2 μm and 11.3 μm PAH luminosity, respectively, versus the bolometric luminosity of the AGN, derived from the broadband SED decomposition performed by G16. Data are color-coded as a function of the fraction of the AGN emission with respect to the galaxy global outcome in the 5–40 μm band. Dashed (dotted) lines are the best-fit relation for the subsample of AGN with fAGN < 0.4 (> 0.4). |
The luminosity of the MIR features provided by HC11 (i.e., the PAH at 6.2 and 11.3 μm) scale with the infrared luminosity, as observed in many local objects (e.g., Alonso-Herrero et al. 2016; Jensen et al. 2017; Kirkpatrick et al. 2017), even in the presence of nuclear activity. We performed a linear fit of the LIR–LPAH relation, log(LPAH) = αlog(LIR)+β, for both the PAH features at 6.2 and 11.3 μm. The results of this fit are presented in Fig. 8. We found a slope (α = 1.05 ± 0.02) slightly steeper than that in Co19 and a significantly lower normalization (βCortzen + 19 − βthis work ∼ 0.6 dex). The sample of active galaxies shows lower 6.2 μm PAH luminosity for a given LIR, suggesting a potential effect of the nuclear activity on the emission of this MIR feature. Furthermore, to test the consistency of the LPAH, 6.2 μm deficiency in galaxies with ongoing nuclear activity, in the top-left panel of Fig. 8 we include the active objects from Co19 (i.e., 61 AGN, or composites, with EW6.2 μm < 0.4 μm; see also Sargsyan et al. 2012; Stierwalt et al. 2014), which were previously excluded on the basis of the EW selection criteria. Indeed, lower LPAH–LIR ratios have been reported in active galaxies compared to SFGs (e.g., Armus et al. 2007; Valiante et al. 2007; Sajina et al. 2008; Diamond-Stanic & Rieke 2010), suggesting that the strong radiation field produced by the AGN can, at least in part, destroy part of PAH molecules rather than exciting them.
We then found similar results for the fit of LPAH, 11.3 μm–LIR (α = 1.03 ± 0.03; see the right panel of Fig. 8). This is in agreement with the literature since the 6 μm feature is likely excited by SF-related emission, while the feature at the longer wavelength could be more affected by the presence of AGN, whose dust-reprocessed emission peaks in the 10–30 μm regime (e.g., Mullaney et al. 2011). The depleted PAH luminosity in the presence of nuclear activity is consistent with the recent results from García-Bernete et al. (2022), who observed depleted PAH emission in the nuclear region of local AGN and found that AGN-dominated objects show PAH luminosities similar to those of SFGs at larger distances from the nucleus. Thus, the extrapolation of the molecular gas mass from the PAH feature luminosity (e.g., as suggested by Co19) can induce a significant underestimation of  if the presence of nuclear activity has not been properly identified, as happens in the case of heavy extinction of weak nuclear emission; this is the case of some local, extremely obscured Seyfert 2 galaxies (e.g., Marchesi et al. 2018).
To further investigate how the presence of nuclear activity may affect LPAH, in the lower panels of Fig. 8 we plot the 6.2 μm and 11.3 μm PAH luminosity, respectively, versus the bolometric luminosity of the AGN ( ) provided by G16. Following G16 (see Fig. 10 in G16), we divided the sample into two subsamples on the basis of the relative contribution of the AGN (fAGN) to the global outcome of the source in the 5–40 μm band, and we fit the two subsamples separately. We find that AGN with a larger contribution of the AGN to the MIR outcome of the galaxy,
  , show fainter PAH emission (for both the 6.2 μm and 11.3 μm features) for a given AGN bolometric luminosity. The fainter LPAH for larger contributions from the AGN dust-reprocessed emission (fAGN) at a given AGN bolometric luminosity supports the hypothesis of a negative effect of nuclear activity on the emission from PAH molecules. This trend is clearly visible for the emission from both the 6.2 and 11.3 μm features, which arises primarily from ionized and neutral PAH molecules, respectively, suggesting that the AGN emission affects both molecular phases (we refer to Li 2020 for more details). García-Bernete et al. (2022) found higher 11.3-to-6.2 μm luminosity ratios in AGN with respect to SFGs, which is in contrast with our results and likely due to the large presence (∼56%) of Seyfert 1 objects in their sample of AGN. We conclude that the impact of AGN emission on the ISM is clearly visible in the case of PAH emission, when the AGN is able to reduce the emission from molecules or destroy them. In conclusion, it is worth mentioning that Tommasin et al. (2010) attributed at least part of the depleted PAH emission in active galaxies to the stronger AGN continuum, which is a relevant contribution to the MIR emission in galaxies. However, Tommasin et al. (2010) suggested that this effect is more prominent in unobscured Seyfert galaxies (i.e., type 1), while stacked MIR spectra of Seyfert 2 objects resemble those of non-Seyfert and starburst sources. In the future, to definitively assess the impact of the AGN emission on the ISM, as well as its ability to impact the SF activity, we need highly spatially resolved observations (e.g., using ALMA to trace the CO emission down to the giant molecular cloud scale, ∼50 − 100 pc, and future James Webb Space Telescope observations for the MIR features) to study the properties and the physical condition of the ISM.
6. Summary and conclusions
In this work we have studied the properties of a sample of 33 local Seyfert 2 galaxies with the aim of understanding the impact of nuclear activity on the host-galaxy molecular gas content and SF activity. By considering new and archival CO spectroscopic data, we have estimated the mass of the molecular component of the ISM – the key ingredient for forming new stars. We exploited the results of the detailed SED decomposition from G16, which provides a characterization of each galaxy in terms of M⋆, SFR, LIR, and emission from the AGN. By comparing the molecular gas content (MH2) and the relative depletion time in the sample of local Seyfert 2 galaxies matched in terms of different host-galaxy properties (M⋆, SFR, and Mdust) to a control sample of SFGs, we investigated whether the nuclear activity affects the host-galaxy molecular gas reservoir. Furthermore, we investigated the effect of the nuclear activity on the PAH features, which are widely used as tracers of SF activity despite the fact that the presence of an AGN can actually affect their luminosity – AGN have been observed to both suppress and enhance PAH emission (e.g., Sajina et al. 2008; Jensen et al. 2017, respectively).
The main results of this work are as follows:
-
Aperture-corrected molecular gas masses for 33 objects, derived by converting low-J CO luminosity obtained from new and archival single-dish observations, have been provided.
-
The Seyfert 2 galaxies with M⋆ < 1010.5 M⊙ show larger molecular gas masses and fractions compared to SFGs (with similar M⋆), while they cannot be distinguished from SFGs in terms of the molecular gas content at larger M⋆. This is likely due to the presence of more actively star-forming galaxies in the low-M⋆ regime in the AGN sample with respect to the control sample.
-
The
 content of AGN is similar to that of SFGs when the two samples are matched in terms of SFRs. The AGN that deviate most from the
  -M⋆ trend discussed above are likely hosted in galaxies that are forming new stars at a higher rate (SFR ∼ 5 M⊙ yr−1) than the control-sample galaxies in the same low-M⋆ regime due to the availability of a larger molecular gas reservoir. The tighter correlation we observed between the SFR and the
  content reflects the physical correlation between the ongoing SF activity and the molecular gas reservoir available to form new stars.
 -
When comparing the depletion times between the Seyfert 2 galaxies and the control sample, AGN lie in the short-tdepl regime (∼0.3–1 Gyr) with respect to those observed in SFGs. However, the observed range of tdepl in the Seyfert 2 sample is consistent with values expected for both local AGN and normal galaxies, which confirms that the local AGN do not significantly reduce the global molecular gas content of the host galaxy. The Seyfert 2 galaxies show significantly larger distances from the MS, as parametrized in terms of the sSFR, irrespective of tdepl. This effect is driven by the higher SFR observed in the low-M⋆ regime of AGN with respect to SFGs.
-
By studying the LPAH-LIR scaling relations with the PAH features at 6.2 and 11.3 μm, we find that the sample of local Seyfert 2 galaxies shows lower LPAH/LIR ratios with respect to SFGs, as previously observed in AGN-dominated samples. Furthermore, when studying the PAH emission as a function of the AGN bolometric luminosity, we find that objects with a larger contribution from the AGN in the MIR fAGN show fainter PAH emission. This suggests that in obscured AGN the nuclear activity, being more efficient when the AGN emission dominates the MIR regime, is able to suppress, at least in part, the emission of PAH features.
Finally, we find no clear evidence that local AGN can significantly reduce the global molecular gas reservoir of their host galaxy. This is consistent with the depleted emission from the molecular gas observed in recent highly spatially resolved studies of the nuclear regions of local Seyfert galaxies (e.g., García-Burillo et al. 2021) and in AGN-dominated sub-galactic-scale regions (a few kiloparsecs; e.g., Ellison et al. 2021).
The future scope of this work will include multiwavelength, highly spatially resolved data to investigate the properties and physical conditions of the molecular gas component in the central region of local Seyfert galaxies. Namely, by combining interferometric observations that trace the molecular gas (such as from ALMA and NOEMA) with optical data (from MUSE/VLT) to determine the ISM metallicity (e.g., see Kreckel et al. 2019), and thanks to the advent of the James Webb Space Telescope, which provides spatially resolved observations of the MIR features, we will finally be able to assess the effect of AGN activity on the ISM at increasing distance from the nucleus. In this regard, the infrared-selected sample of local Seyfert galaxies presented here (up to 30% of the sample presented by G16 have interferometric observations) represents an ideal reference sample for understanding the interplay between SF and AGN activity.
See also https://irsa.ipac.caltech.edu/data/SPITZER/docs/files/spitzer/irs_pocketguide.pdf for further details on the Spitzer/IRS specifications.
log(GDR) = (10.54 ± 1.0)−(0.99 ± 0.12)×(12 + log(O/H)), from Magdis et al. (2012).
Acknowledgments
We are grateful to the anonymous referee for her/his constructive comments and suggestions, which helped improving the quality of the paper. Grateful thanks to M. Talia and A. Giannetti for his important contribution to design the proposal for the APEX observations (project 0103.F-9311, PI: Salvestrini) which have been used in this work. We are grateful to A. Feltre and L. Marchetti for providing us with SALT optical emission lines measurements for two galaxies in our sample prior to publication (projects: 2018-1-SCI-029 and 2020-2-MLT-006, PI: L. Marchetti; Feltre et al., in prep.). The author is thankful to ESO for providing him valuable hospitality for a five-months visiting period, during which part of this work was pursued. F.S., V.C. and F.P. acknowledge funding from the INAF mainstream 2018 program ”Gas-DustPedia: A definitive view of the ISM in the Local Universe“. S.M. acknowledges funding from the INAF ”Progetti di Ricerca di Rilevante Interesse Nazionale“ (PRIN), Bando 2019 (project: ”Piercing through the clouds: a multi-wavelength study of obscured accretion in nearby supermassive black holes“). S.A., gratefully acknowledges support from an ERC Advanced Grant 789410. Based on observations collected at the European Southern Observatory under ESO programme 0103.F-9311(A) with the Atacama Pathfinder EXperiment (APEX) telescope. APEX is a collaboration between the Max Planck Institute for Radio Astronomy, the European Southern Observatory, and the Onsala Space Observatory. Swedish observations on APEX are supported through Swedish Research Council grant No 2017-00648. The time granted was used to obtain data for the target of this work. This research has made use of the NASA/IPAC Extragalactic Database (NED), which is funded by the National Aeronautics and Space Administration and operated by the California Institute of Technology. We acknowledge the usage of the HyperLeda database (http://leda.univ-lyon1.fr).
References
- Albrecht, M., Krügel, E., & Chini, R. 2007, A&A, 462, 575 [NASA ADS] [CrossRef] [EDP Sciences] [Google Scholar]
- Alonso-Herrero, A., Ramos Almeida, C., Esquej, P., et al. 2014, MNRAS, 443, 2766 [NASA ADS] [CrossRef] [Google Scholar]
- Alonso-Herrero, A., Esquej, P., Roche, P. F., et al. 2016, MNRAS, 455, 563 [NASA ADS] [CrossRef] [Google Scholar]
- Alonso-Herrero, A., Pereira-Santaella, M., García-Burillo, S., et al. 2018, ApJ, 859, 144 [Google Scholar]
- Armus, L., Charmandaris, V., Bernard-Salas, J., et al. 2007, ApJ, 656, 148 [NASA ADS] [CrossRef] [Google Scholar]
- Asplund, M., Grevesse, N., Sauval, A. J., & Scott, P. 2009, ARA&A, 47, 481 [NASA ADS] [CrossRef] [Google Scholar]
- Berta, S., Lutz, D., Santini, P., et al. 2013, A&A, 551, A100 [NASA ADS] [CrossRef] [EDP Sciences] [Google Scholar]
- Bertram, T., Eckart, A., Fischer, S., et al. 2007, A&A, 470, 571 [NASA ADS] [CrossRef] [EDP Sciences] [Google Scholar]
- Bolatto, A. D., Wolfire, M., & Leroy, A. K. 2013, ARA&A, 51, 207 [CrossRef] [Google Scholar]
- Boselli, A., Cortese, L., & Boquien, M. 2014, A&A, 564, A65 [NASA ADS] [CrossRef] [EDP Sciences] [Google Scholar]
- Brusa, M., Cresci, G., Daddi, E., et al. 2018, A&A, 612, A29 [NASA ADS] [CrossRef] [EDP Sciences] [Google Scholar]
- Bruzual, G., & Charlot, S. 2003, MNRAS, 344, 1000 [NASA ADS] [CrossRef] [Google Scholar]
- Cano-Díaz, M., Maiolino, R., Marconi, A., et al. 2012, A&A, 537, L8 [NASA ADS] [CrossRef] [EDP Sciences] [Google Scholar]
- Carniani, S., Marconi, A., Maiolino, R., et al. 2015, A&A, 580, A102 [NASA ADS] [CrossRef] [EDP Sciences] [Google Scholar]
- Casasola, V., Hunt, L., Combes, F., & García-Burillo, S. 2015, A&A, 577, A135 [NASA ADS] [CrossRef] [EDP Sciences] [Google Scholar]
- Casasola, V., Cassarà, L. P., Bianchi, S., et al. 2017, A&A, 605, A18 [NASA ADS] [CrossRef] [EDP Sciences] [Google Scholar]
- Casasola, V., Bianchi, S., De Vis, P., et al. 2020, A&A, 633, A100 [NASA ADS] [CrossRef] [EDP Sciences] [Google Scholar]
- Casey, C. M., Narayanan, D., & Cooray, A. 2014, Phys. Rep., 541, 45 [Google Scholar]
- Chabrier, G. 2003, PASP, 115, 763 [Google Scholar]
- Cicone, C., Maiolino, R., Sturm, E., et al. 2014, A&A, 562, A21 [NASA ADS] [CrossRef] [EDP Sciences] [Google Scholar]
- Clark, C. J. R., Verstocken, S., Bianchi, S., et al. 2018, A&A, 609, A37 [NASA ADS] [CrossRef] [EDP Sciences] [Google Scholar]
- Combes, F., García-Burillo, S., Casasola, V., et al. 2013, A&A, 558, A124 [NASA ADS] [CrossRef] [EDP Sciences] [Google Scholar]
- Cortzen, I., Garrett, J., Magdis, G., et al. 2019, MNRAS, 482, 1618 [NASA ADS] [CrossRef] [Google Scholar]
- Cresci, G., & Maiolino, R. 2018, Nat. Astron., 2, 179 [Google Scholar]
- Csengeri, T., Weiss, A., Wyrowski, F., et al. 2016, A&A, 585, A104 [NASA ADS] [CrossRef] [EDP Sciences] [Google Scholar]
- da Cunha, E., Charlot, S., & Elbaz, D. 2008, MNRAS, 388, 1595 [Google Scholar]
- Daddi, E., Elbaz, D., Walter, F., et al. 2010, ApJ, 714, L118 [NASA ADS] [CrossRef] [Google Scholar]
- Daddi, E., Dannerbauer, H., Liu, D., et al. 2015, A&A, 577, A46 [NASA ADS] [CrossRef] [EDP Sciences] [Google Scholar]
- Davies, J. I., Baes, M., Bianchi, S., et al. 2017, PASP, 129, 044102 [NASA ADS] [CrossRef] [Google Scholar]
- de Vaucouleurs, G., de Vaucouleurs, A., Corwin, Jr., H. G., et al. 1991, S&T, 82, 621 [Google Scholar]
- Diamond-Stanic, A. M., & Rieke, G. H. 2010, ApJ, 724, 140 [NASA ADS] [CrossRef] [Google Scholar]
- Ellison, S. L., Wong, T., Sánchez, S. F., et al. 2021, MNRAS, 505, L46 [NASA ADS] [CrossRef] [Google Scholar]
- Esposito, F., Vallini, L., Pozzi, F., et al. 2022, MNRAS, 512, 686 [NASA ADS] [CrossRef] [Google Scholar]
- Feltre, A., Hatziminaoglou, E., Fritz, J., & Franceschini, A. 2012, MNRAS, 426, 120 [Google Scholar]
- Fernández-Ontiveros, J. A., Dasyra, K. M., Hatziminaoglou, E., et al. 2020, A&A, 633, A127 [Google Scholar]
- Feruglio, C., Maiolino, R., Piconcelli, E., et al. 2010, A&A, 518, L155 [NASA ADS] [CrossRef] [EDP Sciences] [Google Scholar]
- Fiore, F., Feruglio, C., Shankar, F., et al. 2017, A&A, 601, A143 [NASA ADS] [CrossRef] [EDP Sciences] [Google Scholar]
- Fluetsch, A., Maiolino, R., Carniani, S., et al. 2019, MNRAS, 483, 4586 [NASA ADS] [Google Scholar]
- Foreman-Mackey, D., Hogg, D. W., Lang, D., & Goodman, J. 2013, PASP, 125, 306 [Google Scholar]
- Fritz, J., Franceschini, A., & Hatziminaoglou, E. 2006, MNRAS, 366, 767 [Google Scholar]
- García-Bernete, I., Rigopoulou, D., Alonso-Herrero, A., et al. 2022, MNRAS, 509, 4256 [Google Scholar]
- García-Burillo, S., Combes, F., Hunt, L. K., et al. 2003, A&A, 407, 485 [NASA ADS] [CrossRef] [EDP Sciences] [Google Scholar]
- García-Burillo, S., Combes, F., Usero, A., et al. 2014, A&A, 567, A125 [Google Scholar]
- García-Burillo, S., Alonso-Herrero, A., Ramos Almeida, C., et al. 2021, A&A, 652, A98 [NASA ADS] [CrossRef] [Google Scholar]
- Genzel, R., Tacconi, L. J., Gracia-Carpio, J., et al. 2010, MNRAS, 407, 2091 [NASA ADS] [CrossRef] [Google Scholar]
- Giannetti, A., Leurini, S., Wyrowski, F., et al. 2017, A&A, 603, A33 [NASA ADS] [CrossRef] [EDP Sciences] [Google Scholar]
- Gruppioni, C., Berta, S., Spinoglio, L., et al. 2016, MNRAS, 458, 4297 [Google Scholar]
- Güsten, R., Nyman, L. Å., Schilke, P., et al. 2006, A&A, 454, L13 [NASA ADS] [CrossRef] [EDP Sciences] [Google Scholar]
- Hernán-Caballero, A., & Hatziminaoglou, E. 2011, MNRAS, 414, 500 [CrossRef] [Google Scholar]
- Hönig, S. F., Kishimoto, M., Gandhi, P., et al. 2010, A&A, 515, A23 [CrossRef] [EDP Sciences] [Google Scholar]
- Jensen, J. J., Hönig, S. F., Rakshit, S., et al. 2017, MNRAS, 470, 3071 [NASA ADS] [CrossRef] [Google Scholar]
- Jiménez-Donaire, M. J., Bigiel, F., Leroy, A. K., et al. 2019, ApJ, 880, 127 [CrossRef] [Google Scholar]
- Kakkad, D., Mainieri, V., Brusa, M., et al. 2017, MNRAS, 468, 4205 [Google Scholar]
- Kennicutt, R. C., Jr. 1998, ARA&A, 36, 189 [Google Scholar]
- Kirkpatrick, A., Alberts, S., Pope, A., et al. 2017, ApJ, 849, 111 [NASA ADS] [CrossRef] [Google Scholar]
- Komatsu, E., Dunkley, J., Nolta, M. R., et al. 2009, ApJS, 180, 330 [NASA ADS] [CrossRef] [Google Scholar]
- Koss, M. J., Strittmatter, B., Lamperti, I., et al. 2020, ApJS, 252, 29 [Google Scholar]
- Kreckel, K., Ho, I. T., Blanc, G. A., et al. 2019, ApJ, 887, 80 [NASA ADS] [CrossRef] [Google Scholar]
- Leroy, A. K., Walter, F., Bigiel, F., et al. 2009, AJ, 137, 4670 [Google Scholar]
- Leroy, A. K., Bolatto, A., Gordon, K., et al. 2011, ApJ, 737, 12 [Google Scholar]
- Leroy, A. K., Schinnerer, E., Hughes, A., et al. 2021, ApJS, 257, 43 [NASA ADS] [CrossRef] [Google Scholar]
- Li, A. 2020, Nat. Astron., 4, 339 [CrossRef] [Google Scholar]
- Lisenfeld, U., Espada, D., Verdes-Montenegro, L., et al. 2011, A&A, 534, A102 [NASA ADS] [CrossRef] [EDP Sciences] [Google Scholar]
- Madau, P., & Dickinson, M. 2014, ARA&A, 52, 415 [Google Scholar]
- Magdis, G. E., Elbaz, D., Dickinson, M., et al. 2011, A&A, 534, A15 [NASA ADS] [CrossRef] [EDP Sciences] [Google Scholar]
- Magdis, G. E., Daddi, E., Sargent, M., et al. 2012, ApJ, 758, L9 [NASA ADS] [CrossRef] [Google Scholar]
- Magdis, G. E., Rigopoulou, D., Helou, G., et al. 2013, A&A, 558, A136 [NASA ADS] [CrossRef] [EDP Sciences] [Google Scholar]
- Maiolino, R., Ruiz, M., Rieke, G. H., & Papadopoulos, P. 1997, ApJ, 485, 552 [NASA ADS] [CrossRef] [Google Scholar]
- Makarov, D., Prugniel, P., Terekhova, N., Courtois, H., & Vauglin, I. 2014, A&A, 570, A13 [NASA ADS] [CrossRef] [EDP Sciences] [Google Scholar]
- Malkan, M. A., Jensen, L. D., Rodriguez, D. R., Spinoglio, L., & Rush, B. 2017, ApJ, 846, 102 [NASA ADS] [CrossRef] [Google Scholar]
- Marchesi, S., Ajello, M., Marcotulli, L., et al. 2018, ApJ, 854, 49 [Google Scholar]
- Mingozzi, M., Vallini, L., Pozzi, F., et al. 2018, MNRAS, 474, 3640 [NASA ADS] [CrossRef] [Google Scholar]
- Minsley, R., Petric, A., Lambrides, E., et al. 2020, Am. Astron. Soc. Meeting Abstracts, 235, 304.09 [NASA ADS] [Google Scholar]
- Mullaney, J. R., Alexander, D. M., Goulding, A. D., & Hickox, R. C. 2011, MNRAS, 414, 1082 [Google Scholar]
- Narayanan, D., Krumholz, M. R., Ostriker, E. C., & Hernquist, L. 2012, MNRAS, 421, 3127 [NASA ADS] [CrossRef] [Google Scholar]
- Nersesian, A., Xilouris, E. M., Bianchi, S., et al. 2019, A&A, 624, A80 [NASA ADS] [CrossRef] [EDP Sciences] [Google Scholar]
- Oh, K., Koss, M., Markwardt, C. B., et al. 2018, ApJS, 235, 4 [Google Scholar]
- Orellana, G., Nagar, N. M., Elbaz, D., et al. 2017, A&A, 602, A68 [NASA ADS] [CrossRef] [EDP Sciences] [Google Scholar]
- Papadopoulos, P. P., van der Werf, P. P., Xilouris, E. M., et al. 2012, MNRAS, 426, 2601 [NASA ADS] [CrossRef] [Google Scholar]
- Pérez-Montero, E., & Contini, T. 2009, MNRAS, 398, 949 [CrossRef] [Google Scholar]
- Pettini, M., & Pagel, B. E. J. 2004, MNRAS, 348, L59 [NASA ADS] [CrossRef] [Google Scholar]
- Pozzi, F., Vallini, L., Vignali, C., et al. 2017, MNRAS, 470, L64 [NASA ADS] [CrossRef] [Google Scholar]
- Puglisi, A., Daddi, E., Renzini, A., et al. 2017, ApJ, 838, L18 [Google Scholar]
- Puschnig, J., Hayes, M., Östlin, G., et al. 2020, A&A, 644, A10 [NASA ADS] [CrossRef] [EDP Sciences] [Google Scholar]
- Rahman, M., Pearson, L., & Heien, H. 2006, Bull. Malaysian Math. Sci. Soc. Sec. Ser., 25, 1 [Google Scholar]
- Rosario, D. J., Burtscher, L., Davies, R. I., et al. 2018, MNRAS, 473, 5658 [NASA ADS] [CrossRef] [Google Scholar]
- Rush, B., Malkan, M. A., & Spinoglio, L. 1993, ApJS, 89, 1 [NASA ADS] [CrossRef] [Google Scholar]
- Saintonge, A., Kauffmann, G., Kramer, C., et al. 2011, MNRAS, 415, 32 [NASA ADS] [CrossRef] [Google Scholar]
- Saintonge, A., Catinella, B., Tacconi, L. J., et al. 2017, ApJS, 233, 22 [Google Scholar]
- Sajina, A., Yan, L., Lutz, D., et al. 2008, ApJ, 683, 659 [NASA ADS] [CrossRef] [Google Scholar]
- Salvestrini, F., Gruppioni, C., Pozzi, F., et al. 2020, A&A, 641, A151 [NASA ADS] [CrossRef] [EDP Sciences] [Google Scholar]
- Sandstrom, K. M., Leroy, A. K., Walter, F., et al. 2013, ApJ, 777, 5 [Google Scholar]
- Sargent, M. T., Daddi, E., Béthermin, M., et al. 2014, ApJ, 793, 19 [NASA ADS] [CrossRef] [Google Scholar]
- Sargsyan, L., Lebouteiller, V., Weedman, D., et al. 2012, ApJ, 755, 171 [Google Scholar]
- Shi, Y., Helou, G., Yan, L., et al. 2011, ApJ, 733, 87 [NASA ADS] [CrossRef] [Google Scholar]
- Solomon, P. M., & Vanden Bout, P. A. 2005, ARA&A, 43, 677 [NASA ADS] [CrossRef] [Google Scholar]
- Solomon, P. M., Downes, D., Radford, S. J. E., & Barrett, J. W. 1997, ApJ, 478, 144 [NASA ADS] [CrossRef] [Google Scholar]
- Sorai, K., Kuno, N., Muraoka, K., et al. 2019, PASJ, 71, S14 [Google Scholar]
- Speagle, J. S., Steinhardt, C. L., Capak, P. L., & Silverman, J. D. 2014, ApJS, 214, 15 [Google Scholar]
- Spoon, H. W. W., Marshall, J. A., Houck, J. R., et al. 2007, ApJ, 654, L49 [Google Scholar]
- Stierwalt, S., Armus, L., Charmandaris, V., et al. 2014, ApJ, 790, 124 [NASA ADS] [CrossRef] [Google Scholar]
- Tacconi, L. J., Neri, R., Chapman, S. C., et al. 2006, ApJ, 640, 228 [NASA ADS] [CrossRef] [Google Scholar]
- Tacconi, L. J., Genzel, R., Saintonge, A., et al. 2018, ApJ, 853, 179 [Google Scholar]
- Talia, M., Pozzi, F., Vallini, L., et al. 2018, MNRAS, 476, 3956 [NASA ADS] [CrossRef] [Google Scholar]
- Tommasin, S., Spinoglio, L., Malkan, M. A., & Fazio, G. 2010, ApJ, 709, 1257 [NASA ADS] [CrossRef] [Google Scholar]
- Valiante, E., Lutz, D., Sturm, E., et al. 2007, ApJ, 660, 1060 [NASA ADS] [CrossRef] [Google Scholar]
- Webb, N. A., Coriat, M., Traulsen, I., et al. 2020, A&A, 641, A136 [NASA ADS] [CrossRef] [EDP Sciences] [Google Scholar]
- Wu, Y., Helou, G., Armus, L., et al. 2010, ApJ, 723, 895 [NASA ADS] [CrossRef] [Google Scholar]
- Young, J. S., & Scoville, N. Z. 1991, ARA&A, 29, 581 [Google Scholar]
Appendix A: Kolmogorov-Smirnov tests
Here we show the histograms of the p-value distributions obtained by repeating the KS test on the 1000 copies of the AGN and SFG samples for each of their properties, as described in Sect. 5. The galaxy property for which we tested the potential differences in the distribution between the AGN and the control sample is reported in the title of each panel. We also tested the distribution of a given quantity (e.g.,  ) in two different regimes for another physical quantity (e.g., M⋆) by splitting the sample on the basis of a given threshold; for example, in the central row of Fig. A.1, the
  distributions of AGN and SFGs with M⋆ values smaller (left panel) and larger (right panel) than 1010.5 M⊙ are shown.
 |
Fig. A.1. KS tests: results. Upper panels: Histograms of the p-values of the KS test performed on the simulated M⋆ (left panel) and SFR (right panel) distributions of AGN and the control sample of SFGs. On the y axis, the logarithm of the number of entries is divided into ten equally log-spaced bins, and the p-values resulting from the 1000 KS tests are reported on the x axis. The threshold above which we cannot reject the null hypothesis that the samples are drawn from the same distribution is represented by a vertical, dashed black line at p = 0.05. Central panels: Same as the upper row, but with Mdust (left panel) and |


 |
Fig. A.1. Continued, top panels: Distribution of p-values obtained by comparing |


All Tables
Properties for the studied AGN sample and the control samples from Ca20 (DustPedia) and Co19 (5MUSES), after removing AGN-dominated objects.
All Figures
|
Fig. 1. Continuum-subtracted CO(2–1) emission line profile for 23 Seyfert 2 galaxies observed by APEX. Fluxes are expressed as antenna temperatures ( |
| In the text | |
|
Fig. 1. continued. |
| In the text | |
|
Fig. 2. Infrared versus CO(1–0) luminosity. Bottom: aperture-corrected CO(1–0) luminosity ( |
| In the text | |
|
Fig. 3. Example of a decomposed SED (from G16). The unabsorbed stellar component (blue line) is scaled down due to the dust absorption to match observations (black dots). The resulting absorbed stellar emission is represented in orange. In the MIR band, the dusty torus component is shown with the dashed green line, and the dust reemission in the FIR is in gray. |
| In the text | |
|
Fig. 4. Properties of the Seyfert 2 galaxies and control samples. Left panels: SFR (top row) and dust mass (bottom row) as a function of the stellar mass (M⋆) for Seyfert 2 galaxies (red diamonds) and the control sample (gray circles for DustPedia galaxies and green squares for 5MUSES sources). For purely illustrative purposes, the best-fit trend (dashed black line) for the control sample of inactive galaxies is shown, and the two dotted black lines are the same trend shifted by a factor of 0.5 dex in either direction. The best-fit slope (α) and normalization (β) are reported in each panel. Right panels: same SFR-M⋆ and Mdust − M⋆ planes as in the left panels, but with binned data to underline the average trend of active and inactive galaxies. The bins were chosen to include the same number of sources. The mean value and the error bars (standard deviations) in each bin were determined with a bootstrap procedure using 10 000 iterations. |
| In the text | |
|
Fig. 5. Comparison of the molecular gas properties, part I. Left panels: scaling relations of the molecular gas mass (MH2) as a function of the host-galaxy stellar mass (M⋆; top row) and SFR (bottom row); in the central panel, we show the molecular gas fraction (fmol = MH2/M⋆) as a function of M⋆. Seyfert 2 galaxies are shown as red diamonds, and the control sample is represented by gray circles (DustPedia) and green squares (5MUSES). For purely illustrative purposes, the best-fit trend (dashed black line) for the control sample of inactive galaxies is shown, and the two dotted black lines are the same trend shifted by a factor of 0.5 dex in either direction. The best-fit slope (α) and normalization (β) are reported in each panel. Right panels: same scaling relations as in the left panels, but with binned data to underline the average trend of active and inactive galaxies. The red-shaded regions represent the range of |
| In the text | |
|
Fig. 6. Comparison of the molecular gas properties, part II. Left panels: molecular gas mass (MH2) versus the offset from the MS (derived assuming the relation by Sargent et al. 2014; top panel) and host-galaxy dust mass (Mdust; bottom panel). Seyfert 2 galaxies are shown with red diamonds, and the control sample is represented by gray circles (DustPedia) and green squares (Co19). Bottom panel: we show the MH2 − Mdust diagram, where the MH2 of the 33 5MUSES SFGs were derived from the CO luminosity (Co19), assuming αCO = 4.3 M⊙ pc−2 (K km s−1)−1. We do not represent the entire sample of 5MUSES SFGs since their |
| In the text | |
|
Fig. 7. Depletion time (in units of Gyr) versus the distance from the MS (δMS) in terms of the sSFR (main panel). The Seyfert 2 galaxies are the red diamonds, and the control sample is shown with the gray circles (DustPedia) and green squares (Co19). The dashed region represents the tdepl − δMS relation from Tacconi et al. (2018) in the interval of the Seyfert 2 galaxy stellar masses and redshifts. Upper and right panels: projected histograms of the distance from the MS and the depletion times, respectively, for the AGN sample and the control sample, following the same color coding. |
| In the text | |
|
Fig. 8. The emission from PAH features. Top-left panel: 6.2 μm PAH feature luminosity versus infrared luminosity. Seyfert 2 galaxies are shown as red diamonds, and green squares and blue triangles indicate the inactive and active galaxies in the Co19 sample, classified based on the EW of the PAH features at 6.2 and 11.3 μm. The best-fit relation is the solid black line (best-fit parameters are reported in the lower-right corner), and the dotted gray line is the result of the best fit from Co19. Top-right panel: 11.3 μm PAH feature luminosity versus infrared luminosity for the Seyfert 2 galaxies. Points and lines are coded as in the left panel. Bottom panels, from left to right: 6.2 μm and 11.3 μm PAH luminosity, respectively, versus the bolometric luminosity of the AGN, derived from the broadband SED decomposition performed by G16. Data are color-coded as a function of the fraction of the AGN emission with respect to the galaxy global outcome in the 5–40 μm band. Dashed (dotted) lines are the best-fit relation for the subsample of AGN with fAGN < 0.4 (> 0.4). |
| In the text | |
|
Fig. A.1. KS tests: results. Upper panels: Histograms of the p-values of the KS test performed on the simulated M⋆ (left panel) and SFR (right panel) distributions of AGN and the control sample of SFGs. On the y axis, the logarithm of the number of entries is divided into ten equally log-spaced bins, and the p-values resulting from the 1000 KS tests are reported on the x axis. The threshold above which we cannot reject the null hypothesis that the samples are drawn from the same distribution is represented by a vertical, dashed black line at p = 0.05. Central panels: Same as the upper row, but with Mdust (left panel) and |
| In the text | |
|
Fig. A.1. Continued, top panels: Distribution of p-values obtained by comparing |
| In the text | |
Current usage metrics show cumulative count of Article Views (full-text article views including HTML views, PDF and ePub downloads, according to the available data) and Abstracts Views on Vision4Press platform.
Data correspond to usage on the plateform after 2015. The current usage metrics is available 48-96 hours after online publication and is updated daily on week days.
Initial download of the metrics may take a while.