| Issue |
A&A
Volume 659, March 2022
|
|
|---|---|---|
| Article Number | A168 | |
| Number of page(s) | 6 | |
| Section | Astrophysical processes | |
| DOI | https://doi.org/10.1051/0004-6361/202142020 | |
| Published online | 22 March 2022 | |
Numerical simulations of the great eruption of η Carinae from the 1840s
I. Revisiting the explosion scenario
1
Instituto de Radioastronomía y Astrofísica (UNAM), A.P. 3-72, 58190 Morelia, Michoacán, México
e-mail: rf.gonzalez@irya.unam.mx
2
Instituto de Ciencias Nucleares (UNAM), A.P. 70-543, 04510 México, México
3
Instituto de Astronomía (UNAM), A.P. 70-264, 04510 México, México
4
Instituto de Astronomia, Geofísica e Ciências Atmosféricas (IAG-USP), Rua do Matão, São Paulo 05508-090, Brazil
Received:
14
August
2021
Accepted:
4
December
2021
In this work, we present new 2D hydrodynamical simulations of the major eruption of η Car in the 1840s, which resulted in the formation of a bipolar nebula that is commonly known as the large Homunculus. In our numerical models, we have included the high-speed component of 10 000 km s−1, which was detected in recent observations, providing direct evidence of an explosive event. Here, we investigate whether such a violent explosion is able to explain both the shape and the dynamical evolution of η Car’s nebula. As in our previous work, we have assumed a two-stage scenario for η Car’s eruption: a slow outflow phase for a few decades before the eruption, followed by the explosive event. From the collision of these outflow phases, the large Homunculus is produced. Our numerical simulations show that such a scenario does not resemble some of the observed physical features and the expansion of the nebula. Notwithstanding, we also explore other injection parameters (mass-loss rate and ejection velocity) for these outflow phases. In particular, we find that an explosion with an intermediate speed of 1000 km s−1 is able to reproduce the morphology and the kinematical age of the large Homunculus.
Key words: stars: individual: η Carinae / stars: winds, outflows / hydrodynamics / shock waves
© ESO 2022
1. Introduction
The origin of the 19th century major eruption of the massive star η Car is still the subject of intense debate (e.g., Portegies Zwart & van den Heuvel 2016; Smith 2006). The η Car system is a bright (4 × 10⁶ L⊙) and massive stellar system that contains an evolved (luminous blue variable, LBV) star with a mass of ∼90 M⊙ and a less massive (∼30 M⊙) main sequence star companion. The orbital period of such an eccentric system (e = 0.9) is only 5.5 yr (Portegies Zwart & van den Heuvel 2016). The primary star of η Car’s system has undergone several eruptive events, the most notorious being the major eruption in the 1840s (Davidson & Humphreys 1997) during which η Car drastically increased its visual magnitude (Humphreys et al. 1999), and it expelled a large amount of mass (≥10 M⊙) into its surroundings (Smith et al. 2003). From this eruption, a bipolar nebula known as the large Homunculus was formed which extends ±9 arcsec along the symmetry axis (corresponding to a physical size of ±3.25 × 1017 cm at a distance of 2.3 Kpc) and expands at a speed of ∼650 km s−1 in the polar direction (see, Smith 2006). Its symmetry axis is inclined ∼45° to the line of sight (Davidson et al. 2001). In addition, there were at least two other outbursts after this event in the 1890s and 1940s. From these eruptions, the so-called little and baby Homunculi were produced, respectively (Ishibashi et al. 2003; Abraham et al. 2014).
The most successful explanation of the nature and the origin of the Homunculus nebula is given by the stellar merger model (Portegies Zwart & van den Heuvel 2016; Smith et al. 2018a). The merger between two massive stars in a triple hierarchical system could account for most of the physical characteristics observed in η Car. These physical features include the kinetic energy (1049.6–1050 erg), the luminosity burst (4 × 10⁶ L⊙), the bipolar shape of the Homunculus, and the two successive stages of the velocity field during the main eruption: one very broad ∼10 000 km s−1 and the other one of ∼600 km s−1 (Smith et al. 2018a). Nonetheless, there are some other models that can explain the nature of the large Homunculus, such as super-Eddington eruptions (Owocki & Shaviv 2016), binary interactions at periastron (Kashi & Soker 2009), and pulsational pair instabilities in a massive star (Woosley 2017), but they do not account for all the observed features in the nebula.
The violent eruption of the mid-19th century suffered by η Car was analogous to a type II supernova explosion, but with lower energy being released to the interstellar medium (ISM) (Ek ∼ 1050 erg over a few years) and, therefore, it is referred to as a supernova impostor (Smith 2013). The extremely broad emission wings of about ∼10 000 km s−1 in the Hα optical lines are likely caused by high-velocity outflowing material that occurred during the explosion (Smith et al. 2018b). In a recent paper, González (2018) investigated through 2D hydrodynamical simulations whether an explosive event is able to explain the shape and kinematics of the large Homunculus nebula. These numerical models revealed that the explosion can in fact explain some observed features in the nebula, such as the present-day double-shell structure and thermal instabilities (Rayleigh-Taylor and Kelvin-Helmholtz) along the dense shell. Nevertheless, the explosion scenario proposed by Smith et al. (2003) could not account for the current physical size of the large Homunculus and, consequently, the estimated age of the nebula. It is noteworthy that these simulations do not include the high-velocity component of ∼10 000 km s−1 reported more recently by Smith et al. (2018a,b). In this work, we revisit 2D numerical simulations of the major eruption of η Car in the 1840s adopting the explosion scenario proposed by Smith (2013), including this component of the outflowing gas in our models.
The paper is organized as follows. In Sect. 2, we describe the model. The numerical simulations and a discussion of the results are presented in Sect. 3. Finally, in Sect. 4 we draw our conclusions.
2. The model
In this work, we assume the two-stage scenario for η Car’s eruption proposed by Smith et al. (2018a): (1) a slow and massive wind phase expelled for a few decades before the 1840s and (2) a lighter and faster explosive event. We carried out two distinct models. In Run A, we adopted an expansion speed of 1000 km s−1 for Stage 2, while in Run B, an extremely high-velocity of 10 000 km s−1 was assumed for the explosion. According to Smith et al. (2018a), from the circumstellar medium (CSM) interaction between the two stages, a dense and fast shell is produced which then became the large Homunculus. Here, we explore such a scenario and investigate whether it is able to explain not only the shape of the nebula, but also some of its observed physical properties, such as the latitude-dependent expansion speed and the estimated dynamical age. It is noteworthy that the formation of the internal nebula (commonly known as the little Homunculus) as well as the high-speed features in the equatorial skirt of η Car have been investigated in our previous works (González et al. 2004a,b, 2010).
For the different outflow phases, we assumed the latitude-dependent ejection velocity and density proposed in González et al. (2010), that is,

and,
respectively, where r0 is the injection radius, and F(θ) = [(v2/v1)+e2z]/[1 + e2z] being z = λ cos(2θ), a function that controls the shape of the Homunculus. Equation (1) is a parametrization for the velocity of a latitude-dependent wind which was first proposed by Icke (1988), and it has been extensively used for modeling aspherical wind bubbles. The constant λ is related to the degree of asymmetry of the outflow, and θ is the polar angle. The speed v1 is related to the expansion velocity vp in the polar direction (θ = 0°), while v2 is related to the corresponding value ve at equator (θ = 90°). From Eqs. (1) and (2), it follows that a constant mass-loss rate per unit solid angle is assumed. It is worth mentioning that González et al. (2010) found the best fit to the observed expansion speed at different latitudes of η Car’s Homunculus (Smith 2006) using λ = 1.9, v1 = 670 km s−1, and v2 = 100 km s−1. Using these parameters, the predicted expansion velocities are vp = 657.5 km s−1 at the poles and ve = 112.5 km s−1 in the equatorial direction (see Fig. 1 of González et al. 2010).
3. Numerical simulations
We performed new gas dynamic 2D numerical simulations of η Car’s major eruption from the 1840s. The simulations were carried out with the adaptive grid Yguazú-A code developed by Raga et al. (2000). This code integrates the continuity, momentum, and energy equations written in “conservation form”. Also, the adaptive grid points were created using linear interpolations, which preserve the energy, mass, and the momenta along the three coordinate axes. The problem that we were treating, though, is highly nonconservative due to the presence of a strong energy loss term. Different tests of the code have been reported by Raga et al. (2000, 2001), Velázquez et al. (2001).
The version of the code that has been used (González 2018) solves the gas dynamic equations, explicitly accounting for the radiative cooling for the atomic and ionic species HI, HII, HeI, HeII, HeIII, CII, CIII, CIV, OI, OII, OIII, and OIV. The cooling rates for the individual ions were calculated with the analytic approximations of Raga et al. (2002), which include the collisionally excited lines and collisional ionization (by free electros), as well as a parametrized cooling rate for high temperatures. A set of rate equations was integrated together with the gas-dynamic equations to compute the nonequilibrium ionization state (with the ions listed above). The abundances (by number, relative to the total number of atoms) are of 0.9 (H), 0.1 (He), 6.6 × 10⁻⁴ (C), and 3.3 × 10⁻⁴ (O).
The calculations were axisymmetric and performed using the flux-vector splitting algorithm of van Leer (1982) on a five-level binary adaptive grid with a maximum resolution of 3.9 × 1014 cm along the two axes. The computational domain extends over (4 × 1017) × (4 × 1017), which was initially filled by a homogeneous medium of density of 10−3 cm−3 and temperature of 102 K.
We should note that in our simulations, we assumed optically thin cooling, but the inner region of the Eta Carinae nebula are likely to be at least partially optically thick. We therefore overestimated the cooling rate (and therefore obtained lower temperatures) in the inner regions of the computed flow.
In Table 1, the models (Runs A-B) performed for η Car’s major eruption are listed. In these models, the adopted parameters of the minor eruption and the winds expelled before and after this eruptive event are taken from González (2018). In addition, the physical conditions for the pre-eruptive wind and the explosion are consistent with the two-stage shock-powered event proposed by Smith et al. (2018a) for η Car’s major eruption. In our numerical models, a standard wind with a terminal velocity of v0 = 250 km s−1 (in the polar direction) and a mass-loss rate of Ṁ0 = 10−3 M⊙ yr−1 is blown from a distance of r0 = 1016 cm with a temperature T0= 105 K into the unperturbed environment. Once the computational domain is filled by this wind, the double-stage of the major eruption occurs.
Models of η Car’s Homunculi: Parameters of the colliding outflows.
In Run A, the slow pre-outburst wind with an ejection velocity of 500 km s−1 (at the poles) and mass-loss rate of Ṁ = 0.7 M⊙ yr−1 is ejected during 20 yr, which results in a total mass of 14 M⊙ that is expelled during this stage and a brief explosion that lasts 1 yr, in which a mass of 1 M⊙ is released with a speed of v = 1000 km s−1 from the central source. Accordingly, the total kinetic energy released during the explosion is ∼1049 erg, which is consistent with the estimated value of 1049.7 by Smith (2013). Afterwards, a post-outburst wind with similar conditions of the current wind (v = 500 km s−1 and Ṁ0 = 10−3 M⊙ yr−1) is ejected until the minor eruption occurs, when the ejection velocity drops (200 km s−1) and the mass-loss rate increases (Ṁ0 = 10−2 M⊙ yr−1). Later, a post-eruption wind with v = 500 km s−1 and Ṁ0 = 10−3 again resumes, and the little Homunculus is formed (Ishibashi et al. 2003). In our previous papers (González et al. 2004a, 2010), the formation and dynamical evolution of the internal nebula has been investigated and, consequently, we focus here on the physical properties of the large Homunculus only.
Figure 1 depicts the predicted density distribution obtained from Run A of η Car’s nebulae. The log-scale map at time t = 172 yr after the major eruption is presented. It can be seen from the figure that the interaction of the different outflow phases produces internal and external nebulae which are consistent with the physical size and the shape of both Homunculi. For the large Homunculus, we obtain a physical extension of the polar lobes of ±3.5 × 1017 cm, expanding at a speed of ≃600 km s−1, which is close to the observed value of ≃650 km s−1 of the Homunculus at high latitudes (Smith 2006). At the equator, the predicted physical size of the nebula across the star is ±9.1 × 1016 cm expanding at ≃140 km s−1. In addition, as predicted in our previous work (González et al. 2010), the inner Homunculus shows the formation of instabilities (Rayleigh-Taylor and Kelvin-Helmholtz) along the polar caps due to the interaction of the lower density post-outburst wind that pushes and accelerates a higher density outflow (the minor eruption from the 1890s). After 172 yr of evolution, they expand at ≃350 km s−1 extending from −1.1 × 1017 cm to +1.1 × 1017 cm along the major axis. It is worth mentioning that in González et al. (2004a, 2010), we showed that the interaction between both Homunculi in the equatorial zone results in the formation of tenuous, high-speed equatorial features (∼1000 km s−1) that seem to be related to the observed equatorial skirt of η Car nebulae. Notwithstanding, we note that these features are not produced in this numerical model, probably because the massive pre-outburst wind has a significant effect on such an interaction. We have assumed in the simulation that 14 M⊙, of a total of 15 M⊙ expelled during the two-stage scenario proposed by Smith et al. (2018a) for η Car’s eruption, are ejected during the pre-outburst wind. In contrast, the numerical models presented in González (2018) assumed 10 M⊙ for each stage, which allows for the formation of the high-speed material at the equator of η Car’s lobes.
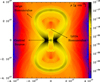 |
Fig. 1. Log-scale density stratification of η Car’s nebulae. The numerical simulation (Run A) corresponds to an evolution time of t = 172 yr since the great eruption in the 1840s. The bar on the right side of the plot is in units of g cm−3, and the computational domain axes are in units of cm. See the text for a physical description of the figure. |
In Fig. 2, we present the stratifications for Run A of the density of ionized hydrogen (top left), pressure (top right), temperature (bottom left), and velocity (bottom right) computed at an evolution time of t = 172 yr after the explosion phase. As we mentioned above, the simulation shows the formation of an external and internal nebulae which are in good agreement with the shape and kinematics of the large and the little Homunculi. The simulation shows a temperature of T ≃ 104 K behind the outer shock, while the mean temperature inside the shocked shell is T ≃ 500 K. In addition, a low-density cavity can be observed between both Homunculi with a temperature of T ≃ 10 K. On the other hand, no equatorial high-speed, low-density features that may be related to the observed equatorial skirt of η Car nebula are produced.
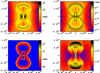 |
Fig. 2. Stratifications for Run A of density of ionized hydrogen (top left), pressure (top right), temperature (bottom left), and velocity (bottom right) computed 172 yr after the great eruption of η Car. The bars on the right side of the panels are in units of cm−3, dyn cm−2, K, and cm s−1, respectively, and the computational domain axes are in units of cm. A further description of the figure is given in the text. |
In Run B, we also assume a slow pre-outburst wind ejected for 20 yr with an ejection velocity of 500 km s−1 (at the poles) and mass-loss rate of Ṁ = 0.7 M⊙ yr−1. Afterwards, a brief explosion that lasts 1 yr occurs, during which a total mass of 0.1 M⊙ is expelled from the central source with a speed of v = 10 000 km s−1 (in the polar direction). It is worth mentioning that in this model we suppose for the explosive event a latitude-dependent mass-loss rate Ṁ ∝ F(θ), so the density n is not a function of θ during this stage (see Sect. 2). Adopting these parameters, the total kinetic energy released during the explosion is ∼1050 erg, which is very close to the estimated value of 1049.7 by Smith (2013) for the great eruption of η Car in the 1840s. The physical conditions for the subsequent outflow phases are the same as Run A. Accordingly, this numerical simulation includes the high-speed component of 10 000–20 000 km s−1 for the explosion stage reported recently by Smith et al. (2018a,b). In addition, it is also remarkable that, as pointed out by these authors, most of the mass is ejected at a slow speed in the pre-eruptive wind, while most of the kinetic energy is supplied by the fast material with much lower mass loss.
In Fig. 3, we show the density map (in logarithmic scale) obtained from Run B at an evolution time t = 52 yr since the explosive event. For this model, we assumed a wide-angle explosive outflow for the great eruption with a speed v1 = 10 000 km s−1 and a speed v2 = 100 km s−1 with most of the mass expelled toward the symmetry axis, such as it was proposed by Smith et al. (2018a). We note from the figure that this model has an important impact on the morphology and kinematics of η Car’s nebulae. The assumed latitude-dependent flow parameters at injection are not able to account for the shape of the large Homunculus, that is, the outer expanding shell does not resemble its bipolar structure. Furthermore, the shocked layer expands too quickly and therefore reaches the current physical size of ∼3.5 × 1017 cm (in the polar direction) at an evolution time t = 52 yr since the explosion, which is long before the estimated kinematical age of ∼175 yr of the large Homunculus. On the other hand, the resulting expansion speed of ≃1800 km s−1 at the poles is much greater than the observed value of ≃650 km s−1 (Smith 2006). At the equator, the numerical simulation shows a physical size of the nebula of ±2.3 × 1017 cm expanding at ≃1200 km s−1, which are not consistent with the corresponding observed values (±3.1 × 1016 cm and ≃62 km s−1; Smith 2006). In addition, it is worth mentioning that important differences from our previous models (González et al. 2010; González 2018) were identified on the embedded structures. In particular, the simulation shows the formation of tenuous polar caps that may be related to the inner Homunculus, which results from the interaction of the minor eruption with its post-outburst wind. Nonetheless, these caps are located at a distance of ±2.7 × 1016 cm from the central source, which does not correspond to the current physical size of the little Homunculus of ±8 × 1016 cm either (Ishibashi et al. 2003; Smith 2006).
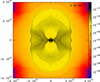 |
Fig. 3. Same as Fig. 1 of η Car’s nebulae, but for Run B after t = 52 yr since the explosion. The bar on the right side of the plot is in units of g cm−3, and the computational domain axes are in units of cm. A physical description of the figure is given in the text. |
Figure 4 shows the density of ionized hydrogen (top left), pressure (top right), temperature (bottom left), and velocity (bottom right) maps computed for the interaction of the different outflows for Run B. The stratifications correspond to an evolution time of t = 52 yr after of the explosion phase. As described above, the simulation shows that the outer shocked layer expands too fast reaching the observed physical size long before the estimated age of 175 yr of the large Homunculus. The simulation shows a temperature of T ≃ 1.6 × 10⁴ K behind the outer shock (in the polar direction), while the mean temperature inside the nebula is T ≃ 200 K. At the equator, outside the nebula, we see the presence of material with a density of ionized hydrogen nHII ≃ 106 cm−3 and a temperature of T ≃ 3 × 10³ K, and at higher latitudes the density decreases to nHII ≃ 1 cm−3 and the temperature increases to T ≃ 2 × 10⁷ K. In addition, the model predicts high speeds in the equatorial plane, with values increasing from v ≃ 1000 km s−1 to v ≃ 3000 km s−1. At higher latitudes, the low-density material expands at a higher speed of v ≃ 5000 km s−1. Notwithstanding, no equatorial low-density features that may be related to the equatorial skirt of η Car nebula are observed.
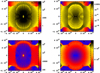 |
Fig. 4. Stratifications for Run B of density of ionized hydrogen (top left), pressure (top right), temperature (bottom left), and velocity (bottom right) computed 52 yr after the great eruption of η Car. The bars on the right side of the panels are in units of cm−3, dyn cm−2, K, and cm s−1, respectively, and the computational domain axes are in units of cm. A further description of the figure is given in the text. |
4. Conclusions
In this article, new 2D numerical models of the great eruption of η Car from the 1840s are presented. In contrast with our previous models which assume this eruption as a single explosion (González 2018), in the new high-resolution hydrodynamical simulations, we have incorporated the intermediate (500 km s−1) and high-speed (10 000 km s−1) components proposed recently by Smith et al. (2018a,b). During this event, the energy injection was ∼1049 − 1050 erg in which the parameters of η Car wind (ejection velocity and mass-loss rate) may have drastically changed in a very short period of time (∼1 yr). Consequently, we have assumed here that the large Homunculus nebula may form from the interaction of this explosion with a previous stage wind of η Car (the CSM scenario proposed by Smith 2013). It is worth mentioning that we have not addressed the inner mechanism that triggered the explosive event. Potential processes are discussed in Smith et al. (2018a).
Adopting this scenario, our numerical simulation with an intermediate-speed explosion (1000 km s−1, Run A) was able to explain both the shape and kinematics of the large Homunculus. In addition, the simulation predicts a kinematical age of the nebula of ∼174 yr that is consistent with the value estimated from observations (∼176 yr). At this time of evolution, the predicted expansion velocity – along the symmetry axis – of the external shocked layer is of ≃600 km s−1, which is very similar to the value of ≃650 km s−1 of the eta Car’s Homunculus observed by Smith (2006). Furthermore, this model also shows the formation of the internal nebula (the little Homunculus) from the interaction of the minor eruption of the 1890s with the post-outburst wind, which, as in our previous models (González et al. 2004a, 2010), developed Rayleigh-Taylor instabilities that resemble the observed spatial structures in the polar caps (Smith 2005). Nonetheless, the high-speed equatorial features that may be related to the equatorial skirt of η Carinae are not produced.
On the other hand, the high-speed explosion numerical model (10 000 km s−1, Run B) shows important differences both with regard to the morphology and dynamical evolution of the large Homunculus. First, the simulation predicts an outer shocked layer that does not resemble the bipolar structure of the nebula, and second, this layer expands too quickly (at a speed of ≃1800 km s−1) and, consequently, it reaches the observed physical size of the nebula (∼3.2 × 1017 cm) – along the symmetry axis – at a time of 52 yr after the explosion, that is long before the estimated age of ∼176 yr of the large Homunculus. In addition, the numerical simulation shows important differences in the embedded structures. As expected, the model shows the formation of tenuous polar caps from the interaction of the minor eruptive event with the post-out burst wind, however, at this time of evolution, these structures are located at a distance of ±2.7 × 1017 cm from the source and, therefore, do not reproduce the estimated extension of ±8 × 1017 cm of the polar caps of the little Homunculus. We should note that despite the differences in the parameters of Runs A and B, if we had employed the same values for the density profile, the general features obtained for the explosive model Run B would be essentially the same.
A final remark is that, in this work, we have focused on the shape and dynamical evolution of the large Homunculus assuming a high-speed, 10 000 km s−1 explosion for the great eruption of η Car from the 1840s. One can ask whether an explosive event with speeds as high as 10 000 km s−1 or higher is able to account for the observed physical properties of η Car’s nebula. We conclude from our numerical simulation that included this high-speed component (Run B) that this model cannot reproduce the morphology or the age estimated from observations of the large Homunculus. On the other hand, a slower but also brief event with a velocity of 1000 km s−1 could nearly reproduce the observations.
Acknowledgments
RFG acknowledges financial support for UNAM-PAPIIT grant IN 107120. L.A.Z. acknowledges financial support from CONACyT-280775 and UNAM-PAPIIT IN110618 grants. A.C.R., J.C., and P.F.V. acknowledge the financial support for UNAM-PAPIIT grants IG 1000218 and IA10321. EMdGDP is grateful for the support from the Brazilian agencies FAPESP (grant 2013/10559-5) and CNPq (grant 308643/2017-8). The authors thank the anonymous referee for her/his useful comments and suggestions that improved the content of this work.
References
- Abraham, Z., Falceta-Gonçalves, D., & Beaklini, P. P. B. 2014, ApJ, 791, 95 [NASA ADS] [CrossRef] [Google Scholar]
- Davidson, K., & Humphreys, R. M. 1997, ARA&A, 35, 1 [NASA ADS] [CrossRef] [Google Scholar]
- Davidson, K., Smith, N., Gull, T. R., et al. 2001, AJ, 121, 1569 [NASA ADS] [CrossRef] [Google Scholar]
- Humphreys, R. M., Davidson, K., & Smith, N. 1999, PASP, 111, 1124 [NASA ADS] [CrossRef] [Google Scholar]
- Icke, V. 1988, A&A, 202, 177 [NASA ADS] [Google Scholar]
- Ishibashi, K., Gull, T. R., Davidson, K., et al. 2003, AJ, 125, 3222 [NASA ADS] [CrossRef] [Google Scholar]
- González, R. F. 2018, A&A, 609, A69 [NASA ADS] [CrossRef] [EDP Sciences] [Google Scholar]
- González, R. F., Villa, A. M., Gómez, G. C., et al. 2010, MNRAS, 402, 1141 [Google Scholar]
- González, R. F., de Gouveia Dal Pino, E. M., Raga, A. C., et al. 2004a, ApJ, 616, 976 [CrossRef] [Google Scholar]
- González, R. F., de Gouveia Dal Pino, E. M., Raga, A. C., et al. 2004b, ApJ, 600, L59 [CrossRef] [Google Scholar]
- Kashi, A., & Soker, N. 2009, New Astron., 14, 11 [NASA ADS] [CrossRef] [Google Scholar]
- Smith, N. 2005, The Fate of the Most Massive Stars, 332, 307 [Google Scholar]
- Smith, N. 2006, ApJ, 644, 1151 [Google Scholar]
- Smith, N. 2013, MNRAS, 429, 2366 [Google Scholar]
- Smith, N., Gehrz, R. D., Hinz, P. M., et al. 2003, AJ, 125, 1458 [NASA ADS] [CrossRef] [Google Scholar]
- Smith, N., Andrews, J. E., Rest, A., et al. 2018a, MNRAS, 480, 1466 [Google Scholar]
- Smith, N., Rest, A., Andrews, J. E., et al. 2018b, MNRAS, 480, 1457 [NASA ADS] [CrossRef] [Google Scholar]
- Owocki, S. P., & Shaviv, N. J. 2016, MNRAS, 462, 345 [NASA ADS] [CrossRef] [Google Scholar]
- Portegies Zwart, S. F., & van den Heuvel, E. P. J. 2016, MNRAS, 456, 3401 [NASA ADS] [CrossRef] [Google Scholar]
- Raga, A. C., Navarro-González, R., & Villagrán-Muniz, M. 2000, Rev. Mex. Astron. Astrofis., 36, 67 [NASA ADS] [Google Scholar]
- Raga, A. C., Villagran-Muniz, M., Navarro-González, R., & Masciadri, E. 2001, Rev. Mex. Astron. Astrofis., 37, 87 [NASA ADS] [Google Scholar]
- Raga, A. C., de Gouveia Dal Pino, E. M., Noriega-Crespo, A., Mininni, P. D., & Velázquez, P. F. 2002, A&A, 392, 267 [NASA ADS] [CrossRef] [EDP Sciences] [Google Scholar]
- van Leer, B. 1982, Numerical Methods in Fluid Dynamics, 507 [Google Scholar]
- Velázquez, P. F., Sobral, H., Raga, A. C., Villagrán-Muniz, M., & Navarro-González, R. 2001, Rev. Mex. Astron. Astrofis., 37, 87 [NASA ADS] [Google Scholar]
- Woosley, S. E. 2017, ApJ, 836, 244 [Google Scholar]
All Tables
All Figures
|
Fig. 1. Log-scale density stratification of η Car’s nebulae. The numerical simulation (Run A) corresponds to an evolution time of t = 172 yr since the great eruption in the 1840s. The bar on the right side of the plot is in units of g cm−3, and the computational domain axes are in units of cm. See the text for a physical description of the figure. |
| In the text | |
|
Fig. 2. Stratifications for Run A of density of ionized hydrogen (top left), pressure (top right), temperature (bottom left), and velocity (bottom right) computed 172 yr after the great eruption of η Car. The bars on the right side of the panels are in units of cm−3, dyn cm−2, K, and cm s−1, respectively, and the computational domain axes are in units of cm. A further description of the figure is given in the text. |
| In the text | |
|
Fig. 3. Same as Fig. 1 of η Car’s nebulae, but for Run B after t = 52 yr since the explosion. The bar on the right side of the plot is in units of g cm−3, and the computational domain axes are in units of cm. A physical description of the figure is given in the text. |
| In the text | |
|
Fig. 4. Stratifications for Run B of density of ionized hydrogen (top left), pressure (top right), temperature (bottom left), and velocity (bottom right) computed 52 yr after the great eruption of η Car. The bars on the right side of the panels are in units of cm−3, dyn cm−2, K, and cm s−1, respectively, and the computational domain axes are in units of cm. A further description of the figure is given in the text. |
| In the text | |
Current usage metrics show cumulative count of Article Views (full-text article views including HTML views, PDF and ePub downloads, according to the available data) and Abstracts Views on Vision4Press platform.
Data correspond to usage on the plateform after 2015. The current usage metrics is available 48-96 hours after online publication and is updated daily on week days.
Initial download of the metrics may take a while.