| Issue |
A&A
Volume 661, May 2022
The Early Data Release of eROSITA and Mikhail Pavlinsky ART-XC on the SRG mission
|
|
|---|---|---|
| Article Number | A25 | |
| Number of page(s) | 21 | |
| Section | Stellar structure and evolution | |
| DOI | https://doi.org/10.1051/0004-6361/202141878 | |
| Published online | 18 May 2022 | |
eROSITA calibration and performance verification phase: High-mass X-ray binaries in the Magellanic Clouds
1
Max-Planck-Institut für extraterrestrische Physik,
Gießenbachstraße 1,
85748
Garching,
Germany
e-mail: fwh@mpe.mpg.de
2
Institut für Astronomie und Astrophysik,
Sand 1,
72076
Tübingen,
Germany
3
Dr. Karl-Remeis-Sternwarte und ECAP, Universität Erlangen-Nürnberg,
Sternwartstraße 7,
96049
Bamberg,
Germany
4
Astronomical Observatory, University of Warsaw,
Al. Ujazdowskie 4,
00–478
Warszawa,
Poland
5
Moscow State University, Sternberg Astronomical Institute,
119234
Moscow,
Russia
6
Kazan Federal University, Department of Astronomy and Space Geodesy,
420008
Kazan,
Russia
Received:
26
July
2021
Accepted:
25
August
2021
Context. During its performance verification phase, the soft X-ray instrument eROSITA on board the Spektrum-Roentgen-Gamma (SRG) spacecraft observed large regions in the Magellanic Clouds in which almost 40 known high-mass X-ray binaries (HMXBs, including candidates) are located.
Aims. We looked for new HMXBs in the eROSITA data, searched for pulsations in HMXB candidates, and investigated the long-term behaviour of the full sample using archival X-ray and optical data.
Methods. For sufficiently bright sources, we performed a detailed spectral and temporal analysis of their eROSITA data. A source detection analysis of the eROSITA images in different energy bands provided count rates and upper limits for the remaining sources.
Results. We report the discovery of a new Be/X-ray binary in the Large Magellanic Cloud. The transient SRGEt J052829.5–690345 was detected with a 0.2–8.0 keV luminosity of~1035 erg s−1. It exhibits a hard X-ray spectrum, typical for this class of HMXBs. The OGLE I-band light curve of the V~15.7mag counterpart shows large variations up to 0.75 mag, which occur with a quasi-period of~511 days. The eROSITA observations of the Small Magellanic Cloud covered 16 Be/X-ray binary pulsars, 5 of which were bright enough for an accurate determination of their current pulse period. The pulse periods for SXP 726 and SXP 1323 measured from eROSITA data are~800 s and~1006 s, respectively, which is very different from their discovery periods. Including archival XMM-Newton observations, we update the spin-period history of the two long-period pulsars, which have shown nearly linear trends in their period evolution for more than 15 yr. The corresponding average spin-down rate for SXP 726 is 4.3 s yr−1, while SXP 1323 has a spin-up rate of –23.2 s yr−1. We discuss the spin evolution of the two pulsars in the framework of quasi-spherical accretion.
Key words: stars: emission-line, Be / stars: neutron / X-rays: binaries / galaxies: clusters: individual: LMC / galaxies: clusters: individual: SMC
© F. Haberl et al. 2022
 Open Access article, published by EDP Sciences, under the terms of the Creative Commons Attribution License (https://creativecommons.org/licenses/by/4.0), which permits unrestricted use, distribution, and reproduction in any medium, provided the original work is properly cited.
Open Access funding provided by Max Planck Society.
1 Introduction
The Magellanic Clouds (MCs) are ideal laboratories for studying X-ray source populations in star-forming galaxies. They are relatively nearby with accurately known distances (50kpc for the Large Magellanic Cloud, LMC, and 62 kpc for the Small Magellanic Cloud, SMC; Pietrzy ń ki et al. 2019; Graczyk et al. 2014), and X-ray observations are little affected by Galactic foreground absorption. However, it should be noted that in particular the SMC is significantly extended along the line of sight (Tatton et al. 2021; Subramanian & Subramaniam 2009). While the SMC was largely covered by a mosaic of pointed observations with XMM-Newton (Sturm et al. 2013b; Haberl et al. 2012), the large extent of the LMC on the sky allowed only partial mapping (Maggi et al. 2016).
The XMM-Newton surveys of the MCs enlarged the number of known high-mass X-ray binaries, which are binary systems with a massive early-type star and a compact object that in most cases is a neutron star. The majority of the HMXBs in the MCs forms the subgroup of Be/X-ray binaries, in which a neutron star accretes matter from the circum-stellar disc of a Be star (BeXRBs; see Reig 2011, for a review). On the other hand, supergiant systems (SgXRBs), powered by accretion from the strong stellar wind, are less abundant. This is particularly true for the SMC, in which only one SgXRB (SMCX-1) but about 120 BeXRBs are known, half of which are confirmed X-ray pulsars (Haberl & Sturm 2016). On the other hand,~60 HMXB candidates were identified in the LMC, with detected pulsations in about 20 of them. The fraction of SgXRBs is somewhat higher in the LMC than in the SMC (Maitra et al. 2021, 2019a; van Jaarsveld et al. 2018; Vasilopoulos et al. 2018), which is probably related to the different star formation histories of the two clouds (Antoniou & Zezas 2016; Antoniou et al. 2010).
2 eROSITA observations
eROSITA, the soft X-ray instrument on board the Spektrum-Roentgen-Gamma (SRG) mission (Predehl et al. 2021), was successfully launched from Baikonur on July 13, 2019. After the instruments were commissioned, first-light observations, including an observation pointed at SN 1987A in the LMC (Maitra et al. 2022) were performed, followed by a calibration and performance verification phase when pointed observations of selected targets were conducted. Henceforth, we call this phase of pointed observations before the start of the all-sky survey on December 13, 2019, the CalPV phase. A summary of the CalPV observations performed in the direction of LMC and SMC can be found in Table 1. The current publication focuses on the analysis of these observations and reports first results obtained by eROSITA for the LMC and the SMC.
To analyse the CalPV data, we used the eROSITA Standard Analysis Software System (eSASS version eSASSusers_20l009, Brunner et al. 2022). The eSASS pipeline processing provides energy-calibrated event files that were used to create images, detect point sources, and extract spectra and light curves of the detected objects. While for images and light curves we used data from all seven telescope modules (Predehl et al. 2021), only telescope modules with on-chip optical blocking filter (TM1–TM4 and TM6) were used for spectroscopy because no reliable energy calibration is available for TM5 and TM7 so far because an optical light leak was discovered soon after the start of the CalPV phase (Predehl et al. 2021).
We extracted eROSITA light curves and spectra using the eSASS task srctool from circular or (at larger off-axis angles) elliptical regions around the source position and a nearby source-free background region. Events from all valid pixel patterns (PATTERN=15) were selected. For the spectral analysis, we combined the data from the five on-chip filter cameras into a single spectrum. The spectra were binned to achieve a minimum of 20 counts per spectral bin to allow the use of X2-statistic. Corresponding response files were created by srctool.
Spectral analysis was performed using XSPEC v12.11.0k (Arnaud 1996). To account for the photo-electric absorption by the Galactic interstellar gas, we used tbabs in XSPEC with solar abundances following Wilms et al. (2000) with atomic cross sections from Verner et al. (1996). The Galactic column density was taken from Dickey & Lockman (1990) and was fixed in the fits. For the absorption along the line of sight through the LMC/SMC and local to the source, we included a second absorption component when required, with elemental abundances fixed at 0.49/0.20 solar (Rolleston et al. 2002; Luck et al. 1998), respectively, and left the column density free in the fit. Errors were estimated at 90% confidence intervals. To compute the X-ray luminosity, distances of 50 and 60 kpc were assumed for the LMC and SMC, respectively. Throughout the paper, we provide observed fluxes and absorption-corrected luminosities.
Observation details.
3 HMXBs covered by the eROSITA CalPV observations
The large (~1º diameter) field of view (FoV) of the eROSITA telescopes implies that CalPV observations pointed towards the LMC around SN 1987A and N 132D overlap and cover a contiguous area of 4.4 square degrees. Therefore we produced mosaic images from the merged calibrated event file (combining data from all available cameras and observations) in three energy bands (red: 0.2–1.0 keV, green: 1.0–2.0 keV, and blue: 2.0– 4.5 keV). The images were adaptively smoothed and divided by vignetting-corrected exposure maps to obtain count-rate images. The corresponding RGB mosaic image is shown in Fig. 1. The detector background was not yet subtracted from the images because more data with the filter wheel closed are still to be collected to construct a reliable background model. This leads to a slight over-correction of the detector-background component in the images towards the edges of the FoV, but does not affect our analysis of point sources where a local full background subtraction is applied. Similarly, the observations of the SMC supernova remnant 1E 0102.2–7219 (placed at different off-axis angles) cover an area of 2.5 square degrees, and the RGB image is presented in Fig. 2.
For each observation, the eROSITA pipeline system perf orms source detection, based on a maximum likelihood point spread function (PSF) fitting algorithm, simultaneously on the images from the available TMs in the three energy bands 0.2– 0.6keV, 0.6–2.3 keV, and 2.3–5.0keV (Brunner et al. 2022). We correlated the source detection lists with the catalogues of HMXBs (see below) with a matching radius of 10″ to determine which of the known HMXBs were detected at which brightness. Upper limits were derived for the non-detections from the sensitivity maps using the eSASS task apetool. Tables 3 and 5 summarise the detections and upper limits for all HMXBs observed in the LMC and SMC, respectively. Count rates are reported for the 0.2–5 keV energy band and all rates given in subsections describing the sources refer to this band, unless otherwise noted.
The available data cover several epochs, which also allows investigating the variability of the detected sources on several timescales. The observations of the LMC were irregularly distributed in time over nearly three months, whereas five of the SMC observations were performed consecutively, followed by an observation centred on 1E 0102.2–7219 about seven months later, providing two epochs for the HMXBs located within 0.5º of the supernova remnant.
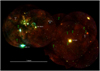 |
Fig. 1 LMC mosaic from eROSITA observations around SN 1987A and N 132D. Red, green, and blue represent X-ray energies in the bands 0.2–1.0keV, 1.0–2.0keV, and 2.0–4.5keV, respectively. The HMXB pulsars are marked with white circles and labelled with their pulse period measured near the time of their discovery. HMXBs and candidates without known pulse period are indicated by green circles and the entry number from Table 2. |
4 LMC field
The CalPV observations of the LMC cover 14 (candidate) HMXBs that include 9 well-confirmed cases (4 X-ray pulsars). These objects are listed in Table 2 and marked in the image presented in Fig. 1. We used the numbering scheme from an HMXB catalogue of the LMC in preparation, similar to that of the SMC (Haberl & Sturm 2016). For 2 cases, the identification of the optical counterpart is still uncertain (cases 37 and 60), while the 3 remaining candidates for BeXRBs (candidates 33, 35, and 36) did not show significant Hα emission during optical spectroscopy, as reported by van Jaarsveld et al. (2018). The image shows that except for the persistently bright black hole system LMCX-1, only one source was sufficiently bright for a detailed spectroscopic and temporal analysis. This is the super-giant fast X-ray transient (SFXT) XMMUJ053108.3–690923 (marked with its pulse period of 2013 s in the image), for which the eROSITA results have been presented in Maitra et al. (2021). One new BeXRB was discovered in this work (SRGEtJ052829.5–690345, source 73 in Table 2 and Fig. 1). It is described in detail in the following section.
4.1 SRGEtJ052829.5–690345, a new BeXRB in the LMC
Source position and optical counterpart. The faint transient SRGEtJ052829.5–690345 was discovered in the eROSITA data of the calibration observation 700183 of the supernova remnant N132D performed in November 2019 (Table 1). SRGEtJ052829.5–690345 appears as a blue source in the eROSITA colour image (Fig. 3), indicating a hard X-ray spectrum. Source detection resulted in an X-ray source position of RA (2000) = 05h28m29.1, Dec= –69º03′51″ with a statistical 1σ uncertainty of 1.2″. The eROSITA position is thereby 7″ from a star with V = 15.70mag, B =15.90 mag, U = 15.08 mag, and R = 16.66 mag (Massey 2002) with coordinates RA = 05h28m29s.34, Dec= –69º03′44″.7, as listed in the Gaia DR2 catalogue (Gaia Collaboration 2018). The brightness and colours of this star are typical for an early-B star in the LMC, suggesting a new BeXRB.
The observation also covers the supergiant fast X-ray transient (SFXT) XMMUJ053108.3–690923 (Maitra et al. 2021) at a similar off-axis angle. The SFXT is securely identified with a supergiant in the LMC. The eROSITA position for this source is also shifted by a similar value (6.6″)1 and in the same direction with respect to the optical counterpart. Therefore we used the SFXT for astrometric correction and obtained RA = 05h28m29s.57, Dec= –69º03′45″.5 for the refined coordinates of the new BeXRB candidate. The corrected X-ray position is 1.5″ from that of the proposed optical counterpart, which is compatible within the errors. We use these coordinates for the source name following the SRG/eROSITA convention for a new transient: SRGEt J052829.5–690345.
The position of the transient SRGEt J052829.5–690345 was covered by two XMM-Newton pointed observations (observation IDs 0690743501/3601) at large off-axis angles and during many slews with the European Photon Imaging Camera (EPIC; Strüder et al. 2001; Turner et al. 2001). The observations were performed consecutively between September 4, 2012, 16:55 and September 5, 2012, 11:25 as part of the XMM-Newton LMC survey (PI Haberl). The source was not detected, and we derived 3σ upper limits in the 0.2–4.5 keV energy band of 1.6 × 10⁻³ cts s−1, 1.6 × 10⁻³ cts s−1 and 3.4 × 10⁻³ cts s−1 from the EPIC-MOS1, MOS2, and pn sensitivity maps, respectively. The upper limits during slew are typically more than a factor 100 higher and not constraining.
Spectral analysis. As described above, we extracted eROSITA spectra (with a total net exposure of 28.4 ks) from circular regions around the source position (radius 25″)2 and a nearby source-free background region (radius 50″). An absorbed power-law model yields an acceptable fit (reduced x2 = 0.8 for 13 degrees of freedom, dof) to the eROSITA spectrum (Fig. 4). The power-law index of  , although with a large error, is within the range observed for BeXRBs in the Magellanic Clouds (e.g. Haberl & Sturm 2016), and the LMC absorption, required in addition to the Galactic foreground (fixed at 6.2 × 1020 cm−2), is 1.0−10 × 1022 cm−2. The observed 0.2–8.0keV flux is 3.4 × 10⁻¹³ erg cm−2 s−1, which results in a soft X-ray source luminosity of 1.2 × 1035 erg s−1.
Using WebPIMMS3 and the eROSITA best-fit parameters for a power law with a single column density, the expected 0.2– 4.5 keV count rates for EPIC-MOS and pn are 1.3 × 10⁻² cts s−1 and 3.3 × 10⁻² cts s−1, about a factor of 10 higher than the upper limits derived from the XMM-Newton observations. Considering the non-detection by XMM-Newton, we therefore conclude that the source is a transient, as expected for a BeXRB.
Considering that most known BeXRBs host accreting neutron stars, we also carried out a search for possible X-ray pulsations. Unfortunately, the search did not reveal any significant signal because of the low statistics. From the extraction region, a total of 330 counts is available, with~100 counts background contribution, which does not allow placing meaningful limits on the amplitude of possible pulsations either.
OGLE long-term monitoring. The region around the new BeXRB candidate SRGEt J052829.5–690345 was monitored regularly in the I and V bands with the Optical Gravitational Lensing Experiment (OGLE; Udalski et al. 2008,Udalski et al. 2015). Images were taken in V- and I-filter bands, and photometric magnitudes are calibrated to the standard VI system.
The optical counterpart of SRGEt J052829.5–690345 was covered for about 18.5 yr during OGLE phases III (star 1mc161.4.31169) and IV (1mc517.06.71858), as shown in Figs. 5 and 6. Both light curves exhibit remarkable variations by up to 0.75 mag in the I band. A Lomb-Scargle (LS) analysis of the I-band light curve reveals that these variations occur quasi-periodically and repeat every~511 days. The outbursts show different durations, which lead to phase shifts. This behaviour is very similar to that of the optical counterpart of another BeXRB: RXJ0529.8–6556 (Treiber et al. 2021). The authors suggest this to be resulting from a misalignment of the Be star disc with respect to the orbital plane, which causes precession of the disc.
The OGLE V-band observations provided a less frequent coverage of the BeXRB system than the I-band observations. To compute the I-V colour index, we chose the I-band magnitude nearest in time to the V-band measurement, disregarding those more than two days apart. The colour index I-V is shown as a function of the I-band magnitude in Fig. 7. Large colour variations with brightness (redder when brighter) become apparent especially during the deep dips seen in the light curves.
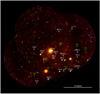 |
Fig. 2 SMC mosaic from eROSITA observations around the supernova remnant 1E0102.2–7219, the brightest source near the image centre. Image colours and labels for the HMXB pulsars are as in Fig. 1. HMXBs without known pulse period are indicated by green circles and their entry number from HS16 (see Table 4). |
HMXBs in the LMC.
HMXBs in the LMC: Variability between observations.
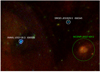 |
Fig. 3 eROSITA colour image (red: 0.2–1.0 keV, green: 1.0–2.0keV, and blue: 2.0–4.5 keV) of the region around SRGEt J052829.5–690345. The transient source appears similar in colours to the SFXT XMMUJ053108.3–690923 (Maitra et al. 2021), which is located at an angular distance of~15′. The soft extended X-ray emission from the supernova remnant MCSNR J0527–6912 (e.g. Maggi et al. 2016) is also marked. |
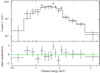 |
Fig. 4 Combined eROSITA spectrum of SRGEtJ052829.5–690345 from the cameras with on-chip filter (TM1–4 and TM6). The best-fit absorbed power-law model is shown as a histogram, and the residuals are plotted in the bottom panel. |
4.2 XMMUJ052417.1–692533, a BeXRB without significant Hα emission?
van Jaarsveld et al. (2018) selected 19 candidate BeXRBs from XMM-Newton observations of the LMC based on X-ray hardness ratio criteria. They present the results from optical spectroscopy and the analysis of the OGLE data of the proposed counterparts. Six of their candidates were covered by the eROSITA observations (reference [VBM18] in Table 2), and the proposed counterparts of three of these did not exhibit significant Hα emission (sources 33, 35, and 36), which makes their BeXRB identification doubtful. XMMUJ052049.1–691930 (source 33) and XMMUJ052546.4–694450 (source 36) were not detected in the eROSITA data, therefore we lack further information on their nature.
The position of XMMUJ052417.1–692533 (source 35) was covered by three observations (700156, 700179, and 700184), from which similar count rates were obtained. Two observations yielded no detection (see Table 3). The upper limits indicate variability of at least a factor of four on a timescale of six weeks.
The eROSITA positions obtained from the three detections have angular separations of 4.4″, 3.0″, and 6.5″ from the optical position of the V = 16 mag early-type star, which is proposed as optical counterpart (for more information on the star, see van Jaarsveld et al. 2018). Because of the current uncertainties in the astrometry of the CalPV observations (see Sect. 4.1), the X-ray position obtained from XMM-Newton is more reliable (see van Jaarsveld et al. 2018).
We extracted and analysed the eROSITA spectra of XMMUJ052417.1–692533 in a similar way as for SRGEt J052829.5–690345 (Sect. 4.1). Because of a nearby source, the extraction regions were chosen smaller (15″ and 25″ for source and background regions, respectively). The spectra from the three observations (with a total net exposure of 135 ks) were fitted simultaneously with a power-law model. Absorption (foreground NH fixed at 6.2 × 1020 cm−2) and photon index were assumed to be constant between the observations, only the power-law normalisation was free in the fit to follow the flux variations. The spectra with the best-fit model are shown in Fig. 8. The model formally yields an acceptable fit (reduced x2 = 0.73 for 29 dof) to the eROSITA spectra. The power-law index of 0.92 ± 0.22 is typical for BeXRBs in the MCs (e.g. Haberl & Sturm 2016), excluding a background active galactic nucleus and supporting the identification of the X-ray source with the early-type star. For the LMC absorption, no significant NH was required in the fit, but the systematic residuals might indicate a more complex spectrum at energies below~1 keV. The 0.2–8.0 keV flux might vary slightly between observations, but is consistent within the 90% errors:  ,
,  , and
, and  (ordered in time), which corresponds to an average X-ray luminosity of 2.2 × 1034 erg s−1.
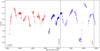 |
Fig. 5 OGLE I-band light curve of SRGEt J052829.5–690345 between September 15, 2001, and March 13, 2020. The vertical dashed lines indicate the times of the eROSITA and archival XMM-Newton observations. |
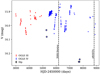 |
Fig. 6 OGLE V-band light curve of SRGEt J052829.5–690345. See also Fig. 5. The data points marked with additional black circles indicate two deep dips in the light curve that show extreme colours (see Fig. 7). |
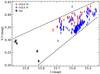 |
Fig. 7 OGLE V – I colour index vs. I (interpolated linearly to the times of the V-band measurements). The data points marked with additional black circles originate from two deep dips in the light curve (see also Fig. 6). V – I is correlated with I in a well-defined region of the parameter space, as indicated by the dashed lines. |
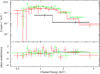 |
Fig. 8 Combined eROSITA spectra of XMMUJ052417.1–692533 from the cameras with on-chip filter (TM1–4 and TM6). The best-fit absorbed power-law model is shown as a histogram, and the residuals are plotted in the bottom panel. The different colours indicate the observations 700156 (black), 700179 (red), and 700184 (green). The spectrum from observation 700156 includes data from TM6 only (see Table 1). |
5 SMC field
eROSITA performed five calibration observations consecutively in November 2019, one centred on 1E 0102.2–7219, and in the other four, the supernova remnant is offset in different directions (Table 1). This results in different off-axis angles for the sources covered by several observations and does not allow us to immediately handle the five observations as one long observation (duration~3.4 days). However, we concatenated light curves after they were background subtracted and corrected for vignetting and PSF losses. Similarly, spectra were extracted for each observation and were analysed simultaneously. A sixth observation in June 2020 was again centred on 1E 0102.2–7219, allowing further long-term studies of sources located within ~30′ of the supernova remnant.
In total, the observations of the SMC cover 23 HMXBs, which include 20 well-confirmed cases of Be X-ray binaries (BeXRBs) and 16 X-ray pulsars (including XMMUJ010429.4–723136, see below). The (candidate) HMXBs are summarised in Table 4 and are marked in the RGB image that is presented in Fig. 2. The image shows that one of the candidate HMXBs (XMMUJ010147.5–715550, number 124; Sturm et al. 2012a) is characterised by a red colour, which indicates a super-soft X-ray source (SSS). SSSs with a Be star as optical counterpart are promising candidates for Be systems with a white dwarf (WD) as compact object (see also Kahabka et al. 2006; Coe et al. 2020). Moreover, in addition to the persistently bright supergiant system SMC X-1, several other classical BeXRBs are detected (with hard X-ray spectrum) that were sufficiently bright for a detailed spec-troscopic and temporal analysis. All these are known to be BeXRB pulsars: RXJ0101.0–7206, also known as SXP 304; RXJ0101.3–721, also known as SXP 455; AXJ0103–722, also known as SXP 522; RXJ0105.9–720, also known as SXP 726,; and RXJ0103.6–7201, also known as SXP 1323. The results from the HMXB XMMUJ010429.4–723136, from which 164s pulsations were discovered in the eROSITA CalPV data (Haberl et al. 2019), are presented in Carpano et al. (2022). The results from the other sources are described below.
5.1 RXJ0101.0–7206, or SXP 304, or [HSI6] 46
SXP 304 was discovered in ROSAT pointed observations as a highly variable source and was proposed to be a BeXRB (Kahabka & Pietsch 1996). Pulsations at 304s were discovered using Chandra, confirming its nature as a BeXRB pulsar (Macomb et al. 2003).
In November 2019, SXP 304 was detected in the eROSITA observations 700001, 700002, and 700004 and had decreased in flux by more than a factor of two in June 2020 (ObsID 710000). The source was not covered during observation 700003 and was not detected during observation 700005, when it was located very close to the edge of the FoV (see Table 5). For the timing analysis, we used only the two observations with the best statistics, and for the spectral analysis, we analysed the spectra from all observations in which the source was detected. In order to look for periodic signals in the X-ray light curves of this source and other sources, an LS periodogram analysis (Lomb 1976; Scargle 1982) was performed. To determine the spin periods more precisely, an epoch-folding technique was applied (Leahy 1987).
The lower panel of Fig. 9 shows the light curve of SXP 304 obtained from the three observations with a detection. For the LS periodogram (upper panel of Fig. 9), we used only data from the first two observations with better statistical quality. A strong periodic signal at~302 s is visible. From the epoch-folding technique, the spin period and corresponding 1α errors for ObsIDs 700001 and 700002 and combining the two were determined to be 302.21 ± 0.55 s, 302.33 ± 0.60 s, and 302.29 ± 0.27 s, respectively, and they are consistent with each other. This period is consistent with the shortest value of 302.6 ± 0.4 s measured from XMM-Newton data in November and December 2005 (Eger & Haberl 2008a), demonstrating that the pulsar shows little long-term period change on a timescale of 15 yr. The pulse profiles are single peaked and exhibit no change in shape between the eROSITA observations. The pulse profile in the energy range of 0.2–10 keV combining both observations is shown in Fig. 10, with a pulsed fraction of 51 ± 11%.
The spectra can be modelled with a simple absorbed power law. The absorption component was consistent with the Galactic foreground column density. No additional SMC component was required, and the NH was fixed at 6× 1020 cm−2. From the simultaneous fit to the spectra of observations 700001, 700002, 700004 and 710000 a power-law index of r = 0.31 ± 0.11 was derived. The observed flux (0.2–10 keV) varied from~3.6 × 10⁻¹³ erg cm−2 s−1 in the first two observations to 3.2 × 10⁻¹³ erg cm−2 s−1 (700004) and 1.5×10⁻¹³ergcm−2s−1 (710000), corresponding to a luminosity between 6.5 × 1034 erg s−1 and 1.6 × 1035 erg s−1. The spectra with best-fit model are shown in Fig. 11.
HMXBs in the SMC.
HMXBs in the SMC: Variability between observations.
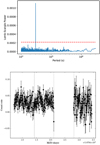 |
Fig. 9 Top: LS periodogram from the light curve of SXP 304, combining observations 700001 and 700002. The dashed red line indicates the 99% confidence level. Bottom: background-subtracted and vignetting-corrected light curve of SXP 304 (binned at twice the pulse period and including ObsID 700004) in the energy band of 0.2–8 keV. The dashed vertical lines separate the intervals corresponding to observations 700001–4. During observation 700003, the source was not in the FoV, and during observation 700005 it was not detected. |
5.2 RXJ0101.3–7211, or SXP 455, or [HS16] 51
SXP 455 was discovered as a BeXRB pulsar using XMM-Newton EPIC-pn observations (Sasaki et al. 2001). The source was detected in the FoV of observations 700001–4 and 710000 (see Table 5). In the case of 700003, we did not use the flag to select the circular FoV (as is applied to the released data) because the source was located just outside the selection mask and provides useful data for our temporal analysis. In November 2019, pulsations were significantly detected only from observations 700001 and 700002. The spin periods and corresponding 1σ errors measured for the two observations using an epoch-folding technique are 447.9 ± 1.0 s and 449.0 ± 1.9 s, respectively. These values are well within the range measured from the ROSAT and XMM-Newton observations reported by Eger & Haberl (2008a), and as in the case of SXP 304, they indicate little long-term spin period variations since 1993.
The combined light curve demonstrates the flaring behaviour of the source (Fig. 12). The pulse profiles also exhibit evidence for a change in pulse shape between observations 700001 and 700002, as shown in Fig. 13, which might be related to the flaring activity.
Because of the much reduced statistics due to the large off-axis angle of the source, we excluded observation 700003 from the spectral analysis. The spectra from observations 700001, 700002, 700004, and 710000 were fitted simultaneously. A simple absorbed power law did not provide an adequate fit to the data with an excess seen at low energies. Including an additional black-body component (with kT~1.7), or alternatively, a partially covering absorbing component, improved the spectral fit. As the partial absorbing component provided a better statistical fit (339.7/290 dof with respect to 387.5/295 dof), it was used as the final model for the spectral analysis. For the simultaneous fitting, only the power-law normalisation and the parameters of the partial covering absorber were left free. The obtained power-law index is 0.99 ± 0.16. The corresponding values of the partial absorber and the covering fraction (CF) for the four observations are summarised in Table 6, together with observed fluxes and luminosities. The eROSITA spectra with the best-fit model are presented in Fig. 14. The figure shows that the spectra mainly vary at energies below~1.5keV, which is also reflected in the parameters of the partially covering absorber. In particular the spectrum from June 2020 shows a lower absorption column density and a lower covering fraction, leading to the highest flux at low energies.
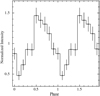 |
Fig. 10 Background-subtracted pulse profile of SXP 304 combined over observations 700001–2 in the energy range of 0.2–8 keV. |
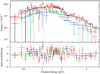 |
Fig. 11 Simultaneous spectral fit of SXP 304 spectra from observations 700001 (black), 700002 (red), 700004 (green), and 710000 (blue), showing the best-fit model as a histogram and the residuals in the bottom panel. Each spectrum was obtained by combining the data from TM1–4 and 6. |
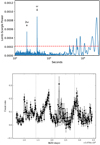 |
Fig. 12 Top: LS periodogram of SXP 455 from the combined light curve of observations 700001–2. The dashed red line indicates the 99% confidence level. Bottom: background-subtracted and vignetting-corrected light curve of SXP 455 (binned at twice the pulse period) in the energy band of 0.2–8 keV. The dashed vertical lines separate the intervals corresponding to observations 700001–4. During observation 700005, the source was not in the FoV. |
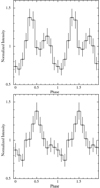 |
Fig. 13 Normalised pulse profiles of SXP 455 in the energy range of 0.2–8 keV (top: 700001 and bottom: 700002). |
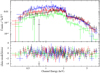 |
Fig. 14 Simultaneous analysis of the spectra of SXP 455 using a power-law model with a partially covering absorber (observation 700001: black, 700002: red, 700004: green, and 710000: blue). The best-fit model is plotted as a histogram, and residuals are shown in the lower panel. The spectrum from each observation is obtained by combining data from TM1–4 and 6. |
5.3 Suzaku J0102–7204, or SXP 522, or [HS16] 53
SXP 522 was detected in the November 2019 observations 700001–5 with increasing flux during the last two observations, while it was again weaker in June 2020 (see Table 5). The source was fainter than the other BeXRB pulsars studied in this work, and only data from observation 700001 (source was detected at smallest off-axis angle) were suitable for performing timing analysis. Pulsations are detected with a peak at~517 s in the LS periodogram, as shown in Fig. 15. The precise spin period with lσ error is 516.8±2.0 s. The profile exhibits a simple sinusoidal profile (Fig. 16). The measured spin period indicates that SXP 522 experienced an episode of slight long-term spin-up since the discovery of the pulsations in October 2012 (522.5 ± 0.5 s; Wada et al. 2012, 2013) and an XMM-Newton detection in December 2012 (521.42 ± 0.21 s; Sturm et al. 2013a). To our knowledge, the new eROSITA spin measurement is the first reported since 2012.
The six spectra from all eROSITA observations can be modelled with a simple absorbed power law. The absorption column density was consistent with the Galactic foreground absorption and was fixed at 6 × 1020 cm−2. The power-law index derived from a simultaneous fit is 0.93 ± 0.35. The low statistical quality of the spectra does not allow us to draw firm conclusions about variability between the observations. The observed average fluxes (0.2–10keV) of ( ,
,  ,
, ,
,  , and
, and  ) × 10−14 erg cm−2 s−1 for the six observations are consistent within the errors and correspond to luminosities of (1.2, 1.4, 0.63, 1.8, 2.4, and 0.63) × 1034 erg s−1. The spectra with the best-fit model are shown in Fig. 17.
SXP 455: Results for the partially covering absorber model.
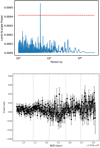 |
Fig. 15 Top: LS periodogram from ObsID 700001 for SXP 522. The dashed red line indicates the 99% confidence level. Bottom: background-subtracted and vignetting-corrected light curve of SXP 522 (binned at twice the pulse period) in the energy band of 0.2–8 keV for the five observations in November 2019. |
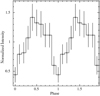 |
Fig. 16 Background-subtracted pulse profile of SXP 522 in the energy range of 0.2–8 keV. |
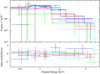 |
Fig. 17 eROSITA spectra of SXP 522 obtained from observations 700001–5 marked in black, red, green, blue, and cyan, respectively, and 710000 (magenta). Each spectrum includes data from TM1–4 and 6. The histograms show the best-fit model, and the residuals are drawn in the lower panel. |
5.4 RXJ0105.9–7203, or SXP 726, or [HS16] 57
RXJ0105.9–7203 was proposed to be a BeXRB by Haberl & Sasaki (2000) and was finally confirmed by the discovery of pulsations by Eger & Haberl (2008b) of~726 s. Seven detections of the period in XMM-Newton observations between April 2001 and November 2003 indicated a long-term spin-down rate of~3.2s yr−1, although it was of low significance due to large uncertainties in the individual period measurements.
SXP 726 was detected during the November 2019 observations 700001–5 at a similar flux level, while half a year later, it was a factor of~7 brighter (see Table 5). Pulsations are detected from all observations except 700002, where the source was located at a very large off-axis angle. The LS peri-odogram in Fig. 18 shows a strong periodic signal with the fundamental at~799 s, demonstrating that the pulsar has exhibited a significant spin-down by nearly 80 s since the time of the discovery of the period. The light curve exhibits a nearly constant count rate (Fig. 18). The precise spin periods with 1σ error from the November 2019 observations 700001, 700003, 700004, 700005, and from the merged data from these observations are 798.8 ± 4.0, 800.0 ± 3.8, 797.6 ± 6.6, 801.5 ± 4.4, and 799.9 ± 3.2 s, respectively. During observation 710000 in June 2020, the period had further increased to 803.0 ± 5.5 s.
No significant change in the spin period or the pulse shape is detected between the observations in November 2019, and the combined pulse profile is shown in Fig. 19 (top). The average profile is single peaked and the pulsed fraction (0.2–8 keV) is 30 ± 8%. The pulse profile from observation 710000 shows a narrower peak with a pulsed fraction of 35 ± 5% (Fig. 19, bottom).
Considering the large spin-period deviation of SXP 726 inferred from eROSITA data with respect to published values, we re-visited all available archival XMM-Newton observations of the SMC covering the pulsar to investigate its evolution in more detail. In particular, we found 31 observations with counting statistics sufficient to search for periodicities. We re-processed the data from these observations using XMMSAS v.19, applying the standard screening criteria described in the documentation4, and correcting photon arrival times to the Solar System barycen-tre assuming the position reported in Eger & Haberl (2008b). After this, source photons in the 0.2–10 keV energy band from a source-centred region with radius of 30″ were extracted for all EPIC cameras, and periodicity was searched in the 700–900s range, using  statistics (Buccheri et al. 1983). The uncertainties for the strongest peak were estimated as width of the peak at a level corresponding to 1σ uncertainty, which was estimated assuming that the
  statistics follows the x2 distribution for 4 dof (Buccheri et al. 1983).
The results, along with the values measured by eROSITA and values reported by Eger & Haberl (2008b) for some of the observations also reported here, are presented in Fig. 20. It is evident that the eROSITA measurements follow a general spin-down trend. To estimate the spin-down rate, we performed a linear fit to all data points obtained in this work (i.e. including XMM-Newton points), which resulted in Ṗ = 0.01178(6) s day−1 (4.3 s yr−l). This means that the period change is highly significant and slightly higher in value than reported by Eger & Haberl (2008b).
To estimate the source flux observed by eROSITA, we fitted all observations of November 2019 simultaneously with a simple absorbed power-law model. The absorption component was consistent with the Galactic foreground absorption, and no additional absorbing material was required. The foreground column density was fixed at 6 × 1020 cm−2, and the power-law normalisation was left free. The inferred power-law index was 0.63 ± 0.13 and the average observed flux (0.2–10 keV) 1.14 ±0.21 × 10⁻¹³ergcm−2s−1. This corresponds to a luminosity of 5.2 × 1034 erg s−1. The spectra with the best-fit model are shown in Fig. 21.
During observation 710000, SXP 726 was sufficiently bright to analyse the spectrum individually. The power-law index was 0.70 ±0.06, consistent within errors with the value obtained from the observations in November 2019. The observed flux was  and the luminosity 3.3 × 1035ergs−1.
To place the eROSITA flux in the context of the historical flux evolution of SXP 726, we also analysed the available XMM-Newton observations of the source. To estimate the source flux, we used the same procedure as for the eROSITA data, that is, we fitted source spectra using the absorbed power-law model. For observations in which the source was detected by multiple EPIC cameras, the spectra were modelled simultaneously by linking the model parameters. The source flux in the 0.2–10 keV band and its uncertainty were then estimated using the cflux component in XSPEC. The results are presented in Fig. 22. It is evident that the source is generally quite variable, and the eROSITA observations occurred at flux levels typically observed from SXP 726 during recent years.
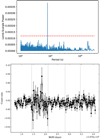 |
Fig. 18 Top: LS periodogram obtained from the combined light curve of SXP 726 shown below. The dashed red line indicates the 99% confidence level. Bottom: background-subtracted and vignetting-corrected light curve of SXP 726 (binned at twice the pulse period) in the energy band of 0.2–8 keV. |
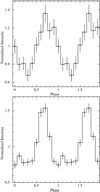 |
Fig. 19 Background-subtracted pulse profile of SXP 726 in the energy range of 0.2–8 keV averaged over all the observations in which pulsations were detected (top) and for ObsID 710000 (bottom). |
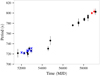 |
Fig. 20 Spin period evolution of SXP 726 measured in this work using the XMM-Newton (black) and eROSITA (red) data. The values reported by Eger & Haberl (2008b) for some of the XMM-Newton observations are also plotted for reference (blue crosses). |
 |
Fig. 21 Top: simultaneous spectral fit of an absorbed power law to the spectra of SXP 726 using observations 700001–5 (marked in black, red, green, blue, and cyan, respectively). Bottom: spectrum of SXP 726 from observation 710000. All spectra are obtained by combining data from TM1–4 and 6. The histograms trace the best-fit model, and the residuals are plotted in the narrow panels. |
 |
Fig. 22 Variability of SXP 726 as observed by XMM-Newton and eROSITA (red). The blue points correspond to flux values reported by Eger & Haberl (2008b), whereas black points are reported here for the first time. The upper limits for observations when the source was not detected are also indicated (green arrows). |
5.5 RXJ0103.6–7201, or SXP 1323, or [HS16] 62
SXP 1323 has been extensively monitored by various X-ray observatories due its close angular distance to supernova remnant 1E 0102.2–7219, which is used as calibration standard by many X-ray observatories (Plucinsky et al. 2017). X-ray pulsations were discovered by Haberl & Pietsch (2005) in XMM-Newton data. Their long-term light curve created from ROSAT, Chandra, and XXMM-Newton data from 1991–2004 was extended by Carpano et al. (2017) until the end of 2016. Their study of the Suzaku, Chandra, and XXMM-Newton data showed that the pulse period stayed relatively stable around 1323 s from 2000 to 2006, but afterwards, the source started to spin-up rapidly and reached 1110 s by mid 2016. Since then, the source continued to spin-up at a similar rate, and the pulse period of 1005 s during the eROSITA CalPV phase was already announced by Haberl et al. (2019).
SXP 1323 was detected in all the November 2019 observations (700001–5) and the June 2020 observation (710000) performed by eROSITA with count rates in the range between 0.09 cts s−1 and 0.68 cts s−1 (Table 5). The combined light curve from November 2019 is shown in Fig. 23 for two energy bands, a soft band (0.2–2 keV) and a hard band (2.5–8 keV). The hard band was chosen to avoid any possible residual contribution from the nearby supernova remnant (see Fig. 24), which exhibits a soft X-ray spectrum. Some variability by a factor of ~3 is seen in the hard-band light curve of the pulsar, while in the soft band, variations are reduced to a factor of ~2. The hardness ratio (ratio of count rates in the hard and soft bands) shows a slight decreasing (softening) trend during the 3.4 days, but caution is required due to the large PSF at the large off-axis angles during observations 700002–5 (see also below).
In the eROSITA data, pulsations are detected most significantly during observation 700001 from November 7, 2019, when the source was brightest and close to the telescope optical axis. Our timing analysis revealed the pulse period at 1006.3 ± 5.6 s. The LS periodogram is presented in Fig. 25 and shows signal at the fundamental frequency and the second harmonic (3w), but not at the first harmonic (2w). This is different from periodograms obtained from XMM-Newton observations in the first years of this century (Haberl & Pietsch 2005), when the fundamental and the first harmonic were seen. Correspondingly, the pulse profile from the eROSITA observation 700001 (presented in Fig. 26) shows two narrow peaks, while the XXMM-Newton profiles were characterised by a structured broader peak.
Figure 27 shows the long-term evolution of the pulse period of SXP 1323, as in Carpano et al. (2017), but including the latest XMM-Newton and eROSITA measurements. The ten new XMM-Newton observations are spanning from October 26, 2016 (ObsID: 0412983201) to October 30, 2020 (ObsID: 0810880701), when the pulse period monotonically decreased from 1090.86 s to 976.91 s (note that pulsations are not detected significantly in all ten observations). Using the latest data, the spin up rate is now Ṗ = -23.2 syr−1, as inferred from a linear fit to the data in the 2005–2021 time interval. With a mean value of 1168 s, the corresponding relative spin period change is |Ṗ/P| = 0.0199 yr−1. Between 2010 and 2014, pulsations were only occasionally detected if at all, and were at a low confidence level (Carpano et al. 2017). A comparison of the spin-up trend from the epochs before and after this break suggests that the spin-up rate was reduced during the break (Fig. 27). The first measured period after the break is about 50 s longer than expected from the extrapolation of the data before the break. This also implies even higher spin-up rates before and after the break compared to the 16-yr average (see also Mereminskiy et al. 2022).
Because of the vicinity of SXP I323 to IE0102.2–7219, special care has to be taken for the definition of the extraction regions for source and background spectra. In particular, for the off-axis observations of IE 0102.2–7219, the larger PSF causes a significant contribution of the supernova remnant flux to the spectra of SXP 1323, as shown in Fig. 24. The background regions were carefully selected to remove this emission, taking into account the distance of SXP 1323 to IE 0102.2–7219 and also the asymmetric shape of the PSF at large off-axis angles.
The spectra extracted from observations 700001–5 and 710000 were fitted simultaneously. An absorbed power-law provided an adequate description to the spectrum. For this purpose, we used two absorption components: one to describe the Galactic foreground absorption (fixed at 6 × 1020 cm−2), and another to account for the column density of both the interstellar medium along the line of sight in the SMC and the local absorption near the source. For the latter absorption component, the abundances were set to 0.2 solar for elements heavier than helium, as described before. In the fits only the power-law normalisation was left free to vary between observations. The obtained power-law photon index is 0.50 + 0.02, and NE = 9.8 + 2.5 × 1020 cm−2 (reduced χ2 =1.1 for 1581 dof). During the November 2019 observations, the observed flux (0.2–10keV) decreased from 4.5 × 10⁻¹² erg cm−2 s−1 (700001) to 3.1 × 10⁻¹² erg cm−2 s−1 (700005), as already indicated by the light curve (Fig. 23), and was even lower at 5.7 × 10⁻¹³ erg cm−2 s−1 in June 2020. This corresponds to luminosities of 2.0 × 1036 ergs−1, 1.3 × 1036 erg s−1, and 2.5 × 1035 erg s−1. The result of the simultaneous spectral fit with the best-fit model is shown in Fig. 28.
 |
Fig. 23 Background-subtracted and vignetting-corrected light curves of SXP 1323 from observations 700001–5, binned at twice the pulse period in the energy range of 2.5–8 keV (top) and 0.2-2.5 keV (middle). Bottom: hardness ratio (H/S) of SXP 1323. |
 |
Fig. 24 Images of the region around IE 0102.2–7219 and SXP I323 from the six CalPV observations. The source and background-extraction regions we used for the temporal and spectral analyses of SXP 1323 are marked. |
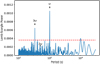 |
Fig. 25 LS periodogram obtained from the light curve extracted from ObsID 700001 of SXP I323. The dashed red line indicates the 99% confidence level. |
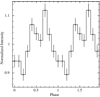 |
Fig. 26 Background-subtracted pulse profile of SXP 1323 in the energy range of 0.2–10 keV from observation 700001, in which pulsations were detected. |
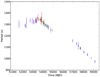 |
Fig. 27 Long-term spin period evolution of SXP 1323, following Carpano et al. (2017), which includes Suzaku (green), XMM-Newton (blue), Chandra (red), and eROSITA (pink) observations. |
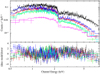 |
Fig. 28 eROSITA spectra of SXP 1323 (observations 700001–5 marked in black, red, green, blue, and cyan, respectively, and 710000 in magenta), together with the best-fit power-law model and the residuals from the simultaneous fit. The spectrum from each observation is obtained by combining data from TMl–l and 6. |
6 Discussion
6.1 HMXBs in the Magellanic Clouds as seen during eROSITA CatPV observations
The eROSITA observations around SNI987A and N l32D in the LMC covered 14 known (candidate) HMXBs. Six of them were not detected in any of the observations, and upper limits between 1.5 × 10⁻³ cts s−1 and 1.1 × 10⁻² cts s−1 were derived. Assuming the spectral parameters derived for the new transient SRGEt JO52829.5–690345 (see below), these correspond to fluxes from 1.2 × 10⁻¹⁴ergcm−2 s−1 to 8.8 × 10⁻¹⁴ erg cm−2 s−1, or luminosities from 4.2 × 1033 erg s−1 to 3.1 × 1034ergs−1 (0.2–8.0 keV). All other sources (we exclude LMCX-1 from our analysis) were detected in at least one of the observations with fluxes (luminosities) in the range of 4.3 × 10⁻¹⁴ erg cm−2 s−1 to 1.7 × 10⁻¹² erg cm−2 s−1 (1.5 × 1034 erg s−1 to 5.9 × 1035 erg s−1). The brightest sources were the SFXT XMMUJ053108.3–690923 (Maitra et al. 2021) and the supergiant HMXB candidate RXJ0541.4–6936, the latter being undetected in one observation with an upper limit a factor of ~30 below the two detections.
The SMC observations around IE 0102.2–7219 covered 23 HMXBs, most likely all BeXRBs. The SMC observations were more sensitive for point source detection than those of the LMC, resulting in a factor 2–3 smaller upper limits (5.7 × 10⁻⁴ cts s−1 to 6.6×10⁻³ cts s−1, 4.5× 10⁻¹⁵ergcm−2s−1 to 5.3× 10⁻¹⁴ erg cm−2 s−1, 2.2 × 1033 erg s−1 to 2.6 × 1034 erg s−1). This is caused not only by the deeper exposures, but is also due to the stronger diffuse X-ray emission in the LMC. Only one of the known SMC BeXRB pulsars was not detected, although it was in the FoV of all observations (SXP 345, [HS 16] 50). Of the HMXBs without a known spin period, three were not detected ([HS 16] 114, 120 and 133). Haberl & Sturm (2016) listed [HS 16] 120 in their lowest confidence class for being a genuine HMXB. Nineteen (83%) of the HMXBs covered by the eROSITA observations were detected, with fluxes (luminosities) in the range of 1.1 × 10⁻¹⁴ erg cm−2 s−1 to 5.4 × 10⁻¹² erg cm−2 s−1 (5.2 × 1033 erg s−1 to 2.6 × 1036 erg s−1), with SXP 1323 the brightest in the SMC. These moderate flux levels (Haberl & Sturm 2016) indicate that none of the sources was in a strong outburst during the eROSITA observations, as expected for long-period, low-luminosity BeXRBs.
One of the LMC calibration observations in November 2019 revealed a new hard X-ray transient, SRGEt J052829.5–690345, with the typical characteristics of a BeXRB, but with a relatively faint X-ray luminosity of 1.2 × 1035 erg s−1. The X-ray spectrum can be modelled with a power law with photon index of  and as optical counterpart, we identified a V ~ 15.7 mag star, which shows large brightness variations in the V and I bands as monitored by the OGLE project over 18.5 yr (Figs. 5 to 7). The star varies in colour as indicated by the V – I index, which is correlated with the brightness of the star. There is some scatter in V – I for a given I, which is limited to a well-defined band, as shown in Fig. 7. This behaviour of reddening with brightness was reported from several other BeXRBs in the MCs with large variations in brightness (Treiber et al. 2021; Haberl et al. 2017; Vasilopoulos et al. 2014; Coe et al. 2012) and is interpreted as a changing size of the circum-stellar disc, which leads to variations in the infrared excess with respect to the emission from the stellar photo-sphere.
The eROSITA CalPV observations also covered three HMXB candidates in the LMC, which were selected based on X-ray hardness ratios and early-type star as likely counterpart, but did not show significant Ha emission during the spectroscopic observations performed by van Jaarsveld et al. (2018). XMMUJ052417.1–692533, one of the candidates, was detected in three eROSITA observations, and the spectra can be well represented by an absorbed power law with photon index 0.83 + 0.17, consistent with the average value found for BeXRBs in the SMC by Haberl et al. (2008). This supports the proposed HMXB nature of the source, although no Ha emission was observed. Simultaneous X-ray and optical observations are required to verify if X-ray luminosities of ~ 1034 erg s−1 can be powered when no significant circum-stellar disc is present.
In the SMC, the eROSITA observations covered 16 BeXRB pulsars, including XMMUJOIO429.4–723136, from which 164 s pulsations were discovered in eROSITA data (Carpano et al. 2022; Haberl et al. 2019). We present detailed spectral and temporal analyses for SXP 304, SXP 455, SXP 522, SXP 726, and SXP 1323. All five belong to a group of long-period (≳100s) and low-luminosity (≳5× 1036ergs−1) pulsars, which usually do not exhibit very strong outbursts with amplitudes Fmax/Fmin larger than ~500, unlike short-period BeXRB pulsars, which can reach factors larger than 104 (see Fig. 5 in Haberl & Sturm 2016).
The current pulse periods measured for SXP 304 and SXP 455 are within the range published previously, indicating little long-term spin changes over the last one to two decades. Their X-ray luminosities of ~1-5 × 1035 erg s−1 are also within the typical range observed in the past (Eger & Haberl 2008a).
SXP 455 showed the largest flare-like flux variations of all investigated BeXRBs covered by the long November 2019 observations (Fig. 12). In particular, during observation 700002, a strong flare occurred, which increased by a factor of five in flux and lasted for about 10 hours. During the flare, the pulse profile changed from double peaked to more single peaked (Fig. 13). During previous XMM-Newton observations in April and October 2000, the source was a factor of more than 2 fainter than in 2019, and the pulse profile showed indications for two peaks, in particular, at energies below 2keV (Sasaki et al. 2003, 2001). This indicates a dependence of the pulse profile on source luminosity, but it should be noted that during the eROSITA observation, the weaker peak followed the stronger one, while during the XMM-Newton observations this order was reversed. A similar flaring activity and a luminosity dependence of the pulse profile was reported from the Galactic transient 2.76 s X-ray pulsar 4U 1901+03 (Ji et al. 2020), which the authors interpreted as changes in the pulsed beaming pattern due to transitions between the sub- and super-critical accretion regimes. However, there are some differences between the flares of SXP 455 and 4U 1901+03: The flares of the SMC pulsar are stronger than the persistent emission and last longer (10 h versus a few hundred seconds). It is remarkable that the ratio of the flare durations is similar to the ratio of the spin periods of the two neutron stars.
The newly measured period of SXP 522 indicates a small spin-up of approximately -6 ± 2 s over the last seven years. However, the luminosity seen by eROSITA in 2019 is a factor of 40–100 lower than the maximum in 2012, suggesting that the source has returned to a low state after some more active period when the pulsations were discovered.
6.2 Long-term spin-period evolution of SXP 726 and SXP 1323
The spin history of SXP 726 and SXP 1323 is very different from the other three pulsars. While SXP 726 shows a nearly linear spin-down rate of 4.3 s yr−1 for about 17 yr, SXP 1323 is spinning up on average with –23.2 s yr−1 for about 16 yr.
The low X-ray luminosity of X-ray pulsars in the SMC (~1035–1036 erg s−1) and the long pulse periods (exceeding ~70– 100 s) suggest that they may be quasi-spherically accreting from stellar winds. In this case, the plasma entry in the neutron star magnetospheres is regulated by the plasma cooling rate (Elsner & Lamb 1977). At X-ray luminosities below ~4× 1036ergs−1, the Compton cooling of plasma above the magnetosphere is insufficient to keep pace with freely falling fresh matter that is gravitationally captured from the stellar wind, and a quasi-spherical subsonic turbulent shell is formed around the magnetosphere (Shakura et al. 2012). The accretion through the shell occurs subsonically (the settling accretion), no shock arises above the neutron star magnetosphere, and the accretion rate onto the neutron star Ṁ is lower than the potential mass accretion rate determined by the standard Bondi-Hoyle-Littleton value. Turbulent stresses mediate the angular momentum exchange between the shell and the magnetosphere, leading to the spin-up or spin-down of the neutron star. The angular momentum balance in this case is written as (Shakura et al. 2012, 2018; Shakura & Postnov 2018)
 (1)
(1)
Here ω = 2π/P, the coefficients A and B depend on the system parameters (the neutron star magnetic moment µ5 and moment of inertia, the stellar wind velocity v, the binary orbital period Pb, and details of the shell structure; see below). The equilibrium pulsar period reads
![${P_{{\rm{eq}}}} \approx 1000[{\rm{s}}]\mu_{30}^{{{12} \mathord{\left/ {\vphantom {{12} {11}}} \right. \kern-\nulldelimiterspace} {11}}}\left({{{{P_{\rm{b}}}} \over {10{\rm{d}}}}} \right)\dot M_{16}^{{{- 4} \mathord{\left/ {\vphantom {{- 4} {11}}} \right. \kern-\nulldelimiterspace} {11}}}\upsilon_8^4$](/articles/aa/full_html/2022/05/aa41878-21/aa41878-21-eq19.png) (2)
(2)
Here the parameters are normalised to the typical values; <ien/> is the binary orbital period (the orbit is assumed to be circular), Ṁ16 = Ṁ / (1016 g s−1) is the accretion rate onto the neutron star surface corresponding to an X-ray luminosity of Lx = 0.1Ṁc2, and υ8 = υ / (1000kms−1) is the stellar wind velocity relative to the neutron star.
For accretion rates below the equilibrium value, Ṁ < Ṁeq = (B/A)11/4, the spin-up torque can be neglected. The spin-down torque ώsd (Shakura et al. 2012,Shakura et al. 2018; Shakura & Postnov 2018) reads (see Eq. (6.9) in Shakura & Postnov 2018)
![${\dot \omega_{{\rm{sd}}}} \approx - 0.54 \times {10^{- 12}}\left[{{\rm{rad}}\,{{\rm{s}}^{- 2}}} \right]\,{{\rm{\Pi}}_0}\mu_{30}^{{{13} \mathord{\left/ {\vphantom {{13} {11}}} \right. \kern-\nulldelimiterspace} {11}}}\dot M_{16}^{{3 \mathord{\left/ {\vphantom {3 {11}}} \right. \kern-\nulldelimiterspace} {11}}}\left({{P \over {100\,{\rm{s}}}}} \right),$](/articles/aa/full_html/2022/05/aa41878-21/aa41878-21-eq20.png) (3)
(3)
where the dimensionless combination of the theory parameters Π0 ~ 1 (see Shakura et al. 2018, for more detail). This torque can be recast to the fractional period change rate as
 (4)
(4)
When the X-ray luminosity is known, formula (4) can therefore be used to estimate the neutron star magnetic moment,
![${\mu_{30}} \approx 0.16{\left[{{{\left({{{\dot P} \mathord{\left/ {\vphantom {{\dot P} P}} \right. \kern-\nulldelimiterspace} P}} \right)} \over {{{10}^{- 12}}{{\rm{s}}^{- 1}}}}} \right]^{{{11} \mathord{\left/ {\vphantom {{11} {13}}} \right. \kern-\nulldelimiterspace} {13}}}}{\rm{\Pi}}_0^{{{- 11} \mathord{\left/ {\vphantom {{- 11} {13}}} \right. \kern-\nulldelimiterspace} {13}}}\dot M_{16}^{{{- 3} \mathord{\left/ {\vphantom {{- 3} {13}}} \right. \kern-\nulldelimiterspace} {13}}}.$](/articles/aa/full_html/2022/05/aa41878-21/aa41878-21-eq22.png) (5)
(5)
In the case of SXP 726, we have  corresponding to
  and
and  which yields an estimate of the magnetic moment of the neutron star of µ30 ≃ 2.7 (corresponding to the surface polar magnetic field B ≃ 5.4 × 10¹² G), independent of the unknown binary orbital period and stellar wind velocity.
For SXP 1323, a period of P ≈ 1000 s for which an almost steady spin-up is measured at a rate of  at an X-ray luminosity of ~1036 ergs−1. The spin-up torque ώsu at the quasi-spherical settling accretion stage reads (see Eq. (4.15) in Shakura & Postnov 2018)
![${\dot \omega_{{\rm{su}}}} \approx 5.3 \times {10^{13}}\left[{{\rm{rad}}{{\rm{s}}^{- 2}}} \right]\left({{{{{\rm{\Pi}}_0}} \over {{\zeta ^{{4 \mathord{\left/ {\vphantom {4 {11}}} \right. \kern-\nulldelimiterspace} {11}}}}}}} \right)\mu_{30}^{{1 \mathord{\left/ {\vphantom {1 {11}}} \right. \kern-\nulldelimiterspace} {11}}}{\left({{{{P_{\rm{b}}}} \over {10\,{\rm{d}}}}} \right)^{- 1}}\dot M_{16}^{{7 \mathord{\left/ {\vphantom {7 {11}}} \right. \kern-\nulldelimiterspace} {11}}}\,\upsilon_8^{- 4}.$](/articles/aa/full_html/2022/05/aa41878-21/aa41878-21-eq27.png) (6)
(6)
corresponding to a fractional period change rate of
 (7)
(7)
Clearly, the strongest dependence in Eq. (7) is on the stellar wind velocity, which enables us to estimate it from measurements of the fractional period spin-up rate and X-ray luminosity,
 (8)
(8)
Substituting parameters for SXP 1323 (P ≈ 1000 s, Ṁ16 ≃ 1, Pb = 26.2 d; Carpano et al. 2017) and ignoring dimensionless theory parameters  of about unity, we find
 (9)
(9)
We note the virtual independence of this estimate of the unknown magnetic field of the neutron star. The long-term spin evolution of SXP 1323 presented in Fig. 27 and suggests a torque reversal at around MJD 53500. Therefore the equilibrium period of this pulsar could be close to ~ 1000 s. Then Eq. (2) with the velocity estimate Eq. (9) may suggest a magnetic moment of µ30 ~ 10 for this pulsar.
Thus, the quasi-spherical subsonic accretion theory (Shakura et al. 2012) applied to observations of the spin-up and spin-down of the slowly rotating X-ray pulsars SXP 1323 and SXP 726 gives reasonable (standard) estimates for the magnetic field of the neutron star and the stellar wind velocity in these systems, without making additional assumptions on the spin-up or spin-down mechanisms or involving extraordinary values of the system parameters. Further observations of such BeXRB pulsars, especially to measure their orbital periods, neutron star magnetic fields, and stellar wind velocities, can be used to test this theory in more detail.
7 Conclusions
The eROSITA pointed observations of the CalPV phase of fields in the LMC and SMC demonstrate the strength of the telescopes for the investigation of the HMXB population in the MCs, namely high sensitivity especially at energies below ~2 keV and a wide FoV. This also holds for the eROSITA all-sky survey, which is currently in progress and covers the whole Magellanic system, LMC, SMC, and the Magellanic bridge. Because of the location of the LMC in the vicinity of the south ecliptic pole (SEP), where the survey scans cross, the sources there are scanned for a much longer time than most of the sky, for instance, three weeks of scans in the northern part of the LMC per survey visit lead to a 20 times higher exposure and accumulates to ~40ks over four years. This is similar to the exposures of the CalPV observations and opens discovery space for the faint end of the HMXB luminosity function. The various timescales involved in the survey, from ~40 s per scan, six scans per day over many days in the LMC (depending on the distance to the SEP, two days in the SMC), to the eight half-yearly visits of the survey will allow us to discover new transient HMXBs and to investigate their duty cycles.
Acknowledgements
This work is based on data from eROSITA, the soft X-ray instrument aboard SRG, a joint Russian-German science mission supported by the Russian Space Agency (Roskosmos), in the interests of the Russian Academy of Sciences represented by its Space Research Institute (IKI), and the Deutsches Zentrum für Luft- und Raumfahrt (DLR). The SRG spacecraft was built by Lavochkin Association (NPOL) and its subcontractors, and is operated by NPOL with support from the Max Planck Institute for Extraterrestrial Physics (MPE). The development and construction of the eROSITA X-ray instrument was led by MPE, with contributions from the Dr. Karl Remeis Observatory Bamberg and ECAP (FAU Erlangen-Nürnberg), the University of Hamburg Observatory, the Leibniz Institute for Astrophysics Potsdam (AIP), and the Institute for Astronomy and Astrophysics of the University of Tübingen, with the support of DLR and the Max Planck Society. The Argelander Institute for Astronomy of the University of Bonn and the Ludwig Maximilians Universität Munich also participated in the science preparation for eROSITA. The eROSITA data shown here were processed using the eSASS software system developed by the German eROSITA consortium. The OGLE project has received funding from the National Science Centre, Poland, grant MAESTRO 2014/14/A/ST9/00121 to AU. N.Sh. is partially supported by RSF grant 21-12-00141. K.P. is partially supported by the RFBR grant 19-02-00790. NSh and KP also acknowledge the support from the Scientific and Educational School of M.V. Lomonosov Moscow State University ‘Fundamental and applied space research’.
Appendix A Electronic chopper
To reduce telemetry load, for example, when a very bright source is observed, part of the read-out frames recorded by the eROSITA cameras can be discarded from transmission. To do this, an electronic chopper is set to a value of n, which causes only every nth frame to be processed. This results in a reduction of the net exposure time by a factor of n, which needs to be considered by the ground software. In the eSASS pipeline version that processed the CalPV data that were publicly released6, the correction for the chopper setting was applied twice, once to the good time interval extension, and once to the dead-time correction extension in the event files. Of the CalPV data used here, three observations in the LMC (Table 1) were affected by a chopper setting of 2 (part of the time, part of the cameras). As a workaround, we multiplied the dead-time values by 2 for the corresponding time intervals to finally obtain the correct exposure times, which were used to compute count rates and fluxes. The problem has been fixed in the eSASS software, and after a future re-processing of the data, the event files will have the correct extensions.
References
- Antoniou, V., & Zezas, A. 2016, MNRAS, 459, 528 [Google Scholar]
- Antoniou, V., Zezas, A., Hatzidimitriou, D., & Kalogera, V. 2010, ApJ, 716, L140 [NASA ADS] [CrossRef] [Google Scholar]
- Arnaud, K. A. 1996, ASP Conf. Ser., 101 17 [Google Scholar]
- Brunner, H., Liu, T., Lamer, G., et al. 2022, A&A, 661, A1 (eROSITA EDR SI) [NASA ADS] [CrossRef] [EDP Sciences] [Google Scholar]
- Buccheri, R., Bennett, K., Bignami, G. F., et al. 1983, A&A, 128, 245 [NASA ADS] [Google Scholar]
- Carpano, S., Haberl, F., & Sturm, R. 2017, A&A, 602, A81 [NASA ADS] [CrossRef] [EDP Sciences] [Google Scholar]
- Carpano, S., Haberl, F., Maitra, C., et al. 2022, A&A, 661, A20 (eROSITA EDRSI) [NASA ADS] [CrossRef] [EDP Sciences] [Google Scholar]
- Clark, J. S., Bartlett, E. S., Broos, P. S., et al. 2015, A&A, 579, A131 [NASA ADS] [CrossRef] [EDP Sciences] [Google Scholar]
- Coe, M. J., Edge, W. R. T., Galache, J. L., & McBride, V. A. 2005, MNRAS, 356, 502 [NASA ADS] [CrossRef] [Google Scholar]
- Coe, M. J., Haberl, F., Sturm, R., et al. 2012, MNRAS, 424, 282 [NASA ADS] [CrossRef] [Google Scholar]
- Coe, M. J., Kennea, J. A., Evans, P. A., & Udalski, A. 2020, MNRAS, 497, L50 [NASA ADS] [CrossRef] [Google Scholar]
- Dickey, J. M., & Lockman, F. J. 1990, ARA&A, 28, 215 [Google Scholar]
- Eger, P., & Haberl, F. 2008a, A&A, 491, 841 [NASA ADS] [CrossRef] [EDP Sciences] [Google Scholar]
- Eger, P., & Haberl, F. 2008b, A&A, 485, 807 [NASA ADS] [CrossRef] [EDP Sciences] [Google Scholar]
- Elsner, R. F., & Lamb, F. K. 1977, ApJ, 215, 897 [NASA ADS] [CrossRef] [Google Scholar]
- Gaia Collaboration (Helmi, A., et al.) 2018, A&A, 616, A12 [NASA ADS] [CrossRef] [EDP Sciences] [Google Scholar]
- Graczyk, D., Pietrzynski, G., Thompson, I. B., et al. 2014, ApJ, 780, 59 [Google Scholar]
- Haberl, F., & Pietsch, W. 2005, A&A, 438, 211 [NASA ADS] [CrossRef] [EDP Sciences] [Google Scholar]
- Haberl, F., & Sasaki, M. 2000, A&A, 359, 573 [NASA ADS] [Google Scholar]
- Haberl, F., & Sturm, R. 2016, A&A, 586, A81 [NASA ADS] [CrossRef] [EDP Sciences] [Google Scholar]
- Haberl, F., Eger, P., & Pietsch, W. 2008, A&A, 489, 327 [NASA ADS] [CrossRef] [EDP Sciences] [Google Scholar]
- Haberl, F., Sturm, R., Ballet, J., et al. 2012, A&A, 545, A128 [NASA ADS] [CrossRef] [EDP Sciences] [Google Scholar]
- Haberl, F., Israel, G. L., Rodriguez Castillo, G. A., et al. 2017, A&A, 598, A69 [NASA ADS] [CrossRef] [EDP Sciences] [Google Scholar]
- Haberl, F., Carpano, S., Maitra, C., et al. 2019, ATel, 13312, 1 [NASA ADS] [Google Scholar]
- Hughes, J. P. 1994, ApJ, 427, L25 [NASA ADS] [CrossRef] [Google Scholar]
- Israel, G. L., Campana, S., Covino, S., et al. 2000, ApJ, 531, L131 [NASA ADS] [CrossRef] [Google Scholar]
- Ji, L., Ducci, L., Santangelo, A., et al. 2020, MNRAS, 493, 5680 [CrossRef] [Google Scholar]
- Kahabka, P., & Pietsch, W. 1996, A&A, 312, 919 [NASA ADS] [Google Scholar]
- Kahabka, P., Pietsch, W., Filipovic, M. D., & Haberl, F. 1999, A&AS, 136, 81 [NASA ADS] [CrossRef] [EDP Sciences] [Google Scholar]
- Kahabka, P., Haberl, F., Payne, J. L., & Filipovic, M. D. 2006, A&A, 458, 285 [NASA ADS] [CrossRef] [EDP Sciences] [Google Scholar]
- Kohno, M., Yokogawa, J., & Koyama, K. 2000, PASJ, 52, 299 [NASA ADS] [Google Scholar]
- Leahy, D. A. 1987, A&A, 180, 275 [NASA ADS] [Google Scholar]
- Lomb, N. R. 1976, Ap&SS, 39, 447 [Google Scholar]
- Luck, R. E., Moffett, T. J., Barnes, Thomas G.I., & Gieren, W. P. 1998, AJ, 115, 605 [NASA ADS] [CrossRef] [Google Scholar]
- Macomb, D. J., Fox, D. W., Lamb, R. C., & Prince, T. A. 2003, ApJ, 584, L79 [NASA ADS] [CrossRef] [Google Scholar]
- Maggi, P., Sturm, R., Haberl, F., & Vasilopoulos, G. 2013, ATel, 5674, 1 [NASA ADS] [Google Scholar]
- Maggi, P., Sturm, R., Haberl, F., Vasilopoulos, G., & Udalski, A. 2014, ATel, 5778, 1 [NASA ADS] [Google Scholar]
- Maggi, P., Haberl, F., Kavanagh, P. J., et al. 2016, A&A, 585, A162 [NASA ADS] [CrossRef] [EDP Sciences] [Google Scholar]
- Maitra, C., Haberl, F., Filipovic, M. D., et al. 2019a, MNRAS, 490, 5494 [NASA ADS] [CrossRef] [Google Scholar]
- Maitra, C., Haberl, F., Ivanov, V. D., Cioni, M.-R.L., & van Loon J. T. 2019b, A&A, 622, A29 [NASA ADS] [CrossRef] [EDP Sciences] [Google Scholar]
- Maitra, C., Haberl, F., Vasilopoulos, G., et al. 2021, A&A, 647, A8 [NASA ADS] [CrossRef] [EDP Sciences] [Google Scholar]
- Maitra, C., Haberl, F., Sasaki, M., et al. 2022, A&A, 661, A30 (eROSITA EDRSI) [NASA ADS] [CrossRef] [EDP Sciences] [Google Scholar]
- Majid, W. A., Lamb, R. C., & Macomb, D. J. 2004, ApJ, 609, 133 [NASA ADS] [CrossRef] [Google Scholar]
- Massey, P. 2002, ApJS, 141, 81 [NASA ADS] [CrossRef] [Google Scholar]
- McBride, V. A., González-Galán, A., Bird, A. J., et al. 2017, MNRAS, 467, 1526 [NASA ADS] [CrossRef] [Google Scholar]
- McGowan, K. E., Coe, M. J., Schurch, M., et al. 2007, MNRAS, 376, 759 [NASA ADS] [CrossRef] [Google Scholar]
- Mereminskiy, I. A., Mushtukov, A. A., Lutovinov, A. A., et al. 2022, A&A, 661, A33 (eROSITA EDR SI) [NASA ADS] [CrossRef] [EDP Sciences] [Google Scholar]
- Novara, G., La Palombara, N., Mereghetti, S., et al. 2011, A&A, 532, A153 [NASA ADS] [CrossRef] [EDP Sciences] [Google Scholar]
- Pietrzynski, G., Graczyk, D., Gallenne, A., et al. 2019, Nature, 567, 200 [NASA ADS] [CrossRef] [Google Scholar]
- Plucinsky, P. P., Beardmore, A. P., Foster, A., et al. 2017, A&A, 597, A35 [NASA ADS] [CrossRef] [EDP Sciences] [Google Scholar]
- Predehl, P., Andritschke, R., Arefiev, V., et al. 2021, A&A, 647, A1 [EDP Sciences] [Google Scholar]
- Rau, A., Schady, P., Greiner, J., Haberl, F., & Updike, A. 2010, ATel, 2704, 1 [NASA ADS] [Google Scholar]
- Reig, P. 2011, Ap&SS, 332, 1 [Google Scholar]
- Rolleston, W. R. J., Trundle, C., & Dufton, P. L. 2002, A&A, 396, 53 [NASA ADS] [CrossRef] [EDP Sciences] [Google Scholar]
- Sasaki, M., Haberl, F., & Pietsch, W. 2000, A&AS, 143, 391 [NASA ADS] [CrossRef] [EDP Sciences] [Google Scholar]
- Sasaki, M., Haberl, F., Keller, S., & Pietsch, W. 2001, A&A, 369, L29 [NASA ADS] [CrossRef] [EDP Sciences] [Google Scholar]
- Sasaki, M., Pietsch, W., & Haberl, F. 2003, A&A, 403, 901 [NASA ADS] [CrossRef] [EDP Sciences] [Google Scholar]
- Scargle, J. D. 1982, ApJ, 263, 835 [Google Scholar]
- Shakura, N., & Postnov, K. 2018, Proc. Sci., 288 (APCS2016), 040 [Google Scholar]
- Shakura, N., Postnov, K., Kochetkova, A., & Hjalmarsdotter, L. 2012, MNRAS, 420, 216 [Google Scholar]
- Shakura, N., Postnov, K., Kochetkova, A., & Hjalmarsdotter, L. 2018, Quasi-Spherical Subsonic Accretion onto Magnetized Neutron Stars, ed. N. Shakura (Berlin: Springer), 454, 331 [NASA ADS] [Google Scholar]
- Strüder, L., Briel, U., Dennerl, K., et al. 2001, A&A, 365, L18 [Google Scholar]
- Sturm, R., Haberl, F., Pietsch, W., et al. 2012a, A&A, 537, A76 [NASA ADS] [CrossRef] [EDP Sciences] [Google Scholar]
- Sturm, R., Haberl, F., Rau, A., et al. 2012b, A&A, 542, A109 [NASA ADS] [CrossRef] [EDP Sciences] [Google Scholar]
- Sturm, R., Haberl, F., Freyberg, M., Coe, M., & Udalski, A. 2013a, ATel, 4719, 1 [NASA ADS] [Google Scholar]
- Sturm, R., Haberl, F., Pietsch, W., et al. 2013b, A&A, 558, A3 [NASA ADS] [CrossRef] [EDP Sciences] [Google Scholar]
- Subramanian, S., & Subramaniam, A. 2009, A&A, 496, 399 [NASA ADS] [CrossRef] [EDP Sciences] [Google Scholar]
- Tatton, B. L., van Loon, J. T., Cioni, M. R. L., et al. 2021, MNRAS, 504, 2983 [NASA ADS] [CrossRef] [Google Scholar]
- Townsend, L. J., Drave, S. P., Corbet, R. H. D., Coe, M. J., & Bird, A. J. 2011, ATel, 3311, 1 [NASA ADS] [Google Scholar]
- Treiber, H., Vasilopoulos, G., Bailyn, C. D., et al. 2021, MNRAS, 503, 6187 [CrossRef] [Google Scholar]
- Tsujimoto, M., Imanishi, K., Yokogawa, J., & Koyama, K. 1999, PASJ, 51, L21 [NASA ADS] [Google Scholar]
- Turner, M. J. L., Abbey, A., Arnaud, M., et al. 2001, A&A, 365, L27 [CrossRef] [EDP Sciences] [Google Scholar]
- Udalski, A., Szymanski, M. K., Soszynski, I., & Poleski, R. 2008, Acta Astron., 58, 69 [NASA ADS] [Google Scholar]
- Udalski, A., Szymanski, M. K., & Szymanski, G. 2015, Acta Astron., 65, 1 [Google Scholar]
- van Jaarsveld, N., Buckley, D. A. H., McBride, V. A., et al. 2018, MNRAS, 475, 3253 [Google Scholar]
- Vasilopoulos, G., Haberl, F., Sturm, R., Maggi, P., & Udalski, A. 2014, A&A, 567, A129 [NASA ADS] [CrossRef] [EDP Sciences] [Google Scholar]
- Vasilopoulos, G., Haberl, F., & Maggi, P. 2017, ATel, 10 253, 1 [Google Scholar]
- Vasilopoulos, G., Maitra, C., Haberl, F., Hatzidimitriou, D., & Petropoulou, M. 2018, MNRAS, 475, 220 [Google Scholar]
- Verner, D. A., Ferland, G. J., Korista, K. T., & Yakovlev, D. G. 1996, ApJ, 465, 487 [Google Scholar]
- Wada, Q., Tsujimoto, M., & Ebisawa, K. 2012, ATel, 4628, 1 [NASA ADS] [Google Scholar]
- Wada, Q., Tsujimoto, M., Ebisawa, K., & Miller, E. D. 2013, PASJ, 65, L2 [NASA ADS] [Google Scholar]
- Wilms, J., Allen, A., & McCray, R. 2000, ApJ, 542, 914 [Google Scholar]
- Yokogawa, J., & Koyama, K. 1998, IAU Circ., 7009, 3 [NASA ADS] [Google Scholar]
- Yokogawa, J., Imanishi, K., Tsujimoto, M., Koyama, K., & Nishiuchi, M. 2003, PASJ, 55, 161 [CrossRef] [Google Scholar]
This shift is consistent with the values obtained from other eROSITA observations (Brunner et al. 2022, Lamer et al., in prep.). These papers describe statistical methods for determining astrometric corrections using large samples of objects. In the case of the MCs, this is more difficult as only few sources in the FoV have secure optical counterparts (see Maitra et al. 2019b; Sturm et al. 2013b).
The half-energy width of the telescope PSF is about 16″ at 1.5 keV (Predehl et al. 2021).
All Tables
All Figures
|
Fig. 1 LMC mosaic from eROSITA observations around SN 1987A and N 132D. Red, green, and blue represent X-ray energies in the bands 0.2–1.0keV, 1.0–2.0keV, and 2.0–4.5keV, respectively. The HMXB pulsars are marked with white circles and labelled with their pulse period measured near the time of their discovery. HMXBs and candidates without known pulse period are indicated by green circles and the entry number from Table 2. |
| In the text | |
|
Fig. 2 SMC mosaic from eROSITA observations around the supernova remnant 1E0102.2–7219, the brightest source near the image centre. Image colours and labels for the HMXB pulsars are as in Fig. 1. HMXBs without known pulse period are indicated by green circles and their entry number from HS16 (see Table 4). |
| In the text | |
|
Fig. 3 eROSITA colour image (red: 0.2–1.0 keV, green: 1.0–2.0keV, and blue: 2.0–4.5 keV) of the region around SRGEt J052829.5–690345. The transient source appears similar in colours to the SFXT XMMUJ053108.3–690923 (Maitra et al. 2021), which is located at an angular distance of~15′. The soft extended X-ray emission from the supernova remnant MCSNR J0527–6912 (e.g. Maggi et al. 2016) is also marked. |
| In the text | |
|
Fig. 4 Combined eROSITA spectrum of SRGEtJ052829.5–690345 from the cameras with on-chip filter (TM1–4 and TM6). The best-fit absorbed power-law model is shown as a histogram, and the residuals are plotted in the bottom panel. |
| In the text | |
|
Fig. 5 OGLE I-band light curve of SRGEt J052829.5–690345 between September 15, 2001, and March 13, 2020. The vertical dashed lines indicate the times of the eROSITA and archival XMM-Newton observations. |
| In the text | |
|
Fig. 6 OGLE V-band light curve of SRGEt J052829.5–690345. See also Fig. 5. The data points marked with additional black circles indicate two deep dips in the light curve that show extreme colours (see Fig. 7). |
| In the text | |
|
Fig. 7 OGLE V – I colour index vs. I (interpolated linearly to the times of the V-band measurements). The data points marked with additional black circles originate from two deep dips in the light curve (see also Fig. 6). V – I is correlated with I in a well-defined region of the parameter space, as indicated by the dashed lines. |
| In the text | |
|
Fig. 8 Combined eROSITA spectra of XMMUJ052417.1–692533 from the cameras with on-chip filter (TM1–4 and TM6). The best-fit absorbed power-law model is shown as a histogram, and the residuals are plotted in the bottom panel. The different colours indicate the observations 700156 (black), 700179 (red), and 700184 (green). The spectrum from observation 700156 includes data from TM6 only (see Table 1). |
| In the text | |
|
Fig. 9 Top: LS periodogram from the light curve of SXP 304, combining observations 700001 and 700002. The dashed red line indicates the 99% confidence level. Bottom: background-subtracted and vignetting-corrected light curve of SXP 304 (binned at twice the pulse period and including ObsID 700004) in the energy band of 0.2–8 keV. The dashed vertical lines separate the intervals corresponding to observations 700001–4. During observation 700003, the source was not in the FoV, and during observation 700005 it was not detected. |
| In the text | |
|
Fig. 10 Background-subtracted pulse profile of SXP 304 combined over observations 700001–2 in the energy range of 0.2–8 keV. |
| In the text | |
|
Fig. 11 Simultaneous spectral fit of SXP 304 spectra from observations 700001 (black), 700002 (red), 700004 (green), and 710000 (blue), showing the best-fit model as a histogram and the residuals in the bottom panel. Each spectrum was obtained by combining the data from TM1–4 and 6. |
| In the text | |
|
Fig. 12 Top: LS periodogram of SXP 455 from the combined light curve of observations 700001–2. The dashed red line indicates the 99% confidence level. Bottom: background-subtracted and vignetting-corrected light curve of SXP 455 (binned at twice the pulse period) in the energy band of 0.2–8 keV. The dashed vertical lines separate the intervals corresponding to observations 700001–4. During observation 700005, the source was not in the FoV. |
| In the text | |
|
Fig. 13 Normalised pulse profiles of SXP 455 in the energy range of 0.2–8 keV (top: 700001 and bottom: 700002). |
| In the text | |
|
Fig. 14 Simultaneous analysis of the spectra of SXP 455 using a power-law model with a partially covering absorber (observation 700001: black, 700002: red, 700004: green, and 710000: blue). The best-fit model is plotted as a histogram, and residuals are shown in the lower panel. The spectrum from each observation is obtained by combining data from TM1–4 and 6. |
| In the text | |
|
Fig. 15 Top: LS periodogram from ObsID 700001 for SXP 522. The dashed red line indicates the 99% confidence level. Bottom: background-subtracted and vignetting-corrected light curve of SXP 522 (binned at twice the pulse period) in the energy band of 0.2–8 keV for the five observations in November 2019. |
| In the text | |
|
Fig. 16 Background-subtracted pulse profile of SXP 522 in the energy range of 0.2–8 keV. |
| In the text | |
|
Fig. 17 eROSITA spectra of SXP 522 obtained from observations 700001–5 marked in black, red, green, blue, and cyan, respectively, and 710000 (magenta). Each spectrum includes data from TM1–4 and 6. The histograms show the best-fit model, and the residuals are drawn in the lower panel. |
| In the text | |
|
Fig. 18 Top: LS periodogram obtained from the combined light curve of SXP 726 shown below. The dashed red line indicates the 99% confidence level. Bottom: background-subtracted and vignetting-corrected light curve of SXP 726 (binned at twice the pulse period) in the energy band of 0.2–8 keV. |
| In the text | |
|
Fig. 19 Background-subtracted pulse profile of SXP 726 in the energy range of 0.2–8 keV averaged over all the observations in which pulsations were detected (top) and for ObsID 710000 (bottom). |
| In the text | |
|
Fig. 20 Spin period evolution of SXP 726 measured in this work using the XMM-Newton (black) and eROSITA (red) data. The values reported by Eger & Haberl (2008b) for some of the XMM-Newton observations are also plotted for reference (blue crosses). |
| In the text | |
|
Fig. 21 Top: simultaneous spectral fit of an absorbed power law to the spectra of SXP 726 using observations 700001–5 (marked in black, red, green, blue, and cyan, respectively). Bottom: spectrum of SXP 726 from observation 710000. All spectra are obtained by combining data from TM1–4 and 6. The histograms trace the best-fit model, and the residuals are plotted in the narrow panels. |
| In the text | |
|
Fig. 22 Variability of SXP 726 as observed by XMM-Newton and eROSITA (red). The blue points correspond to flux values reported by Eger & Haberl (2008b), whereas black points are reported here for the first time. The upper limits for observations when the source was not detected are also indicated (green arrows). |
| In the text | |
|
Fig. 23 Background-subtracted and vignetting-corrected light curves of SXP 1323 from observations 700001–5, binned at twice the pulse period in the energy range of 2.5–8 keV (top) and 0.2-2.5 keV (middle). Bottom: hardness ratio (H/S) of SXP 1323. |
| In the text | |
|
Fig. 24 Images of the region around IE 0102.2–7219 and SXP I323 from the six CalPV observations. The source and background-extraction regions we used for the temporal and spectral analyses of SXP 1323 are marked. |
| In the text | |
|
Fig. 25 LS periodogram obtained from the light curve extracted from ObsID 700001 of SXP I323. The dashed red line indicates the 99% confidence level. |
| In the text | |
|
Fig. 26 Background-subtracted pulse profile of SXP 1323 in the energy range of 0.2–10 keV from observation 700001, in which pulsations were detected. |
| In the text | |
|
Fig. 27 Long-term spin period evolution of SXP 1323, following Carpano et al. (2017), which includes Suzaku (green), XMM-Newton (blue), Chandra (red), and eROSITA (pink) observations. |
| In the text | |
|
Fig. 28 eROSITA spectra of SXP 1323 (observations 700001–5 marked in black, red, green, blue, and cyan, respectively, and 710000 in magenta), together with the best-fit power-law model and the residuals from the simultaneous fit. The spectrum from each observation is obtained by combining data from TMl–l and 6. |
| In the text | |
Current usage metrics show cumulative count of Article Views (full-text article views including HTML views, PDF and ePub downloads, according to the available data) and Abstracts Views on Vision4Press platform.
Data correspond to usage on the plateform after 2015. The current usage metrics is available 48-96 hours after online publication and is updated daily on week days.
Initial download of the metrics may take a while.