| Issue |
A&A
Volume 655, November 2021
|
|
|---|---|---|
| Article Number | A12 | |
| Number of page(s) | 14 | |
| Section | Interstellar and circumstellar matter | |
| DOI | https://doi.org/10.1051/0004-6361/202141804 | |
| Published online | 28 October 2021 | |
Kinetic temperature of massive star-forming molecular clumps measured with formaldehyde
IV. The ALMA view of N113 and N159W in the LMC★
1
Xinjiang Astronomical Observatory, Chinese Academy of Sciences,
830011
Urumqi,
PR China
e-mail: tangxindi@xao.ac.cn
2
Key Laboratory of Radio Astronomy, Chinese Academy of Sciences,
830011
Urumqi,
PR China
3
Max-Planck-Institut für Radioastronomie,
Auf dem Hügel 69,
53121
Bonn,
Germany
e-mail: chenkel@mpifr-bonn.mpg.de
4
Astronomy Department, King Abdulaziz University,
PO Box 80203,
21589
Jeddah,
Saudi Arabia
5
Korea Astronomy and Space Science Institute,
776 Daedeok-daero,
Yuseong-gu,
Daejeon
34055,
Republic of Korea
6
National Radio Astronomy Observatory,
520 Edgemont Road,
Charlottesville,
VA 22903,
USA
7
Purple Mountain Observatory, Chinese Academy of Sciences,
Nanjing
210008,
PR China
8
Argelander Institut für Astronomie, Universität Bonn,
Auf dem Hügel 71,
53121
Bonn,
Germany
9
Department of Space, Earth and Environment, Chalmers University of Technology, Onsala Space Observatory,
43992
Onsala,
Sweden
10
Observatorio de Madrid, OAN-IGN, Alfonso XII, 3,
28014-
Madrid,
Spain
11
European Southern Observatory, Alonso de Córdova 3107, Vitacura,
Santiago
763-0355,
Chile
12
Joint ALMA Observatory, Alonso de Córdova 3107, Vitacura,
Santiago
763-0355,
Chile
13
Leiden Observatory, Leiden University,
PO Box 9513,
2300 RA
Leiden,
The Netherlands
14
Department of Physics and Astronomy, University College London,
Gower Street,
London,
WC1E 6BT,
UK
15
Ioffe Physical-Technical Institute,
Polytekhnicheskaya Str. 26,
194021
St. Petersburg,
Russia
16
Kapteyn Astronomical Institute, University of Groningen,
PO Box 800,
9700 AV
Groningen,
The Netherlands
17
National Radio Astronomy Observatory,
PO Box O, 1003 Lopezville Road,
Socorro,
NM 87801,
USA
18
Joint ALMA Observatory, Alonso de Cordova 3107,
Vitacura,
Santiago,
Chile
19
Department of Physics, Nagoya University,
Furo-cho,
Chikusa-ku Nagoya,
464-8601,
Japan
20
School of Astronomy and Space Science, Nanjing University,
210093
Nanjing,
PR China
21
University of Chinese Academy of Sciences,
100080
Beijing,
PR China
Received:
16
July
2021
Accepted:
23
August
2021
We mapped the kinetic temperature structure of two massive star-forming regions, N113 and N159W, in the Large Magellanic Cloud (LMC). We have used ~1.′′6 (~0.4 pc) resolution measurements of the para-H2CO JKaKc = 303–202, 322–221, and 321–220 transitions near 218.5 GHz to constrain RADEX non local thermodynamic equilibrium models of the physical conditions. The gas kinetic temperatures derived from the para-H2CO line ratios 322–221/303–202 and 321–220/303–202 range from 28 to 105 K in N113 and 29 to 68 K in N159W. Distributions of the dense gas traced by para-H2CO agree with those of the 1.3 mm dust and Spitzer 8.0 μm emission, but they do not significantly correlate with the Hα emission. The high kinetic temperatures (Tkin ≳ 50 K) of the dense gas traced by para-H2CO appear to be correlated with the embedded infrared sources inside the clouds and/or young stellar objects in the N113 and N159W regions. The lower temperatures (Tkin < 50 K) were measured at the outskirts of the H2CO-bearing distributions of both N113 and N159W. It seems that the kinetic temperatures of the dense gas traced by para-H2CO are weakly affected by the external sources of the Hα emission. The non thermal velocity dispersions of para-H2CO are well correlated with the gas kinetic temperatures in the N113 region, implying that the higher kinetic temperature traced by para-H2CO is related to turbulence on a ~0.4 pc scale. The dense gas heating appears to be dominated by internal star formation activity, radiation, and/or turbulence. It seems that the mechanism heating the dense gas of the star-forming regions in the LMC is consistent with that in Galactic massive star-forming regions located in the Galactic plane.
Key words: stars: formation / ISM: clouds / ISM: molecules / radio lines: ISM
The reduced datacubes are only available at the CDS via anonymous ftp to cdsarc.u-strasbg.fr (130.79.128.5) or via http://cdsarc.u-strasbg.fr/viz-bin/cat/J/A+A/655/A12
© ESO 2021
1 Introduction
Molecular gas is the fuel for star formation. Increasing evidence indicates that its physical properties affect the star formation rate, spatial distribution, and essential properties of the next generation of stars, such as the elemental composition and initial mass function (e.g., Paumard et al. 2006; Kennicutt 1998a,b; Klessen et al. 2007; Papadopoulos et al. 2011; Zhang et al. 2018; Tang et al. 2019). Unfortunately, the most readily accessible molecular transitions, that is those of CO, suffer from radiative transfer effects such as high optical depths or subthermal excitation, and they are not a reliable probe of these physical conditions. Furthermore, many molecules tracing the molecular mass in external galaxies (e.g., Gao & Solomon 2004a,b; Wu et al. 2005; Zhang et al. 2014; Henkel et al. 2018; Li et al. 2021), including CO, HCN, HCO+, HNC, and CS, suffer from a coupled sensitivity to kinetic temperature and density, making them degenerately sensitive to high spatial densities and low kinetic temperatures or vice versa. Obtaining information about the individual physical conditions in these regions requires a molecular tracer that possesses a singular sensitivity to kinetic temperatureand that can then be used to also determine, in a second step, the number density of molecular hydrogen, n(H2).
Formaldehyde (H2CO), a slightly asymmetric rotor molecule, is a ubiquitous molecule in the interstellar medium (e.g., Downes et al. 1980; Bieging et al. 1982; Henkel et al. 1991; Zylka et al. 1992; Liszt et al. 2006; Mangum et al. 2008, 2013, 2019; Ao et al. 2013; Tang et al. 2013, 2014; Ginsburg et al. 2015, 2016; Guo et al. 2016; Yan et al. 2019). It can be formed on the surface of dust grains by the successive hydrogenation of CO (CO →HCO →H2CO) (Watanabe & Kouchi 2002; Woon 2002; Hidaka et al. 2004; Yan et al. 2019). It is then released into the gas phase by shocks or ultraviolet (UV) heating and then destroyed by photodissociation. Alternatively, gas phase formation also possibly contributes to the total H2CO abundance in Galactic environments such as the dark cloud TMC-1 (e.g., Soma et al. 2018). Furthermore, CH3OH, which is also the product of the hydrogenation of CO on grain surfaces and is hardly formed in the gas phase, is deficient in the Large Magellanic Cloud (LMC; e.g., Shimonishi et al. 2016). In the LMC where dust is less abundant than in the Galaxy, gas phase formation of H2CO may thus be relevant.
Formaldehyde has a stable fractional abundance in star formation regions. Variations in the fractional abundance of H2CO rarely exceed one order of magnitude at various stages of star formation (e.g., Mangum et al. 1990, 1993; Caselli et al. 1993; Johnstone et al. 2003; Gerner et al. 2014; Tang et al. 2017a,b, 2018b; Zhu et al. 2020). As further demonstrated in recent studies of formaldehyde in the LMC, the fractional abundance of para-H2CO in its star-forming regions has similar values as in Galactic regions of massive star formation (Tang et al. 2017a,b, 2018b). Furthermore, H2CO has a rich variety of millimeter and submillimeter transitions which are a reliable probe to trace physical conditions of molecular clouds (e.g., Henkel et al. 1980, 1983; Mangum & Wootten 1993; Mühle et al. 2007; Mangum et al. 2008, 2013, 2019; Ginsburg et al. 2011; Tang et al. 2017a,b, 2018a,b). Since the relative populations of the Ka ladders of H2CO are governed by collisions, line ratios involving different Ka ladders are good tracers of the kinetic temperature (Mangum & Wootten 1993). Therefore, these H2CO line ratios are an ideal thermometer for tracing the temperature of dense gas in low-metallicity galaxies with strong UV radiation (Tang et al. 2017b).
The LMC is the closest star-forming galaxy to our Milky Way (~50 kpc, e.g., Pietrzyński et al. 2013, 2019). In the LMC, the far-ultraviolet (FUV) radiation field is stronger than in the Milky Way while metallicities are lower (Westerlund 1990; Rolleston et al. 2002). The LMC provides an ideal laboratory for studying star formation, particularly massive star formation associated with its numerous stellar clusters in such an active low-metallicity galaxy. Previous observations of CO J = 1–0 and 3–2 show that the higher gas temperatures in low and moderate density regions (n(H2) ~ a few × 103 cm−3 in most cases) are correlated with a stronger Hα flux in giant molecular clouds of the LMC (Minamidani et al. 2008, 2011). Further observations of CO J = 4–3 to 12–11 indicate that the gas temperatures are high (Tkin > 150 K) at densities ~103 cm−3 in active star-forming regions of the LMC (Lee et al. 2016). These suggest that FUV heating may strongly impact the molecular gas in low density regions (n(H2) < 105 cm−3) of the LMC. In contrast, recent low-resolution (30″ or ~7 pc) observations of para-H2CO J = 3–2 show that the kinetic temperatures of the dense gas (n(H2) ~ 105 cm−3) are correlated with the ongoing massive star formation in the LMC (Tang et al. 2017b). This suggests that inside the LMC, the gas heating may be different between molecular cloud layers of lower and higher density. Although gas heating in low density regions of molecular clouds of the LMC can be expected to be due to the exciting OB stars of photon dominated regions (PDRs; e.g. Kaufman et al. 1999; Lee et al. 2019), the detailed relationship between the temperature of the dense gas and the star formation inthe LMC is still under debate.
In this paper, we aim to map the kinetic temperature structure of two massive star-forming regions, N113 and N159W, in the LMC with the para-H2CO triplet ( = 303–202, 322 –221, and 321 –220) near 218.5 GHz and to investigate the gas heating process affecting the dense gas. In Sects. 2 and 3, we introduce our targets, observations of the para-H2CO triplet, datareduction, and results. We discuss the resulting kinetic temperatures derived from para-H2CO in Sect. 4. Our main conclusions are summarized in Sect. 5. This paper is part of the “Kinetic temperatureof massive star-forming molecular clumps measured with formaldehyde” series of studies exploring H2CO as a probe of gas conditions in a variety of Galactic and extragalactic sources.
2 Targets, observations, and data reduction
2.1 Targets
The two massive star-forming regions, N113 and N159W, in the LMC were selected from previous single dish observations with the Atacama Pathfinder EXperiment telescope (APEX; beam size ~30″) in the course of which three transitions of para-H2CO (J = 3–2) near ~218.5 GHz were detected (Tang et al. 2017b). The dense gas kinetic temperatures of N113 and N159W derived from these para-H2CO line ratios are 54 ± 7 K and 35 ± 4 K, respectively, on a scale of ~7 pc (Tang et al. 2017b).
In what follows, a brief description of the selected targets is provided.
N113
located in the central part of the LMC, contains the most intense H2O maser of the Magellanic Clouds (Ellingsen et al. 2010), which indicates active star formation activity at an early stage. A large number of molecular transitions have been reported in N113 (e.g., Chin et al. 1996, 1997; Heikkilä et al. 1998; Wang et al. 2009; Paron et al. 2014; Nishimura et al. 2016; Tang et al. 2017b; Sewiło et al. 2018, 2019), while interferometric data from HCN, HCO+, HNC, CH3OH, and 1.3 mm continuum (Wong et al. 2006; Seale et al. 2012; Sewiło et al. 2018, 2019) reveal a filamentary structure elongated roughly north-south with a length of ~6 pc, including a few dense clumps with radius ~0.5 pc.
Observational parameters.
N159W
located at the southwestern tip of 30 Doradus, one of the most intense star-forming regions in the LMC, contains a large number of O- and B-type stars, embedded young stellar objects (YSOs), and ultracompact H II regions (e.g., Jones et al. 2005; Fariña et al. 2009; Chen et al. 2010; Carlson et al. 2012). It shows the brightest single-dish CO (J = 1–0) peak in the LMC (e.g., Johansson et al. 1994; Fukui et al. 1999; Wong et al. 2011) and has been frequently observed with a large number of molecular transitions (e.g., Johansson et al. 1994; Chin et al. 1996, 1997; Heikkilä et al. 1998, 1999; Paron et al. 2014; Pineda et al. 2008; Lee et al. 2016; Nishimura et al. 2016; Tang et al. 2017b). High resolution observations reveal a complex filamentary distribution of molecular gas (Seale et al. 2012; Fukui et al. 2015). The gas temperature obtained from the NH3(2,2)/(1,1) line ratio at ~19″ resolution is ~16 K (Ott et al. 2010), which is only about half the temperatures derived from low resolution (~30″) para-H2CO and the dust (Tang et al. 2017b). After deriving kinetic temperatures from our high resolution H2CO data, this difference will be discussed in more detail in Sect. 4.1.
2.2 Observations and data reduction
Our observations were carried out with the 12 m array of the Atacama Large Millimeter/submillimeter Array (ALMA) at Band 6 (Project: 2013.1.01136.S). Two Execution Blocks were conducted using 35 and 38 antennas in January 17 and April 8, 2015, respectively. The projected baseline lengths ranged from 15 to 349 m. The primary beam (FWHM) and the maximum recoverable scale are ~ 29″ and ~ 13″, respectively. The flux, bandpass, and phase calibrators were J0519-454, J0519-4546, and J0635-7516, respectively. Three spectral windows were centered on SiO (5–4), H2CO (322–221), and CO (2–1), respectively, with a ~937.5 MHz bandwidth and 960 channels for each band, yielding a channel width of 976.562 kHz, corresponding to 1.27–1.35 km s−1. For the para-H2CO triplet the synthesized beam size is ~1.′′6 × 1.′′3 (~0.4 × 0.3 pc2 at 50 kpc distance). The surveyed areas of N113 and N159W are centered on α2000 = 05:13:18.2, δ2000 = –69:22:25.0 and α2000 = 05:39:36.0, δ2000 = –69:45:25.0, respectively. Detailed observational parameters are listed in Table 1. The para-H2CO  = 303–202, 322 –221, and 321 –220 transitions have rest frequencies of 218.222, 218.475, and 218.760 GHz, respectively.
The data were calibrated using the CASA1 version 4.2.2pipeline and were then imaged using CASA version 5.6.1. We imaged the calibrated data using a modified script associated with the data release. No primary beam correction has been applied for Figs. 1, A.1, and A.2, but it has been applied for data analysis. Data analysis associated with spectral lines and images was performed using GILDAS2. A typical rms noise level is ~2.0 mJy beam−1 for a 1.34 kms−1 wide channel (see Table 1).
As mentioned in Sect. 2.1, the para-H2CO (3–2) triplet has been observed before with the APEX 12 m telescope in N113 and N159W (Tang et al. 2017b). We integrate allthe emission within our ALMA data and compare it to the single-dish APEX 12 m data (beam size ~30″). The fluxes recovered by our interferometer data are ~75%, ~80%, and ~80% for para-H2CO 303–202, 321 –220, and 322 –221, respectively, in N113. We find that ~45%, ~50%, and ~50% of the para-H2CO 303–202, 321 –220, and 322 –221 integrated flux observed by the APEX 12 m telescope is recovered for N159W by our ALMA data, respectively. These indicate that the para-H2CO (3–2) triplets have, for a given source, similar missing flux percentages.
We note that our observational field centers of N113 and N159W have ~6" and ~13" offsets with respect to those used by Tang et al. (2017b), respectively. This may affect the comparison of our ALMA and single-dish data, especially for N159W. Our central positions are farther to the east (N113) and north (N159W) of the bulk of the emission shown in Fig. 1, so that part of the missing flux in our ALMA data may not be due to a lack of short baselines but due to the chosen field centers. In the optically thin regime, the critical density of the para-H2CO 303–202 transition is ~6 × 105 cm−3 at kinetic temperature 50 K (Shirley 2015), so the para-H2CO (3–2) triplet probes compact emission regions. Considering that the para-H2CO (3–2) triplet is a dense gas tracer and has similar missing flux percentages within N113 and N159W, the line ratios of the para-H2CO (3–2) transitions are likely only weakly influenced by missing flux.
3 Results
3.1 Overview
The integrated intensity distributions of the para-H2CO triplet in N113 and N159W are shown in Fig. 1. The observed spectra from the H2CO peaks in N113 and N159W are shown in Fig. 2. The location of the seven dense H2CO clumps in each of the two massive star forming regions, selected by eye, are indicated in Figs. 3 and 4, left panels, and are listed in Table 2.
3.2 Distribution of H2CO
In both sources, N113 and N159W, para-H2CO (303–202) shows extended distributions and clearly traces dense molecular structure, which is consistent with previous observational results probed with other gas tracers of, for example, 13CO, HCN, HNC, and HCO+ (Wong et al. 2006; Seale et al. 2012; Fukui et al. 2015; Sewiło et al. 2018). The para-H2CO 322 –221 and 321 –220 lines are only detected in the densest regions of N113 and N159W, and show less extended distributions than the para-H2CO 303 –202 transition.
The para-H2CO 303 –202 velocity channel maps of N113 and N159W are shown in Figs. A.1 and A.2, respectively. In N113, the filamentary structure, roughly elongated in north-south direction with a length of ~25″, is prominent at low velocities, ~232–236 km s−1, while the northeastern clump (clump 1 following the nomenclature of Fig. 3 and Table 2) becomes visible at higher velocities, ~236–238 km s−1. In the N159W region, there appear to be two velocity components centered at ~236 and ~240 km s−1 spreading from the northeast to the southwest.
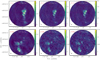 |
Fig. 1 Velocity-integrated intensity maps (color bars in units of Jy beam−1 km s−1) of para-H2CO 303–202 (left panels),322–221 (central panels), and 321–220 (right panels) of N113 (integrated local standard of rest velocity range: 229–240 km s−1; top panels) and N159W (integrated velocity range: 232–244 km s−1; bottom panels). The centers of the fields are those also given in Sect. 2.2, i.e., α2000 = 05:13:18.2, δ2000 = –69:22:25.0 and α2000 = 05:39:36.0, δ2000 =– 69:45:25.0. The contours provide, with respect to the peak intensity, levels from 10 to 100% with steps of 10% (~10σ and ~7σ) for para-H2CO 303–202 in N113 and N159W, and from 10% to 100% with steps of 10% (~5σ) for para-H2CO 322-221 and 321 –220. The para-H2CO 303–202 peak intensities are 1.2 and 0.5 Jy beam−1 km s−1, the para-H2CO 322–221 peak intensities are 0.5 and 0.2 Jy beam−1 km s−1, and the para-H2CO 321–220 peak intensities are 0.5 and 0.2 Jy beam−1 km s−1 in N113 and N159W, respectively. The pixel size of each image is 0.′′2×0.′′2. The beam size of each image is shown in the lower left corner. Gray circles show the half power beam sizes of the N113 and N159W APEX-12m data, reported by Tang et al. (2017b). The shown fields of view encompass slightly more than our ALMA primary half power beam width (Sect. 2.2). No primary beam correction has been applied. Angular scales of 4″ correspond to a linear scale of ~1 pc. |
3.3 H2CO line ratios
As mentioned in Sect. 1, the intensity ratio of para-H2CO lines involving different Ka ladders yields estimates of the kinetic temperature of the gas (Mangum & Wootten 1993). Generally, higher line ratios of para-H2CO (322–221/303–202 and 321 –220/303–202) indicate higher kinetic temperatures (e.g., Mangum & Wootten 1993; Ao et al. 2013; Ginsburg et al. 2016; Tang et al. 2017b, 2018a,b; see also Fig. 5 for a more detailed view). Therefore, the ratio maps can be used as a proxy for relative kinetic temperature. The upper levels of the para-H2CO 322–221 and 321 –220 transitions have almost the same energy above the ground state (Eu ≃ 68 K). They show similar spatial distributions (see Fig. 1), similar line profiles (for brightness temperature, linewidth, and velocity in our observations; see Fig. 2 and also Tang et al. 2017a,b, 2018a,b), and are often detected simultaneously in molecular clouds (e.g., Bergman et al. 2011; Wang et al. 2012; Lindberg & Jørgensen 2012; Ao et al. 2013; Immer et al. 2014; Treviño-Morales et al. 2014; Ginsburg et al. 2016, 2017; Tang et al. 2017a,b, 2018a,b; Lu et al. 2017, 2021; Mangum et al. 2019). Therefore, we use the averaged ratio para-H2CO 0.5 × [(322–221 + 321–220)/303–202] between para-H2CO 322–221/303–202 and 321 –220/303–202 for the first highly qualitative analysis below.
Averaged para-H2CO (3–2) line ratio maps of N113 and N159W are shown in the left panels of Figs. 3 and 4, respectively. The line ratios are calculated by velocity-integrated intensities where the para-H2CO 322–221 and 321 –220 lines are detected with signal-to-noise ratios (S∕N) ≳ 3σ. Para-H2CO line ratios range from 0.10 to 0.38 with an average of 0.22 ± 0.01 (errors given here and elsewhere are standard deviations of the mean) in N113 and from 0.10 to 0.28 with an average of 0.20 ± 0.01 in N159W (see also Table 3). The lower ratios (<0.2) occur in the outskirts of the N113 and N159W H2CO clouds (see Figs. 3 and 4). Higher ratios (≳0.2) associate with dense clumps, YSOs (or YSO candidates; Chen et al. 2010; Carlson et al. 2012), and/or H2O masers (Ellingsen et al. 2010) in N113 and N159W.
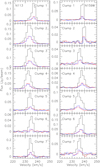 |
Fig. 2 Spectra toward H2CO clumps in N113 (left panels) and N159W (right panels; see Table 2 and, for the numbering, the left panels of Figs. 3 and 4) taken from the strongest pixel obtained with ALMA. The pixel size is 0.′′ 2 × 0.′′2. Black: para-H2CO 303–202, red: para-H2CO 322–221, and blue: para-H2CO 321–220. The spectra are not smoothed, i.e., the channel widths are those given in Table 1. |
3.4 Kinetic temperatures from H2CO line ratios
According to Sect. 3.3, the para-H2CO 322–221 and 321 –220 transitions have almost the same upper-state energies above the ground state and similar observed line profiles. Para-H2CO 322–221/303–202 and 321 –220/303–202 ratios are both good thermometers to determine kinetic temperatures (Tkin < 150 K; Mangum & Wootten 1993; Tang et al. 2018b) and show a similar behavior to kinetic temperature and spatial density at densities n(H2) ≳ 105 cm−3 (Lindberg et al. 2015; Tang et al. 2017a). Therefore, we continue to use the averaged para-H2CO ratio 0.5 × [(322–221 + 321–220)/303–202] to directly determine gas kinetic temperatures.
Using the RADEX3 non local thermodynamic equilibrium (LTE) modeling program (van der Tak et al. 2007) with collisional rate coefficients from Wiesenfeld & Faure (2013), we modeled the relation between the gas kinetic temperature and the measured average of para-H2CO 0.5 × [(322–221 + 321–220)/303–202] ratios, adopting a 2.73 K background temperature, an average observational linewidth of 4.0 km s−1, and column densities N(para-H2CO) = 2.7 × 10¹² and 3.7 × 1012 cm−2 for N113 and N159W, respectively. The results are shown in Fig. 5. The values of the para-H2CO column density were obtained with APEX data (beam size ~30″; Tang et al. 2017b), which cover similar regions. Different column densities of para-H2CO only weakly affect derived kinetic temperatures (see Fig. 3 in Tang et al. 2017b or Fig. 4 in Tang et al. 2018a; this was also shown in Fig. 13 and discussed in Sect. 4.3.1 of Mangum & Wootten 1993) as long as all lines are optically thin. Considering that the relation between the gas temperature and the para-H2CO line ratio may vary at different spatial densities (see Fig. 2 in Tang et al. 2017b), we modeled it at spatial densities 104, 105, and 106 cm−3 in Fig. 5. It appears that Tkin at n(H2) = 105 cm−3 is consistently lower than values at 104 and 106 cm−3 by ≲23% and ≲34%, respectively, for Tkin ≲ 100 K. Local thermodynamic equilibrium (LTE) is a good approximation for the H2CO level populations under optically thin and high-density conditions (Mangum & Wootten 1993; Tang et al. 2017a,b, 2018b). Following the method applied by Tang et al. (2017b) in their Eq. (2), we plot the relation between the LTE kinetic temperature, TLTE, and the para-H2CO (3–2) line ratio in Fig. 5. Apparently, TLTE agrees well with Tnon-LTE at volume densities n(H2) ~ 105 cm−3 as long as Tkin ≲ 100 K. Previous observations show that para-H2CO (3–2) is sensitive to gas temperature at density 105 cm−3 (Ginsburg et al. 2016; Immer et al. 2016; Tang et al. 2017b). The spatial density measured with para-H2CO (303–202) and C18O (2–1) in N113 and N159W is n(H2) ~ 105 cm−3 on a size of ~30″ (Tang et al. 2017b). Therefore, here we adopt 105 cm−3 as an averaged spatial gas density in the N113 and N159W regions.
We use the relation between kinetic temperature and para-H2CO line ratios at averaged spatial density 105 cm−3 and averaged column densities of N113 and N159W (shown in Fig. 5) to convert ratio maps to temperaturemaps in Figs. 3 and 4. The gas kinetic temperatures derived from the para-H2CO line ratios are warm at density n(H2) = 105 cm−3, ranging from 28 to 105 K in N113 and from 29 to 68 K in N159W on a scale of ~0.4 pc (see also Table 3). It seems that higher temperatures (Tkin ≳ 50 K) associate with dense clumps, YSOs (or YSO candidates), and/or H2O masers in N113 and N159W (see Figs. 3 and 4). Gas with lower temperatures (Tkin < 50 K) is located at the outskirts of the H2CO distributions of both N113 and N159W. The kinetic temperatures of the dense gas are high (Tkin = 44–96 K) in the dense H2CO clumps (see Table 2), which is consistent with previous observational results measured with para-H2CO (J = 3–2 and 4–3) from dense clumps representing various evolutionary stages of high-mass star formation in the Galactic plane (Tang et al. 2018b). The gas kinetic temperatures show apparent gradients in these dense H2CO clumps of N113 and N159W (e.g., clumps 2, 3, 4, 5, and 7 in N113 and clumps 1, 4, and 6 in N159W; see Figs. 3 and 4) on a clump scale of ~1 pc.
As mentioned in Sect. 2.1, the dense gas kinetic temperatures in N113 and N159W have been estimated with the same transitions of para-H2CO (J = 3–2) observed by the APEX 12-m telescope (beam size ~30″; Tang et al. 2017b). For a comparison with the lower resolution APEX data, we have therefore averaged our data for areas, where the presence of the dense gas shown in Figs. 3 and 4 could be identified by the para-H2CO 303–202 line. The averaged temperatures are 48 and 36 K in N113 and N159W, respectively, which are consistent with previous results in N113 (54 ± 7 K) and N159W (35 ± 4 K) obtained with the single-dish observations (Tang et al. 2017b).
Previous observations toward the Galactic central molecular zone (CMZ) clouds and dense massive star-forming clumps in the Galactic plane show that the opacities of para-H2CO (J = 3–2) lines influence only weakly the measurements of gas kinetic temperature (Ginsburg et al. 2016; Immer et al. 2016; Tang et al. 2018b). Nevertheless, a major caveat in our discussion are the poorly known opacities of para-H2CO (J=3–2) lines in N113 and N159W. While the para-H2CO 322–221 and 321 –220 lines, being much weaker than the 303 –202 line, appear to be optically thin, this is not necessarily the case for our strongest emitter, the 303 –202 transition. If this line were optically thick in the molecular cores we have observed, line ratios would be too close to unity, and we would overestimate, relative to the optically thin case, the para-H2CO 0.5 × [(322–221 + 321–220)/303–202] intensity ratios and kinetic temperatures. This implies that in case of saturation we would obtain upper limits to the kinetic temperature only. This could easily mimic the high temperatures in the cores and the lower temperatures in the optically thin outskirts of the N113 and N159W clouds, we have mentioned above, possibly providing a good agreement with the low kinetic temperature derived from ammonia (beam size 18.′′ 6 × 15.′′7; Ott et al. 2010), since the gas traced by ammonia presumably resides in a well shielded highly obscured cloud core.
A first estimate of optical depth can be attained by a comparison of para-H2CO 303–202 main beam brightness temperatures with the temperatures derived from the dust and from the line temperature ratios. On our 0.4 pc scale, observed main beam brightness temperatures should be close to the real brightness temperatures of the emission (e.g., Tang et al. 2018a), which should reach values of order of 16 K (the Tkin value from the NH3(2,2)/(1,1) line ratio; Ott et al. 2010) or higher to reveal strong indications of saturation. Converting with Tmb = S×λ2/(2.65 ×θb2) (Tmb: main beam brightness temperaturein units of K; S: flux density in units of Jy; λ: wavelength in units of cm; θb: our beam size in units of arcmin) the flux density scale into units of main beam brightness temperature and accounting for typical total linewidths of ~4.0 km s−1 in case of N113 and N159W (see Table 2), we obtain peak temperatures of only ~2.5 K. This is well below the low ammonia temperature from Ott et al. (2010) and indicates either highly subthermal excitation with potentially saturated para-H2CO 303–202 line emission or a purely optically thin scenario.
To discriminate between these two possibilities, we used again the RADEX non-LTE program (van der Tak et al. 2007). Setting Tkin to 16 K, thelow value derived by Ott et al. (2010) from ammonia, and a linewidth of 3 km s−1 we can reproduce the Tmb (H2CO 303–202) line intensity of ~2.5 K with N(para-H2CO) = 1.4 × 1014 cm−2, but the resulting para-H2CO 0.5 × [(322–221 + 321–220)/303–202] line ratio is ~0.04, far below and thus inconsistent with the obtained data. At Tkin ~ 50 K, however, N(para-H2CO) ~5 × 1013 cm−2 leads to Tmb (H2CO 303–202) ~ 2.5 K and line ratios of order 0.23–0.24. In this case the para-H2CO 303–202 line is slightly optically thick (τ ~ 1.1), while the weaker 322 –221 and 321 –220 transitions are characterized by τ ~ 0.3. Compared to the optically thin case shown by Fig. 5, this leads to a slight overestimate of Tkin. Adopting the optically thin scenario, line ratios of 0.25–0.30 lead to kinetic temperatures of 55–70 K instead of the 50 K adopted in the non-LTE model also accounting for line saturation effects. Interestingly, even H2CO 303–202 line opacities of order 5–10 do not lead to larger inaccuracies (see Fig. G. 2 in Immer et al. 2016). While increasing line saturation has a tendency to yield line intensity ratios closer to unity, this trend is not seen in this case because excitation temperatures of the H2CO 322–221 and 321 –220 transitions are then significantly below that of the H2CO 303–202 transition. To summarize, while our Tkin values toward the cloud cores might be overestimated, they are not grossly overestimated and still clearly favor values well in excess of the 16 K derived from ammonia.
In Galactic dense massive star-forming clumps, the para-H2CO 303–202 line tends to be optically thin (Tang et al. 2018b). Since dust is less prevalent in the LMC than in the Galaxy (e.g., Wang et al. 2009) leading to reduced shielding, we may see denser regions with H2CO in the LMCthan in the Galaxy, again not supporting the highly subthermal low kinetic temperature excitation scenario mentioned above. On the other hand, N113 and N159W are the most intense star-forming regions of the LMC (e.g., Wang et al. 2009; Lee et al. 2016), which may yield particularly large H2CO column densities. The peak column densities N(para-H2CO) obtained from the para-H2CO (303–202) brightness temperatures of dense H2CO clumps in N113 and N159W (see Table 2) using the method of Tang et al. (2017a) range from 0.7 to 9.0 × 1013 cm−2 with an average of ~4.0 × 1013 cm−2 at a density of 105 cm−3 and from 0.3 to 3.8 × 1013 cm−2 with an average of ~1.4 × 1013 cm−2 at a density of 106 cm−3, which are a few times higher than averaged results obtained from entire regions with the APEX telescope (Tang et al. 2017b).
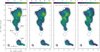 |
Fig. 3 Left two panels: averaged velocity-integrated intensity ratio map of para-H2CO 0.5 × [(322–221 + 321–220)/303–202] in N113. Thekinetic temperatures derived from the para-H2CO (3–2) line ratios (color bar in units of Kelvin). Right two panels: maps of non thermal velocity dispersion (color bar in units of km s−1) and Mach number. Black contours show levels of integrated intensity of the para-H2CO (303–202) line (see Fig.1). Offsets are relative to our reference position for N113 (see Fig. 1). The pixel size of each image is 0.′′2 × 0.′′2. The beam size of each image is shown in the lower left corner. Stars and triangles show the locations of YSOs (or YSO candidates) and H2O masers (Chen et al. 2010; Ellingsen et al. 2010; Carlson et al. 2012), respectively. |
Parameters of H2CO clumps derived from N113 and N159W.
Thermal and non thermal parameters derived from N113 and N159W.
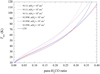 |
Fig. 5 RADEX non-LTE (red and blue lines) and LTE (black line) modeling of the relation between kinetic temperature and average ratio of para-H2CO 322–221/303–202 and 321 –220/303–202 with spatial densities of n(H2) = 104, 105, and 106 cm−3 (dashed,solid, and dotted lines, respectively), an averaged observed linewidth of 4.0 km s−1, and column densities of N(para-H2CO) = 2.7 × 10¹² and 3.7 × 1012 cm−2 for N113 (red lines) and N159W (blue lines) (Tang et al. 2017b), respectively. Tkin -Ratio(H2CO) relations for N113 and N159W at density 104 cm−3 are nearly the same, which is similar to the situation at 106 cm−3. |
3.5 Thermal and non thermal motions
Using the kinetic temperatures derived from the para-H2CO line ratios, we can derive thermal and non thermal linewidths, that is  and
and  , where k is the Boltzmann constant, Tkin is the kinetic temperature of the gas,
  is the mass of the formaldehyde molecule, and Δv is the measured FWHM linewidth of para-H2CO 303–202 (Pan & Padoan 2009). Thermal and non thermal linewidth ranges are listed in Table 3. Thermal and non thermal linewidths of the individual dense clumps are given in Table 2. The thermal linewidth is significantly smaller than the non thermal linewidth in N113 and N159W, which indicates that the dense gas traced by para-H2CO is dominated by non thermal motions. This agrees with previous measurements derived from para-H2CO (3–2 and 4–3) in the Galactic star-forming region OMC-1 and massive clumps of the Galactic disk (Tang et al. 2017a, 2018a,b). Distributions of the non thermal linewidth in N113 and N159W are shown in Figs. 3 and 4, respectively. They may suggest that the higher non thermal linewidths (σNT > 1.5 km s−1) associate with the dense clumps and the lower non thermal linewidths (σNT ≲ 1.5) are located in the outskirts of the dense clumps in our two massive star-forming regions, indicating that the dense gas traced by para-H2CO is strongly influenced by star-forming activity.
Distributions of the Mach number ( , where cs =
 is the sound speed, μ = 2.37 is the mean molecular weight for molecular clouds, and mH is the mass of the hydrogen atom) in N113 and N159W are shown in Figs. 3 and 4, right panels, respectively. The Mach numbers of the individual dense clumps in N113 and N159W are listed inTable 2. The Mach numbers range from 2.3 to 6.2 with an average of 4.2 ± 0.1 in N113 and from 1.6 to 8.3 with an average of 4.5 ± 0.1 in N159W (see also Table 3). This suggests that supersonic non thermal motions (e.g., turbulence, outflows, shocks, and/or magnetic fields) are dominant in the dense gas traced by H2CO. Locations that are situated in the outskirts of the clumps of N113 and in the outer regions of the northern clumps of N159W (see Figs. 3 and 4), have low Mach numbers (
 ≲ 3.5). The distribution of Mach numbers may suggest apparent gradients from southeast to northwest along clumps 5 and 6 of N159W (see Fig. 4). Meanwhile, there is a YSO (or YSO candidate) located in the eastern region of these clumps. This may imply that dense gas probed by para-H2CO may be influenced by this YSO (or YSO candidate). Higher Mach numbers (
 > 3.5) are associated with the dense clumps in N113 and N159W, again suggesting that dense gas traced by H2CO is strongly influenced by non thermal motions (e.g., outflows and shocks) in these regions. The averaged Mach numbers in N113 and N159W are consistent with previous observational results in Galactic massive clumps on scales of ~0.1–1.8 pc (mean value ~4.2 obtained from para-H2CO (3–2 and 4–3); Tang et al. 2018b), but are higher than the values measured with the same transitions of para-H2CO (3–2) in OMC-1 on a scale of ~0.06 pc (mean value ~2.3; Tang et al. 2018a). We have smoothed the OMC-1 para-H2CO (3–2) data to a linear resolution of 0.4 pc. The derived Mach numbers are 3.0 and 3.5 in the Orion KL and Orion South regions, respectively, which is still slightly lower than the values in N113 and N159W.
One should note that para-H2CO (303–202) linewidths in the northern edges of clump 1 and 2 of N113 and in the outskirts of clump 1 and 4 of N159W are narrow <3.0 km s−1 (see Figs. 2, 3, and 4), which is corresponding to only 2–3 channels of our H2CO data. Furthermore, there are two velocity components around clump 1 of N113 and in the northern region of the clump 4 of N159W (see Figs. A.1 and A.2). For two velocity components the typical linewidths are ~2–3 and ~4–6 km s−1 in these regions of N113 and N159W. Our observational set can not well identify the velocity components with narrow linewidths using Gaussian profiles in these regions. Therefore, the non thermal linewidths and the Mach numbers are likely overestimated in these regions. For the locations with two velocity components in N113 and N159W, the non thermal linewidths and the Mach number are weighted with para-H2CO (303–202) integrated intensity in Figs. 3 and 4.
4 Discussion
4.1 Comparison of temperatures obtained from H2CO, CO, and NH3
Observations of CO J = 1–0 to 3–2 indicate that the molecular gas traced by CO in lower density regions (n(H2) < 105 cm−3) may be strongly influenced by the external FUV emission irradiating giant molecular clouds of the LMC on a scale of ~10 pc (Minamidani et al. 2008, 2011). The physical and chemical processes in these regions such as formation and destruction of molecules as well as ionization are dominated by the intense FUV field, which has been modeled as PDRs (e.g., Kaufman et al. 1999; Minamidani et al. 2011; Lee et al. 2016, 2019). The gas temperature is Tkin > 150 K at densities ~103 cm−3 derived from multitransition data of CO in N159W on a scale of ~10 pc (Lee et al. 2016). Our results determined from para-H2CO line ratios range from 29 to 68 K with anaverage of 47.6 ± 0.3 K at density 105 cm−3 on a scale of0.4 pc (see Table 3), which are much lower than values obtained from CO at lower density and even may have to be slightly modified to the lower side to account for moderate saturation effects (see Sect. 3.4). This indicates that para-H2CO and CO trace different kinetic temperature layers in N159W. There is no available gas temperature derived from multitransition data of CO in N113, so we can not compare it with our para-H2CO results.
We did not find any evidence for the low Tkin value (~16 K) determined from the NH3 (2,2)/(1,1) line ratio by Ott et al. (2010). This is interpreted in terms of a highly embedded extremely obscured dense molecular gas component, which we do not see in H2CO. A similar situation has also been encountered in M 82 (Weiß et al. 2001; Mühle et al. 2007), where ammonia suggests Tkin ~ 60 K, while H2CO represents gas with temperatures well in excess of 100 K. We get moderately high Tkin values derived from H2CO in the cores but Ott et al. (2010) obtain a low Tkin value determined from NH3, presumably also from a core. Ammonia has a particularly low energy threshold for photodissociation (~4.1 eV; Weiß et al. 2001). Low metallicity environments with low nitrogen abundance and strong UV radiation (e.g., Westerlund 1990; Chin et al. 1997; Rolleston et al. 2002; Wang et al. 2009; Ott et al. 2010) in the LMC may allow ammonia to survive only in the most UV-shielded regions, leading to a low fractional NH3 abundance and a low kinetic temperature of the NH3 emitting gas (Tang et al. 2017b). It could be explained in the sense, that NH3 is only there, where no protostar has yet heated its environment. In the outskirts, Tkin values from H2CO are low, but CO suggests that there temperatures are high. This might be explained by the idea that even the H2CO outskirts are far inside the volume of the CO emitting gas.
4.2 Radiative heating
We compare para-H2CO (303–202) integrated intensity distributions with the Hα emission (observed with the UM/CTIO Curtis Schmidt telescope; Smith & MCELS Team 1998), Spitzer 8.0 μm (Meixner et al. 2006), and 1.3 mm continuum (observed with ALMA Band 6; Fukui et al. 2015; Sewiło et al. 2018) emission of N113 and N159W in Fig. 6. Obviously, the spatial distributions of para-H2CO (303–202) and Hα emission are not well correlated in the two massive star-forming regions. This suggests that dense gas traced by para-H2CO may only be weakly affected by the stars exciting the Hα emission in N113 and N159W. Such offsets between molecular and Hα emissions are seen in evolved systems (e.g., Fukui & Kawamura 2010), where newly formed massive stars have already dispersed a part of the original molecular gas. The para-H2CO (303–202) integrated intensity distributions agree much better with the Spitzer 8.0 μm emission excited by young massive stars in the N113 and N159W regions (see Fig. 6). The para-H2CO (303–202) integrated intensity distribution agrees best with the 1.3 mm continuum emission in N113 and N159W, including the dense molecular structure and dust emission peaks (see Fig. 6), which implies that H2CO associates with the dense gas traced by the dust emission. This is consistent with previous observational results in our Galactic massive star-forming regions at various evolutionary stages (Immer et al. 2014; Tang et al. 2017a, 2018a,b).
As mentioned, there is no spatial correlation between the dense gas traced by para-H2CO and the Hα distributions in N113 and N159W (see Fig. 6). There also appears to be no significant correlation between the gas temperature structures derived from para-H2CO line ratios and the Hα emission distribution in these two regions (Figs. 3, 4, and 6). These findings indicate that dense gas traced by H2CO is weakly affected by the external FUV radiation in N113 and N159W. The dense molecular gas (≳105 cm−3) may be effectively shielded by the lower density molecular gas envelopes in the massive star-forming regions of the LMC.
Previous observations of e.g., H2CO, NH3, CH3CN, CH3CCH, or CH3OH in Galactic massive star-forming regions (Lu et al. 2014; Giannetti et al. 2017; Tang et al. 2018a,b; Gieser et al. 2021) suggest internal radiative heating of embedded infrared sources of their surrounding dense gas. Present observations of H2CO in massive star-forming regions of the LMC imply that the kinetic temperatures traced by para-H2CO (3–2) transitions in dense regions (~105 cm−3) are correlated with the ongoing massive star formation (Tang et al. 2017b). As mentioned in Sect. 3.4, it appears that high gas temperatures obtained from para-H2CO line ratios associate with dense clumps, YSOs (or YSO candidates), and/or H2O masers in N113 andN159W regions (see Figs. 3 and 4). This indicates that the warm dense gas traced by para-H2CO is influenced by radiation from internal embedded infrared sources and/or nearby YSOs in the low-metallicity environment of the LMC.
We determine the gas temperature in regions heated by YSOs following the modified Stefan-Boltzmann blackbody radiation law, adjusting the emissivity of dust grains smaller than the wavelength at the characteristic blackbody temperature (Wiseman & Ho 1998; Tang et al. 2018a),
 (1)
(1)
where the luminosity L is in L⊙ and the distance R is in parsecs. Four YSOs (or YSO candidates) with luminosities of 0.16, 0.82, 1.26, and 2.40 × 10⁵ L⊙ are found in N113 and N159W (Chen et al. 2010; Sewiło et al. 2010; Carlson et al. 2012). Assuming these YSOs (or YSO candidates) are the dominant sources at their locations, the derived gas temperatures at radii of 0.2, 0.4, and 1.0 pc from Eq. (1) are listed in Table 4. Measured gas temperatures around the four young stellar objects or candidates derived from para-H2CO line ratios are also listed in Table 4, which agrees well with the results obtained from the radiation law at a radius of 0.2 pc. This indicates that dense gas traced by H2CO is significantly influenced by radiation from YSOs (or YSO candidates). One should note that the distances among YSOs (or YSO candidates), H2O masers, and 1.3 mm dust emission peaks are approximately ~1 pc in the N113and N159W regions (see Figs. 3, 4, and 6). It also shows that the YSO’s radiation heating could contribute to a gas temperature (e.g., Tkin ~ 19 K for the lowest luminosity YSO (or candidate) with L = 1.6 × 10⁴ L⊙; see Table 4) even far out, at a radius of 1 pc. This implies that the complex temperature structure of the dense gas in N113 and N159W regions may be also affected by multiple YSOs and/or embedded infrared sources. For large areas of N113 and N159W the Hα radiation regions and the general stellar radiation field may also contribute to the temperature of the dense gas.
Due to the limited spatial resolution (~0.4 pc) of the ALMA data and our limited 2-dimensional perspective, the relation between gas temperature and distance from YSOs is not perfectly revealed. A follow-up sub arcsecond angular resolution (corresponding to ≲ 0.1 pc) mapping study of the massive star-forming clump’s temperature structure with H2CO in the LMC will be indispensable and meaningful in the future.
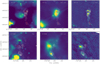 |
Fig. 6 Para-H2CO (303 –202) with integrated intensity contours (same as Fig. 1) overlaid on Hα (left panels; Smith & MCELS Team 1998), Spitzer 8.0 μm (middle panels; Meixner et al. 2006), and 1.3 mm continuum (right panels; observed with ALMA Band 6; Fukui et al. 2015; Sewiło et al. 2018) images of N113 (top panels) and N159W (bottom panels). Stars and triangles show the locations of the YSOs (or YSO candidates) and H2O masers (Chen et al. 2010; Ellingsen et al. 2010; Carlson et al. 2012), respectively. |
Gas temperatures at different radius around the young stellar objects or candidates.
4.3 Turbulent heating
Turbulent heating seems to be widespread in Galactic massive star-forming regions on a ~0.1–1.8 pc scale (Tang et al. 2018a,b). It may play an important role in heating the dense gas in star-forming regions. Present observations toward Galactic CMZ clouds with para-H2CO (3–2 and 4–3) show that the warm dense gas is heated most likely by turbulence on a scale of ~1 pc (Ao et al. 2013; Ginsburg et al. 2016; Immer et al. 2016). Observations of, e.g., H2CO, NH3, and CH3CCH in Galactic star formation regions suggest that the linewidth is correlated with gas kinetic temperature (Wouterloot et al. 1988; Molinari et al. 1996; Jijina et al. 1999; Wu et al. 2006; Urquhart et al. 2011, 2015; Wienen et al. 2012; Lu et al. 2014; Tang et al. 2017a, 2018a,b; Giannetti et al. 2017). Correlations between the kinetic temperature and linewidth are expected in the case of conversion of turbulent energy into heat (Güsten et al. 1985; Molinari et al. 1996; Ginsburg et al. 2016).
We examine whether there is a relationship between the turbulence and the gas temperature derived from the para-H2CO line ratio on a ~0.4 pc scale in N113. As discussed in Sect. 3.5, our observational sets have low channel width (~1.34 km s−1) for para-H2CO data, which strongly affects the estimation of para-H2CO linewidths in the N159W region, but weakly influences the N113 region which has wider linewidths. Therefore, we did not examine this relationship in N159W. We adopt the non thermal velocity dispersion (σNT) of para-H2CO (303–202) in good approximation as proxy for the turbulence, and the kinetic temperature derived from the para-H2CO line ratio asthe gas kinetic temperature. We select positions with strong non thermal motions ( ≳ 3.5) located nearthe dense clumps (see Figs. 3 and 4). The relation between kinetic temperature and non thermalvelocity dispersion is shown in Fig. 7. It indicates that the non thermal velocity dispersion of para-H2CO is positivelycorrelated with the gas kinetic temperatures, by a power-law of the form
  with a correlation coefficients R of 0.78, which agrees with results from Galactic massive star-forming regions (
 ; gas kinetic temperature measured with para-H2CO 3–2 and 4–3 line ratios; Tang et al. 2018a,b). The intercept and absolute values of the Tkin–σNT(H2CO) relation in N113 are also consistent with previous results from Galactic massive star-forming regions on scales of ~0.1–1.8 pc (Tang et al. 2018a,b). These imply that the higher temperature traced by para-H2CO is related to higher turbulence on a scale of ~0.4 pc. To our knowledge, this is the first evidence for dense gas heated in a star-forming region of the LMC by turbulence. Our Tkin–σNT(H2CO) relation agrees with previous observational results (
 ; gas kinetic temperature measured with NH3 and H2CO) in molecular clouds of the Galactic center (Güsten et al. 1985; Mauersberger et al. 1987; Immer et al. 2016), only in terms of slope, not of intercept and absolute value.
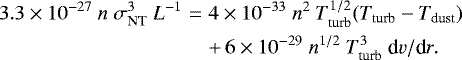
We derived the gas kinetic temperature, Tturb, assuming turbulent heating is the dominant heating process of the molecular gas in N113 and N159W, following the method applied by Tang et al. (2018a) in their Eq. (2),
 (2)
(2)
The gas density n is in units of cm−3, the velocity gradient dv/dr is in units of km s−1pc−1, the one-dimensional non thermal velocity dispersion σNT is in units of km s−1, and the cloud size L is in units of pc, and the temperatures Tturb and Tdust are in K. We assume a cloud size of ~1 pc (see Fig. 1), a typical velocity gradient of 1 km s−1 pc−1, a measured para-H2CO (303–202) non thermalvelocity dispersion (see Table 2, Col. 5), and an averaged gas spatial density n(H2) = 105 cm−3 (Tang et al. 2017b). Previous observations have shown that the gas kinetic temperatures derived from para-H2CO (3–2) line ratios and the dust temperatures obtained from Herschel data are in good agreement in the dense star-formingregions of the LMC (Tang et al. 2017b), so here we adopt the gas temperatures obtained from our H2CO line ratios as the dust temperatures. The derived gas kinetic temperatures Tturb are listed in Table 2. It seems that the derived Tturb values are reasonably well consistent with the gas kinetic temperatures Tkin(H2CO) obtained from our H2CO line ratios. This indicates that turbulent heating contributes to the gas temperature on a scale of ~0.4 pc. As discussed in Sect. 4.2, gas in these dense clumps is also affected by internal star formation activity and/or nearby YSOs. Therefore, turbulent heating may play an important role in heating the dense gas in the star-forming regions of N113 and N159W.
Observations of the transitions of the para-H2CO (3–2) lines with the APEX 12 m telescope in the Galactic star-forming region OMC-1 (~1.1×1.7 pc2) on a scale of ~0.06 pc suggest complex gas heating which is most likely due to a number of different processes, e.g., star formation activity, radiation, and turbulence (Tang et al. 2018a). Further observations of para-H2CO (3–2 and 4–3) toward dense clumps representing various evolutionary stages of high-mass star formation in the Galactic plane on scales of ~0.1–1.8 pc indicate similar gas heating processes for the dense gas (Tang et al. 2018b). Our observations reveal also similar gas heating mechanisms in a relatively large area of N113 (~2.4 × 6.1 pc2) and N159W (~3.6 × 5.1 pc2) on a scale of ~0.4 pc in the LMC. These imply that the gas heating for the dense gas of star-forming regions in low metallicity environments with strong UV radiation in the LMC may be dominated by internal star formation activity, radiation, and/or turbulence. The physical and chemical processes of dense gas on a scale of ~0.4 pc in star-forming regions of the LMC might be different from those in low density regions (n(H2) < 105 cm−3), so the very dense gas clouds should not be simply modeled as PDRs in low metallicity environments.
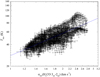 |
Fig. 7 Non thermal velocity dispersion (σNT) vs. gas kinetic temperature derived from the para-H2CO line ratio for locations (pixels) with the Mach number |

5 Summary
We have mapped the kinetic temperature structures of two star formation regions, N113 and N159W, in the LMC in the para-H2CO  = 303–202, 322 –221, and 321 –220 lines using ALMA Band 6. The main results are the following:
- 1.
There is no significant correlation between the spatial distributions of the dense gas traced by para-H2CO and Hα emission in N113 and N159W. However, the integrated intensity distributions of para-H2CO are similar to those of the 1.3 mm dust emission in N113 and N159W, indicating that the H2CO emission associates well with dense gas traced by the emission of the cold dust. There is also some agreement with the Spitzer 8.0 μm emission in N113 and N159W, which suggests that dense gas traced by para-H2CO associates with massive star-forming regions.
- 2.
Using the RADEX non-LTE program, we derive the gas kinetic temperature by modeling the measured para-H2CO 0.5×[(322–221+321–220)/303–202] line ratios. The gas kinetic temperatures derived from para-H2CO line ratios are warm at a spatial density of 105 cm−3, ranging from 28 to 105 K in N113 and 29 to 68 K in N159W. The aforementioned upper bounds to the kinetic temperature, arising from the cores, may be affected by moderate line saturation and thus may be slightly overestimated.
- 3.
The highkinetic temperatures (Tkin ≳ 50 K) of the dense gas traced by para-H2CO appear to be correlated with the internal embedded infrared sources and/or YSOs in the N113 and N159W regions. The lower temperatures (Tkin < 50 K) are located at the outskirts of the H2CO distributions of both N113 and N159W. The gas kinetic temperatures show apparent gradients in some dense H2CO clumps of N113 and N159W.
- 4.
The kinetic temperatures of the dense gas traced by para-H2CO appear to be only weakly affected by the external FUV radiation.
- 5.
The non thermal velocity dispersions of para-H2CO are correlated with the gas kinetic temperatures in N113, implying that higher temperatures traced by para-H2CO are related to turbulence on a ~0.4 pc scale.
- 6.
In the LMC, the gas heating for the dense gas may be dominated by internal star formation activity, radiation, and/or turbulence in star-forming regions with low metallicity environments, which is consistent with our Galactic massive star-forming regions located in the Galactic plane.
The kinetic temperature of the molecular gas is a fundamental parameter to understand the interstellar medium. The Large Magellanic Cloud provides an ideal site for studying interstellar medium and star formation in low metallicity environments. It will be the focus of future studies with ALMA to extend the use of formaldehyde as a thermometer for a larger number of star forming regions in the LMC.
Acknowledgements
The authors thank the anonymous referee for helpful comments. This work acknowledges support by the Heaven Lake Hundred-Talent Program of Xinjiang Uygur Autonomous Region of China, the National Natural Science Foundation of China under Grant 11903070, 12173075, 11433008, and 11973076, the “TianShan Youth Plan” under Grant 2018Q084, the CAS “Light of West China” Program under Grant Nos. 2018-XBQNXZ-B-024 and 2020-XBQNXZ-017, and the Collaborative Research Council 956, subproject A6, funded by the Deutsche Forschungsgemeinschaft (DFG). C.H. acknowledges support by Chinese Academy of Sciences President’s International Fellowship Initiative under Grant No. 2021VMA0009. This paper makes use of the following ALMA data: ADS/JAO.ALMA#2012.1.00554.S, 2013.1.01136.S, and 2015.1.01388.S. ALMA is a partnership of ESO (representing its member states), NSF (USA) and NINS (Japan), together with NRC (Canada), NSC and ASIAA (Taiwan), and KASI (Republic of Korea), in cooperation with the Republic of Chile. The Joint ALMA Observatory is operated by ESO, AUI/NRAO and NAOJ. This research has used NASA’s Astrophysical Data System (ADS).
Appendix A H2CO velocity channel maps
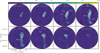 |
Fig. A.1 Para-H2CO 303–202 channel maps of N113. The contour levels are from 10% to 100% with steps of 10% of the peak intensity (0.25 Jy beam−1; color bar in units of Jy beam−1). The centers of the fields are given in Fig. 1. Angular scales of 4″ correspond to a linear scale of ~1 pc. No primary beam correction has been applied. |
References
- Ao, Y., Henkel, C., Menten, K. M., et al. 2013, A&A, 550, A135 [NASA ADS] [CrossRef] [EDP Sciences] [Google Scholar]
- Bergman, P., Parise, B., Liseau, R., & Larsson, B. 2011, A&A, 527, A39 [NASA ADS] [CrossRef] [EDP Sciences] [Google Scholar]
- Bieging, J. H., Wilson, T. L., & Downes, D. 1982, A&AS, 49, 607 [NASA ADS] [Google Scholar]
- Carlson, L. R., Sewiło, M., Meixner, M., Romita, K. A., & Lawton, B. 2012, A&A, 542, A66 [NASA ADS] [CrossRef] [EDP Sciences] [Google Scholar]
- Caselli, P., Hasegawa, T. I., & Herbst, E. 1993, ApJ, 408, 548 [Google Scholar]
- Chen, C. H. R., Indebetouw, R., Chu, Y.-H., et al. 2010, ApJ, 721, 1206 [NASA ADS] [CrossRef] [Google Scholar]
- Chin, Y. N., Henkel, C., Millar, T. J., Whiteoak, J. B., & Mauersberger, R. 1996, A&A, 312, L33 [Google Scholar]
- Chin, Y. N., Henkel, C., Whiteoak, J. B., et al. 1997, A&A, 317, 548 [Google Scholar]
- Downes, D., Wilson, T. L., Bieging, J., & Wink, J. 1980, A&AS, 40, 379 [NASA ADS] [Google Scholar]
- Ellingsen, S. P., Breen, S. L., Caswell, J. L., Quinn, L. J., & Fuller, G. A. 2010, MNRAS, 404, 779 [NASA ADS] [CrossRef] [Google Scholar]
- Fariña, C., Bosch, G. L., Morrell, N. I., Barbá, R. H., & Walborn, N. R. 2009, AJ, 138, 510 [CrossRef] [Google Scholar]
- Fukui, Y., & Kawamura, A. 2010, ARA&A, 48, 547 [NASA ADS] [CrossRef] [Google Scholar]
- Fukui, Y., Mizuno, N., Yamaguchi, R., et al. 1999, PASJ, 51, 745 [Google Scholar]
- Fukui, Y., Harada, R., Tokuda, K., et al. 2015, ApJ, 807, L4 [NASA ADS] [CrossRef] [Google Scholar]
- Gao, Y., & Solomon, P. M. 2004a, ApJ, 606, 271 [NASA ADS] [CrossRef] [Google Scholar]
- Gao, Y., & Solomon, P. M. 2004b, ApJS, 152, 63 [Google Scholar]
- Gerner, T., Beuther, H., Semenov, D., et al. 2014, A&A, 563, A97 [NASA ADS] [CrossRef] [EDP Sciences] [Google Scholar]
- Giannetti, A., Leurini, S., Wyrowski, F., et al. 2017, A&A, 603, A33 [NASA ADS] [CrossRef] [EDP Sciences] [Google Scholar]
- Gieser, C., Beuther, H., Semenov, D., et al. 2021, A&A, 648, A66 [EDP Sciences] [Google Scholar]
- Ginsburg, A., Darling, J., Battersby, C., Zeiger, B., & Bally, J. 2011, ApJ, 736, 149 [NASA ADS] [CrossRef] [Google Scholar]
- Ginsburg, A., Bally, J., Battersby, C., et al. 2015, A&A, 573, A106 [NASA ADS] [CrossRef] [EDP Sciences] [Google Scholar]
- Ginsburg, A., Henkel, C., Ao, Y., et al. 2016, A&A, 586, A50 [NASA ADS] [CrossRef] [EDP Sciences] [Google Scholar]
- Ginsburg, A., Goddi, C., Kruijssen, J. M. D., et al. 2017, ApJ, 842, 92 [Google Scholar]
- Guo, W. H., Esimbek, J., Tang, X. D., et al. 2016, Ap&SS, 361, 264 [NASA ADS] [CrossRef] [Google Scholar]
- Güsten, R., Walmsley, C. M., Ungerechts, H., & Churchwell, E. 1985, A&A, 142, 381 [Google Scholar]
- Heikkilä, A., Johansson, L. E. B., & Olofsson, H. 1998, A&A, 332, 493 [Google Scholar]
- Heikkilä, A., Johansson, L. E. B., & Olofsson, H. 1999, A&A, 344, 817 [NASA ADS] [Google Scholar]
- Henkel, C., Walmsley, C. M., & Wilson, T. L. 1980, A&A, 82, 41 [NASA ADS] [Google Scholar]
- Henkel, C., Wilson, T. L., Walmsley, C. M., & Pauls, T. 1983, A&A, 127, 388 [NASA ADS] [Google Scholar]
- Henkel, C., Baan, W. A., & Mauersberger, R. 1991, A&A Rev., 3, 47 [CrossRef] [Google Scholar]
- Henkel, C., Mühle, S., Bendo, G., et al. 2018, A&A, 615, A155 [NASA ADS] [CrossRef] [EDP Sciences] [Google Scholar]
- Hidaka, H., Watanabe, N., Shiraki, T., Nagaoka, A., & Kouchi, A. 2004, ApJ, 614, 1124 [Google Scholar]
- Immer, K., Galván-Madrid, R., König, C., Liu, H. B., & Menten, K. M. 2014, A&A, 572, A63 [NASA ADS] [CrossRef] [EDP Sciences] [Google Scholar]
- Immer, K., Kauffmann, J., Pillai, T., Ginsburg, A., & Menten, K. M. 2016, A&A, 595, A94 [NASA ADS] [CrossRef] [EDP Sciences] [Google Scholar]
- Jijina, J., Myers, P. C., & Adams, F. C. 1999, ApJS, 125, 161 [Google Scholar]
- Johansson, L. E. B., Olofsson, H., Hjalmarson, A., Gredel, R., & Black, J. H. 1994, A&A, 291, 89 [NASA ADS] [Google Scholar]
- Johnstone, D., Boonman, A. M. S., & van Dishoeck, E. F. 2003, A&A, 412, 157 [NASA ADS] [CrossRef] [EDP Sciences] [Google Scholar]
- Jones, T. J., Woodward, C. E., Boyer, M. L., Gehrz, R. D., & Polomski, E. 2005, ApJ, 620, 731 [CrossRef] [Google Scholar]
- Kaufman, M. J., Wolfire, M. G., Hollenbach, D. J., & Luhman, M. L. 1999, ApJ, 527, 795 [Google Scholar]
- Kennicutt, Robert C., J. 1998a, ApJ, 498, 541 [NASA ADS] [CrossRef] [Google Scholar]
- Kennicutt, Robert C., J. 1998b, ARA&A, 36, 189 [Google Scholar]
- Klessen, R. S., Spaans, M., & Jappsen, A.-K. 2007, MNRAS, 374, L29 [NASA ADS] [CrossRef] [Google Scholar]
- Lee, M. Y., Madden, S. C., Lebouteiller, V., et al. 2016, A&A, 596, A85 [NASA ADS] [CrossRef] [EDP Sciences] [Google Scholar]
- Lee, M. Y., Madden, S. C., Le Petit, F., et al. 2019, A&A, 628, A113 [EDP Sciences] [Google Scholar]
- Li, F., Wang, J., Gao, F., et al. 2021, MNRAS, 503, 4508 [NASA ADS] [CrossRef] [Google Scholar]
- Lindberg, J. E., & Jørgensen, J. K. 2012, A&A, 548, A24 [NASA ADS] [CrossRef] [EDP Sciences] [Google Scholar]
- Lindberg, J. E., Jørgensen, J. K., Watanabe, Y., et al. 2015, A&A, 584, A28 [NASA ADS] [CrossRef] [EDP Sciences] [Google Scholar]
- Liszt, H. S., Lucas, R., & Pety, J. 2006, A&A, 448, 253 [NASA ADS] [CrossRef] [EDP Sciences] [Google Scholar]
- Lu, X., Zhang, Q., Liu, H. B., Wang, J., & Gu, Q. 2014, ApJ, 790, 84 [NASA ADS] [CrossRef] [Google Scholar]
- Lu, X., Zhang, Q., Kauffmann, J., et al. 2017, ApJ, 839, 1 [NASA ADS] [CrossRef] [Google Scholar]
- Lu, X., Li, S., Ginsburg, A., et al. 2021, ApJ, 909, 177 [NASA ADS] [CrossRef] [Google Scholar]
- Mangum, J. G., & Wootten, A. 1993, ApJS, 89, 123 [Google Scholar]
- Mangum, J. G., Wootten, A., Loren, R. B., & Wadiak, E. J. 1990, ApJ, 348, 542 [NASA ADS] [CrossRef] [Google Scholar]
- Mangum, J. G., Wootten, A., & Plambeck, R. L. 1993, ApJ, 409, 282 [Google Scholar]
- Mangum, J. G., Darling, J., Menten, K. M., & Henkel, C. 2008, ApJ, 673, 832 [NASA ADS] [CrossRef] [Google Scholar]
- Mangum, J. G., Darling, J., Henkel, C., & Menten, K. M. 2013, ApJ, 766, 108 [NASA ADS] [CrossRef] [Google Scholar]
- Mangum, J. G., Ginsburg, A. G., Henkel, C., et al. 2019, ApJ, 871, 170 [NASA ADS] [CrossRef] [Google Scholar]
- Mauersberger, R., Henkel, C., & Wilson, T. L. 1987, A&A, 173, 352 [NASA ADS] [Google Scholar]
- Meixner, M., Gordon, K. D., Indebetouw, R., et al. 2006, AJ, 132, 2268 [NASA ADS] [CrossRef] [Google Scholar]
- Minamidani, T., Mizuno, N., Mizuno, Y., et al. 2008, ApJS, 175, 485 [NASA ADS] [CrossRef] [Google Scholar]
- Minamidani, T., Tanaka, T., Mizuno, Y., et al. 2011, AJ, 141, 73 [CrossRef] [Google Scholar]
- Molinari, S., Brand, J., Cesaroni, R., & Palla, F. 1996, A&A, 308, 573 [NASA ADS] [Google Scholar]
- Mühle, S., Seaquist, E. R., & Henkel, C. 2007, ApJ, 671, 1579 [NASA ADS] [CrossRef] [Google Scholar]
- Nishimura, Y., Shimonishi, T., Watanabe, Y., et al. 2016, ApJ, 818, 161 [NASA ADS] [CrossRef] [Google Scholar]
- Ott, J., Henkel, C., Staveley-Smith, L., & Weiß, A. 2010, ApJ, 710, 105 [NASA ADS] [CrossRef] [Google Scholar]
- Pan, L., & Padoan, P. 2009, ApJ, 692, 594 [NASA ADS] [CrossRef] [Google Scholar]
- Papadopoulos, P. P., Thi, W.-F., Miniati, F., & Viti, S. 2011, MNRAS, 414, 1705 [NASA ADS] [CrossRef] [Google Scholar]
- Paron, S., Ortega, M. E., Cunningham, M., et al. 2014, A&A, 572, A56 [NASA ADS] [CrossRef] [EDP Sciences] [Google Scholar]
- Paumard, T., Genzel, R., Martins, F., et al. 2006, ApJ, 643, 1011 [NASA ADS] [CrossRef] [Google Scholar]
- Pietrzyński, G., Graczyk, D., Gieren, W., et al. 2013, Nature, 495, 76 [Google Scholar]
- Pietrzyński, G., Graczyk, D., Gallenne, A., et al. 2019, Nature, 567, 200 [Google Scholar]
- Pineda, J. L., Mizuno, N., Stutzki, J., et al. 2008, A&A, 482, 197 [NASA ADS] [CrossRef] [EDP Sciences] [Google Scholar]
- Rolleston, W. R. J., Trundle, C., & Dufton, P. L. 2002, A&A, 396, 53 [NASA ADS] [CrossRef] [EDP Sciences] [Google Scholar]
- Seale, J. P., Looney, L. W., Wong, T., et al. 2012, ApJ, 751, 42 [NASA ADS] [CrossRef] [Google Scholar]
- Sewiło, M., Indebetouw, R., Carlson, L. R., et al. 2010, A&A, 518, L73 [NASA ADS] [CrossRef] [EDP Sciences] [Google Scholar]
- Sewiło, M., Indebetouw, R., Charnley, S. B., et al. 2018, ApJ, 853, L19 [CrossRef] [Google Scholar]
- Sewiło, M., Charnley, S. B., Schilke, P., et al. 2019, ACS Earth Space Chem., 3, 2088 [Google Scholar]
- Shimonishi, T., Onaka, T., Kawamura, A., & Aikawa, Y. 2016, ApJ, 827, 72 [NASA ADS] [CrossRef] [Google Scholar]
- Shirley, Y. L. 2015, PASP, 127, 299 [Google Scholar]
- Smith, R. C., & MCELS Team 1998, PASA, 15, 163 [NASA ADS] [CrossRef] [Google Scholar]
- Soma, T., Sakai, N., Watanabe, Y., & Yamamoto, S. 2018, ApJ, 854, 116 [Google Scholar]
- Tang, X. D., Esimbek, J., Zhou, J. J., et al. 2013, A&A, 551, A28 [NASA ADS] [CrossRef] [EDP Sciences] [Google Scholar]
- Tang, X. D., Esimbek, J., Zhou, J. J., Wu, G., & Okoh, D. 2014, Res. Astron. Astrophys., 14, 959 [Google Scholar]
- Tang, X. D., Henkel, C., Menten, K. M., et al. 2017a, A&A, 598, A30 [NASA ADS] [CrossRef] [EDP Sciences] [Google Scholar]
- Tang, X. D., Henkel, C., Chen, C. H. R., et al. 2017b, A&A, 600, A16 [NASA ADS] [CrossRef] [EDP Sciences] [Google Scholar]
- Tang, X. D., Henkel, C., Menten, K. M., et al. 2018a, A&A, 609, A16 [NASA ADS] [CrossRef] [EDP Sciences] [Google Scholar]
- Tang, X. D., Henkel, C., Wyrowski, F., et al. 2018b, A&A, 611, A6 [NASA ADS] [CrossRef] [EDP Sciences] [Google Scholar]
- Tang, X. D., Henkel, C., Menten, K. M., et al. 2019, A&A, 629, A6 [NASA ADS] [CrossRef] [EDP Sciences] [Google Scholar]
- Treviño-Morales, S. P., Pilleri, P., Fuente, A., et al. 2014, A&A, 569, A19 [NASA ADS] [CrossRef] [EDP Sciences] [Google Scholar]
- Urquhart, J. S., Morgan, L. K., Figura, C. C., et al. 2011, MNRAS, 418, 1689 [NASA ADS] [CrossRef] [Google Scholar]
- Urquhart, J. S., Figura, C. C., Moore, T. J. T., et al. 2015, MNRAS, 452, 4029 [NASA ADS] [CrossRef] [Google Scholar]
- van der Tak, F. F. S., Black, J. H., Schöier, F. L., Jansen, D. J., & van Dishoeck, E. F. 2007, A&A, 468, 627 [NASA ADS] [CrossRef] [EDP Sciences] [Google Scholar]
- Wang, M., Chin, Y. N., Henkel, C., Whiteoak, J. B., & Cunningham, M. 2009, ApJ, 690, 580 [CrossRef] [Google Scholar]
- Wang, Y., Beuther, H., Zhang, Q., et al. 2012, ApJ, 754, 87 [NASA ADS] [CrossRef] [Google Scholar]
- Watanabe, N., & Kouchi, A. 2002, ApJ, 571, L173 [Google Scholar]
- Weiß, A., Neininger, N., Henkel, C., Stutzki, J., & Klein, U. 2001, ApJ, 554, L143 [CrossRef] [Google Scholar]
- Westerlund, B. E. 1990, A&ARv, 2, 29 [NASA ADS] [CrossRef] [Google Scholar]
- Wienen, M., Wyrowski, F., Schuller, F., et al. 2012, A&A, 544, A146 [NASA ADS] [CrossRef] [EDP Sciences] [Google Scholar]
- Wiesenfeld, L., & Faure, A. 2013, MNRAS, 432, 2573 [NASA ADS] [CrossRef] [Google Scholar]
- Wiseman, J. J., & Ho, P. T. P. 1998, ApJ, 502, 676 [NASA ADS] [CrossRef] [Google Scholar]
- Wong, T., Whiteoak, J. B., Ott, J., Chin, Y.-n., & Cunningham, M. R. 2006, ApJ, 649, 224 [NASA ADS] [CrossRef] [Google Scholar]
- Wong, T., Hughes, A., Ott, J., et al. 2011, ApJS, 197, 16 [NASA ADS] [CrossRef] [Google Scholar]
- Woon, D. E. 2002, ApJ, 569, 541 [Google Scholar]
- Wouterloot, J. G. A., Walmsley, C. M., & Henkel, C. 1988, A&A, 203, 367 [NASA ADS] [Google Scholar]
- Wu, J., Evans, Neal J., I., Gao, Y., et al. 2005, ApJ, 635, L173 [Google Scholar]
- Wu, Y., Zhang, Q., Yu, W., et al. 2006, A&A, 450, 607 [NASA ADS] [CrossRef] [EDP Sciences] [Google Scholar]
- Yan, Y. T., Zhang, J. S., Henkel, C., et al. 2019, ApJ, 877, 154 [Google Scholar]
- Zhang, Z.-Y., Gao, Y., Henkel, C., et al. 2014, ApJ, 784, L31 [NASA ADS] [CrossRef] [Google Scholar]
- Zhang, Z.-Y., Romano, D., Ivison, R. J., Papadopoulos, P. P., & Matteucci, F. 2018, Nature, 558, 260 [Google Scholar]
- Zhu, F.-Y., Wang, J.-Z., Liu, T., et al. 2020, MNRAS, 499, 6018 [NASA ADS] [CrossRef] [Google Scholar]
- Zylka, R., Guesten, R., Henkel, C., & Batrla, W. 1992, A&AS, 96, 525 [NASA ADS] [Google Scholar]
All Tables
Gas temperatures at different radius around the young stellar objects or candidates.
All Figures
|
Fig. 1 Velocity-integrated intensity maps (color bars in units of Jy beam−1 km s−1) of para-H2CO 303–202 (left panels),322–221 (central panels), and 321–220 (right panels) of N113 (integrated local standard of rest velocity range: 229–240 km s−1; top panels) and N159W (integrated velocity range: 232–244 km s−1; bottom panels). The centers of the fields are those also given in Sect. 2.2, i.e., α2000 = 05:13:18.2, δ2000 = –69:22:25.0 and α2000 = 05:39:36.0, δ2000 =– 69:45:25.0. The contours provide, with respect to the peak intensity, levels from 10 to 100% with steps of 10% (~10σ and ~7σ) for para-H2CO 303–202 in N113 and N159W, and from 10% to 100% with steps of 10% (~5σ) for para-H2CO 322-221 and 321 –220. The para-H2CO 303–202 peak intensities are 1.2 and 0.5 Jy beam−1 km s−1, the para-H2CO 322–221 peak intensities are 0.5 and 0.2 Jy beam−1 km s−1, and the para-H2CO 321–220 peak intensities are 0.5 and 0.2 Jy beam−1 km s−1 in N113 and N159W, respectively. The pixel size of each image is 0.′′2×0.′′2. The beam size of each image is shown in the lower left corner. Gray circles show the half power beam sizes of the N113 and N159W APEX-12m data, reported by Tang et al. (2017b). The shown fields of view encompass slightly more than our ALMA primary half power beam width (Sect. 2.2). No primary beam correction has been applied. Angular scales of 4″ correspond to a linear scale of ~1 pc. |
| In the text | |
|
Fig. 2 Spectra toward H2CO clumps in N113 (left panels) and N159W (right panels; see Table 2 and, for the numbering, the left panels of Figs. 3 and 4) taken from the strongest pixel obtained with ALMA. The pixel size is 0.′′ 2 × 0.′′2. Black: para-H2CO 303–202, red: para-H2CO 322–221, and blue: para-H2CO 321–220. The spectra are not smoothed, i.e., the channel widths are those given in Table 1. |
| In the text | |
|
Fig. 3 Left two panels: averaged velocity-integrated intensity ratio map of para-H2CO 0.5 × [(322–221 + 321–220)/303–202] in N113. Thekinetic temperatures derived from the para-H2CO (3–2) line ratios (color bar in units of Kelvin). Right two panels: maps of non thermal velocity dispersion (color bar in units of km s−1) and Mach number. Black contours show levels of integrated intensity of the para-H2CO (303–202) line (see Fig.1). Offsets are relative to our reference position for N113 (see Fig. 1). The pixel size of each image is 0.′′2 × 0.′′2. The beam size of each image is shown in the lower left corner. Stars and triangles show the locations of YSOs (or YSO candidates) and H2O masers (Chen et al. 2010; Ellingsen et al. 2010; Carlson et al. 2012), respectively. |
| In the text | |
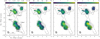 |
Fig. 4 Same as Fig. 3, but for N159W. |
| In the text | |
|
Fig. 5 RADEX non-LTE (red and blue lines) and LTE (black line) modeling of the relation between kinetic temperature and average ratio of para-H2CO 322–221/303–202 and 321 –220/303–202 with spatial densities of n(H2) = 104, 105, and 106 cm−3 (dashed,solid, and dotted lines, respectively), an averaged observed linewidth of 4.0 km s−1, and column densities of N(para-H2CO) = 2.7 × 10¹² and 3.7 × 1012 cm−2 for N113 (red lines) and N159W (blue lines) (Tang et al. 2017b), respectively. Tkin -Ratio(H2CO) relations for N113 and N159W at density 104 cm−3 are nearly the same, which is similar to the situation at 106 cm−3. |
| In the text | |
|
Fig. 6 Para-H2CO (303 –202) with integrated intensity contours (same as Fig. 1) overlaid on Hα (left panels; Smith & MCELS Team 1998), Spitzer 8.0 μm (middle panels; Meixner et al. 2006), and 1.3 mm continuum (right panels; observed with ALMA Band 6; Fukui et al. 2015; Sewiło et al. 2018) images of N113 (top panels) and N159W (bottom panels). Stars and triangles show the locations of the YSOs (or YSO candidates) and H2O masers (Chen et al. 2010; Ellingsen et al. 2010; Carlson et al. 2012), respectively. |
| In the text | |
|
Fig. 7 Non thermal velocity dispersion (σNT) vs. gas kinetic temperature derived from the para-H2CO line ratio for locations (pixels) with the Mach number |
| In the text | |
|
Fig. A.1 Para-H2CO 303–202 channel maps of N113. The contour levels are from 10% to 100% with steps of 10% of the peak intensity (0.25 Jy beam−1; color bar in units of Jy beam−1). The centers of the fields are given in Fig. 1. Angular scales of 4″ correspond to a linear scale of ~1 pc. No primary beam correction has been applied. |
| In the text | |
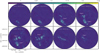 |
Fig. A.2 Same as Fig. A.1, but for N159W. |
| In the text | |
Current usage metrics show cumulative count of Article Views (full-text article views including HTML views, PDF and ePub downloads, according to the available data) and Abstracts Views on Vision4Press platform.
Data correspond to usage on the plateform after 2015. The current usage metrics is available 48-96 hours after online publication and is updated daily on week days.
Initial download of the metrics may take a while.