| Issue |
A&A
Volume 608, December 2017
|
|
|---|---|---|
| Article Number | A22 | |
| Number of page(s) | 8 | |
| Section | Extragalactic astronomy | |
| DOI | https://doi.org/10.1051/0004-6361/201730650 | |
| Published online | 01 December 2017 | |
Luminous, pc-scale CO 6−5 emission in the obscured nucleus of NGC 1377⋆
1 Department of Space, Earth and Environment, Onsala Space Observatory, Chalmers University of Technology, 439 92 Onsala, Sweden
e-mail: saalto@chalmers.se
2 Institute of Astronomy and Astrophysics, Academia Sinica, PO Box 23-141, 10617 Taipei, Taiwan
3 Department of Astronomy, University of Wisconsin-Madison, 5534 Sterling, 475 North Charter Street, Madison, WI 53706, USA
4 Department of Astrophysics, Astronomy & Mechanics, Faculty of Physics, University of Athens, Panepistimiopolis Zografos 15784, Greece
5 Kagoshima University, 890-0065 Kagoshima, Japan
6 Observatoire de Paris, LERMA (CNRS: UMR 8112), 61 Av. de l’Observatoire, 75014 Paris, France
7 Observatorio Astronómico Nacional (OAN) – Observatorio de Madrid, Alfonso XII 3, 28014 Madrid, Spain
8 Centre for Star and Planet Formation, Niels Bohr Institute and Natural History Museum of Denmark, University of Copenhagen, Øster Voldgade 5-7, 1350 Copenhagen K, Denmark
9 European Southern Observatory, Alonso de Córdova 3107, Vitacura, Santiago, Chile
10 Joint ALMA Observatory, Alonso de Córdova 3107, Vitacura, Santiago, Chile
11 Institut de Radio Astronomie Millimétrique (IRAM), 300 rue de la Piscine, Domaine Universitaire de Grenoble, 38406 St. Martin d’ Hères, France
12 Leiden Observatory, Leiden University, 2300 RA Leiden, The Netherlands
13 Department of Astronomy, University of Virginia, Charlottesville, VA 22904, USA
14 NRAO, 520 Edgemont Road, Charlottesville, VA 22903, USA
15 Finnish Centre for Astronomy with ESO (FINCA), University of Turku, Väisäläntie 20, 21500 Kaarina, Finland
Received: 17 February 2017
Accepted: 20 July 2017
High-resolution submillimeter line and continuum observations are important in probing the morphology, column density, and dynamics of the molecular gas and dust around obscured active galactic nuclei (AGNs). With high-resolution (0.̋06 × 0.̋05 (6 × 5 pc)) ALMA 690 GHz observations we have found bright (TB > 80 K) and compact (full width half maximum size (FWHM) size of 10 × 7 pc) CO 6−5 line emission in the nuclear region of the extremely radio-quiet galaxy NGC 1377. The CO 6−5 intensity is partially aligned with the previously discovered jet/outflow of NGC 1377 and is tracing dense (n > 104cm-3) hot molecular gas at the base of the outflow. The velocity structure is complex and shifts across the jet/outflow are discussed in terms of separate overlapping kinematical components or rotation. High-velocity gas (Δv ± 145km s-1) is detected inside r < 2−3 pc and we suggest that it is emerging from an inclined rotating disk or torus of position angle PA = 140° ± 20° with a dynamical mass of 3 × 10⁶M⊙. This mass is consistent with that of a supermassive black hole (SMBH), as inferred from the M−σ relation. The gas mass of the proposed disk/torus constitutes <3% of the dynamical mass inside a radius of 3 pc. In contrast to the intense CO 6−5 line emission, we do not detect 690 GHz dust continuum in the nuclear region of NGC 1377. The upper limit of S(690 GHz) ≲ 2 mJy implies an H2 column density N(H2) < 3 × 1023cm-2 (averaged in the central 6 × 5 pc beam). This is inconsistent with a Compton thick (CT) source and we discuss the possibility that CT obscuration may instead be occurring on smaller subparsec scales or in a larger foreground structure. From SED fitting we suggest that half of the IR emission of NGC 1377 is nuclear and the rest, mostly the far-infrared (FIR), is emerging from larger scales. The extreme radio quietness, and the lack of emission from other star formation tracers, raise questions on the origin of the FIR emission. We discuss the possibility that it arises from AGN-heated dust along the minor axis.
Key words: galaxies: individual: NGC 1377 / galaxies: active / galaxies: ISM / ISM: molecules / galaxies: nuclei / ISM: jets and outflows
The reduced datacube is only available at the CDS via anonymous ftp to cdsarc.u-strasbg.fr (130.79.128.5) or via http://cdsarc.u-strasbg.fr/viz-bin/qcat?J/A+A/608/A22
© ESO, 2017
1. Introduction
NGC 1377 is a nearby (21 Mpc (1′′ = 102 pc)) lenticular galaxy with a far-infrared (FIR) luminosity of LFIR = 4.3 × 10⁹L⊙ (Roussel et al. 2003). NGC 1377 is the most radio-quiet, FIR-excess galaxy known to date; its radio emission is weaker (with respect to its FIR emission) by a factor ≈37 compared to normal galaxies (Roussel et al. 2003, 2006). Its nucleus is dust enshrouded (e.g. Spoon et al. 2007) and the source of the FIR luminosity (and the cause of its radio deficiency) has remained elusive. A nascent starburst (Roussel et al. 2003, 2006) or a radio-quiet active galactic nucleus (AGN; Imanishi 2006; Imanishi et al. 2009) have been proposed as possible solutions. The energetics of a powerful molecular outflow seem to point towards an AGN (Aalto et al. 2012), and recent ALMA observations (Aalto et al. 2016) have revealed that at least part of the outflow is in the form of a peculiar molecular jet. Velocity reversals along the jet may be indications of precession (Aalto et al. 2016).
Recently, faint radio emission with a synchrotron spectrum has been detected, but there appears to be no nuclear X-ray source (Costagliola et al. 2016). The radio detection confirms the extreme FIR-excess of NGC 1377 and that it is far away from the radio-FIR correlation (Helou et al. 1985). Costagliola et al. (2016) use the radio emission to estimate the star formation rate (SFR) and find a SFR < 0.1M⊙ yr-1, which is not sufficient to power the observed IR luminosity and to drive the CO outflow. However, even if the evidence in support of a buried AGN is mounting, the nature of the power source behind the FIR luminosity and the molecular outflow is still not fully understood.
Observations at mid-infrared (mid-IR) wavelengths reveal a compact ( <0.̋14), high surface brightness source (Imanishi et al. 2011) in the nucleus of NGC 1377. It is not clear whether this structure is part of an obscuring torus or disk, and whether it is opaque enough to absorb X-rays emerging from an accreting supermassive black hole. It is also not understood whether (or how) the obscuring material is linked to the outflowing gas in the jet.
Submillimeter observations of dust continuum are powerful tools in detecting the presence of opaque structures of obscuring dust (e.g. Sakamoto et al. 2008; Wilson et al. 2014). However, direct detection on pc-scales of the dust torus around an AGN have remained elusive until recently when Atacama Large Millimeter/submillimeter Array (ALMA) band 9 (690 GHz) observations of the Seyfert galaxy NGC 1068 revealed the presence of the obscuring torus and its turbulent dynamics (García-Burillo et al. 2016; Gallimore et al. 2016). We obtained ALMA band 9 observations to probe the structure and orientation of the intervening dust in the nucleus of NGC 1377 and to determine gas and dust column densities. We also acquired simultaneous CO 6−5 observations to probe the very nuclear pc-scale dynamics of the hot gas.
In Sects. 2 and 3 we present the observations and the results. In Sect. 4 we discuss the nuclear gas excitation, the nuclear dust obscuration, and the limits to the associated H2 column densities. We also present a simple two-component model to the dust spectral energy distribution (SED) and discuss the origin of the FIR emission of NGC 1377. In Sect. 5 we examine the possible source of the CO 6−5 high-velocity gas, the dynamics of the nuclear disk, and the acceleration region of the jet/outflow.
2. Observations
Observations of the CO J = 6−5 line were carried out with ALMA (with 35 antennas in the array) on 2015 September 25, for 4 min on-source (30 min in total) and with reasonable atmospheric conditions (precipitable amount of water vapour of ~0.5 mm, Tsys = 600−1200 K). The phase centre was set to α = 03:36:39.074 and δ = −20:54:07.055 (J2000) (close to the position of the peak 345 GHz continuum emission and of the CO 3−2 integrated intensity, Aalto et al. 2016).
The correlator was set up to cover two spectral windows of 1.875 GHz in spectral mode, one centred at a frequency of 689.4 GHz to cover the CO J = 6 −5 line, and the other centred at 704.7 GHz to cover the HCN 8–7 line. In addition, two 2 GHz bands were set up in continuum mode with centre frequencies 687.4 GHz and 702.7 GHz, respectively.
The bandpass of the individual antennas was derived from the quasar J0522−3627. The quasar J0348−2749 was observed for complex gain calibration. The absolute flux scale was calibrated using the quasar J0334−401. In the ALMA Calibrator Source Catalogue there is only one flux value for band 9 for the flux calibrator listed. Instead, we can use the spectral index from the (many) data points in bands 3 and 7 to extrapolate the flux in band 9 for our project (specifically for the observation date). The resulting flux is 0.205 ± 0.063 Jy at the representative frequency (687.4 GHz). Therefore, the nominal flux uncertainty is about 30%. In the two months before and the two months after the observations, the flux values in bands 3 and 7 were stable. Hence, variability appears not to be a major issue. The resulting data would have a maximum theoretical sensitivity of 9 mJy (dual polarization, Briggs weighting) per beam in a 20 km s-1 (47 MHz) channel width and in the highest grade weather. Our data set is close to this with an rms of 10 mJy. This means that we are only sensitive to structures with relatively high surface brightness (10 mJy = TB = 10 K).
After calibration within the CASA reduction package (McMullin et al. 2007), the visibility set was imported into the AIPS package for further imaging. The synthesized beam is  (6 × 5 pc) with Briggs weighting (parameter robust set to 0.5). The on-source observation was short (250 s) and was designed to detect a purported high surface brightness dusty nucleus. The large number of telescopes in the observation ensures a good sampling of the uv-plane despite the short observation (Bmax = 2250 m, Bmin = 41 m). However, the recoverable scale is limited theoretically to 2.̋2, but effectively we could not recover structures larger than 1′′ because we lose sensitivity for the lower spatial frequencies due to a lack of baselines (see the ALMA technical handbook and also footnote 4 in Sect. 4.2.2).
3. Results
CO 6−5 flux densities.
3.1. CO 6−5
We detect luminous CO 6−5 emission inside r = 10 pc of the NGC 1377 nucleus. CO 6−5 flux densities are presented in Table 1 and the peak flux density is 90 mJy beam-1, which corresponds to a brightness temperature TB > 80 K1.
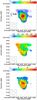 |
Fig. 1 CO 6−5 moment maps. Top: integrated intensity (mom0) where contours are 0.6 × (1, 4, 7, 10, 13, 16, 19, 22, 25) Jy km s-1 beam-1. Colours range from 0 to 15 Jy km s-1 beam-1. The dashed line marks the orientation of the molecular jet (see text for details). Centre: velocity field (mom1) where contours (and colours) range from 1700 km s-1 to 1820 km s-1 in steps of 10 km s-1. Bottom: map of the one-dimensional velocity dispersion (mom2), i.e. the FWHM line width of the spectrum divided by 2.35 for a Gaussian line profile. Contours are 4.4 × (1, 3, 5, 7, 9, 11, 13) km s-1 and colours range from 0 to 60 km s-1. The cross indicates the position of the 345 GHz continuum peak (Aalto et al. 2016). How the moment maps were constructed is described in Sect. 3. |
3.1.1. Moment maps
The CO 6−5 integrated intensity (moment 0) map, velocity field (moment 1), and dispersion map (moment 2) are presented in Fig. 1. We clipped fluxes below the 3σ level (per channel) before integration. The velocity centroids were determined through a flux-weighted first moment of the spectrum of each pixel, therefore assigning one velocity to a spectral structure. The dispersion was determined through a flux-weighted second moment of the spectrum of each pixel. This corresponds to the one-dimensional velocity dispersion (i.e. the FWHM line width of the spectrum divided by 2.35 for a Gaussian line profile). All three moment maps cover the same velocity range.
Moment 0 map.
We find a centrally peaked structure with extensions to the north-east and south-west roughly consistent with the orientation of the previously found molecular jet (Aalto et al. 2016). There is also a feature to the north-east with a position angle (PA) of 30° and fainter emission fanning out to the north-west of the nucleus. With a two-dimensional Gaussian fitting we find a full width half maximum (FWHM) source size of 0.̋096 × 0.̋07 (± 0.01) (10 × 7 pc). The position angle is PA = 20° ± 15°.
Moment 1 and 2 maps.
The centroids of the velocity field span 1690−1820 km s-1. Blue-shifted emission is found to the north, west, and south-west of the nucleus, and red-shifted velocities are found to the north-east and south-east. The velocity field is very complex, suggesting multiple overlapping dynamical structures. The dispersion map peaks on the nucleus and has extensions to the south and to the north-east. The peak velocity dispersion is σv = 66km s-1 in the nucleus.
3.1.2. Low-velocity and systemic gas
The low-velocity near-systemic (1680−1800 km s-1) gas is located in the nucleus and in 10 pc narrow gas extensions. A velocity field (moment 1) map, where only the brightest emission (6σ) has been selected, reveal a 100 km s-1 velocity gradient (from 1690 to 1790 km s-1) along a 0.̋08 axis with a PA of 120° ± 10° (Fig. 3, right panel). The orientation of the velocity shift is roughly consistent with that of the CO 3–2 disk-like feature (Aalto et al. 2016) suggesting it may be the major axis of a circum nuclear disk. The systemic velocity Vc is 1740 ± 6km s-1 (Aalto et al. 2012) and here we have set Vc to 1743 km s-1. The velocity scale is in radio local standard of rest (LSR).
In Fig. 3 there is also a near-systemic velocity feature extending south by 0.̋1. A position-velocity (PV) diagram shows this structure as prominent collimated emission along the north–south axis (Fig. 6 discussed in Sect. 5.2). There is also a narrow somewhat red-shifted (1780−1800 km s-1) emission component stretching out to the north-east (Fig. 5, discussed in Sect. 5).
3.1.3. High-velocity gas
We integrated the high-velocity emission (1500 to 1670 and 1825 to 2000 km s-1). This is the same velocity range as the identified high-velocity gas in the CO 3–2 map (Aalto et al. 2016) and we have marked it in a central CO 6−5 spectrum (Fig. 2). Just as for the mom0 map of the whole line shape, we clip the emission below 3σ before we integrate. To increase our sensitivity to the fainter high-velocity gas, we Hanning-smoothed three channels together. We find that the most blue-shifted emission is located in the northern part of the nucleus. The red-shifted emission is found in the southern part of the nucleus and in a 0.̋1 extension to the south. The peaks of the integrated red- and blue-shifted emission are separated by 0.̋05 (5 pc) with a PA = 140° ± 10° (see Fig. 3, centre panel).
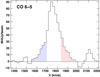 |
Fig. 2 Central CO 6−5 spectrum where the high velocity gas is indicated in blue and red. |
3.2. Continuum and HCN 8–7
We merged all line-free channels in our observations, i.e. the total available line channels apart from those in the CO 6−5 line, but we did not detect any 690 GHz continuum with an upper limit of 2 mJy (1σ). No HCN 8–7 emission was detected with limits to the integrated intensity of 2 Jy km s-1.
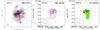 |
Fig. 3 Left: CO 3–2 integrated intensity image where emission close to systemic velocity (1700−1760 km s-1) is shown in greyscale. The high-velocity (±80 to ±150 km s-1) emission from the molecular jet is shown in contours (red and blue show the velocity reversals). The CO 3–2 beam ( |

4. Nuclear region dust and gas properties
4.1. Gas excitation and H2 column densities in the inner 25 pc
We have no other line that we can use to study the gas excitation at a matching resolution to our CO 6−5 ALMA 5 pc beam. Therefore, we convolved our CO 6−5 map to the same resolution (25 pc) as that of the CO 3–2 ALMA data of Aalto et al. (2015). The average TB for CO 3–2 is 34 K and for CO 6−5 it is 40 K, resulting in a CO 6−5/3–2 intensity ratio of ℛ of 1.2. Such a high value of ℛ implies gas densities n ≳ 104cm-3, kinetic temperatures Tkin > 100 K, and low to moderate (τ ≲ 1) line opacities. These properties are similar to those found in the nucleus of the Seyfert galaxy NGC 1068 on spatial scales of 35 pc (García-Burillo et al. 2014; Viti et al. 2014).
Using the RADEX (van der Tak et al. 2007) non-LTE radiative transport model, we find that CO column densities of N(CO) = 3 × 1018cm-2 (for ΔV = 150km s-1) and line optical depths near unity can satisfy ℛ and the observed line TB2. For gas number densities of n ≈ 104cm-3, gas kinetic temperatures are high (Tkin > 300 K), and for higher densities of n ≈ 105cm-3, temperatures can be lower (Tkin > 100 K).
For typical CO abundances of 10-5−10-4, the N(CO) implies H2 column densities of N(H2) = 3 × 10²²−3 × 1023cm-2. This is about one order of magnitude lower than that derived from the CO conversion factor (see Aalto et al. 2016). If there is a steep nuclear temperature gradient, the value of ℛ may be ≫1 in the inner 5 pc to <1 at a resolution of 25 pc. This could potentially allow for higher values of N(H2), but the weak 345 GHz (860 μm) continuum in the nucleus found by Aalto et al. (2016) places constraints on N(H2). In the 345 GHz ALMA continuum map we find a total flux of 2.2 mJy in a structure with a FWHM size of 0.̋25 × 0.̋09. The peak flux is 1.3 mJy which corresponds to TB(345 GHz) = 0.3 K. A lower limit to Td is 34 K, which results in an upper limit to column densities of 1023cm-2 (for a gas-to-dust ratio of 100 and following the prescription in Keene et al. 1982). If gas kinetic temperatures are indeed 100 K the gas column densities drop to 3 × 1022cm-2.
4.2. How obscured is the nucleus of NGC 1377?
NGC 1377 is a galaxy with a deep silicate absorption implying a dust enshrouded nucleus (Spoon et al. 2007), and it has been suggested that it belongs to a group of galaxies with compact obscured nuclei (CONs). These objects have dust continuum emission that is optically thick down to mm wavelengths (e.g. the LIRG NGC 4418; Sakamoto et al. 2013; Costagliola et al. 2013). Compact obscured nuclei have opaque structures on scales of tens of pc with N(H2) in excess of 1025cm-2. They likely host young dust enshrouded nuclear activity in the form of compact starbursts and/or accreting supermassive black holes (SMBHs) (Aalto et al. 2015). It has also been proposed that NGC 1377 harbours young nuclear activity at least partially powered by an accreting SMBH (Aalto et al. 2012, 2016; Costagliola et al. 2016). Its lack of X-ray emission is thought to be caused by a large, Compton thick (CT) column of obscuring dust and gas with N(H2) > 1024cm-2 (Costagliola et al. 2016).
4.2.1. Obscuration and H2 column densities on 5 pc scales
Compact 690 GHz continuum emission is, however, not detected in the inner 5 pc of NGC 1377 with a limit of TB < 2 K (2 mJy). For TB(690 GHz) < 2 K and a dust temperature Td ≳ 100 K (assuming similar gas and dust temperatures), we can estimate an upper limit to the optical depth τ(690 GHz) of 0.02.
From Keene et al. (1982), the corresponding N(H+H2) is ≲ 2.4 × 1023cm-2 in the 5 pc ALMA beam. This is a substantial column density, but it does not suggest that the nucleus of NGC 1377 is CT. Not even soft (0.5−2 keV) X-rays become strongly absorbed at these column densities (Treister & Urry 2012). The limits to N(H+H2) are consistent with those derived for scales of 25 pc from the faint 345 GHz continuum and CO excitation in Sect. 4.13.
However, CT obscuration may occur on smaller (subparsec) or larger scales. Lower resolution Herschel observations, for example, find a 690 GHz flux of 200 mJy (Dale et al. 2014) in contrast to the 2 mJy nondetection in our 5 pc ALMA beam. The 690 GHz flux detected by Herschel must therefore have an extended distribution with lower surface brightness. In the following two sections we discuss the possibility that foreground obscuration, or a subparsec structure, may provide line-of-sight CT obscuration.
4.2.2. Foreground obscuration?
In Fig. 4 we present the global IR SED of NGC 1377. We include a two-component fit to the data points consisting of a compact and an extended source. We fix the source size of the compact component to 0.̋14 (14 pc). This is the upper limit to the high surface brightness mid-IR (18 μm) source found by Imanishi et al. (2011). We also assign it a Td of 100 K since Imanishi et al. (2011) derive a mid-IR surface brightness of Σmid - IR > 2.5 × 10¹³L⊙ kpc-2, implying a TB(18 μm) ≳ 100 K. The limit to the 690 GHz flux, if we convolve our ALMA observations to a 0.̋14 aperture, is 3.5 mJy, and we use the 345 GHz continuum flux of 1.3 mJy (in a 0.̋25 aperture, Aalto et al. 2015) as an upper limit to the flux in the 0.̋14 aperture. The resulting compact SED is shown as the blue curve in Fig. 4. The 12 μm point in the SED is underpredicted suggesting either that Td is >100 K or that there is an additional hotter component.
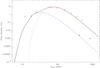 |
Fig. 4 Two-component model for the dust SED. It consists of a hot compact (0.̋14) component with Td = 100 K and an extended (1.̋5) component with Td = 40 K. For a gas-to-dust ratio the H2 column densities are N(H2) = 3 × 10²² and 2 × 10²², respectively. Luminosities are 1.1 × 10⁹L⊙ for the compact component and 2.2 × 10⁹L⊙ for the extended one. The observed SED points are marked as red squares and were taken from http://ned.ipac.caltech.edu/forms/photo.html. We used a modified black body to produce the SED. We calculate an optical depth at each wavelength and then we determine the dust temperature (modified by the optical depth). The mass absorption coefficients used can be found in González-Alfonso et al. (2014). We assume a standard gas-to-dust ratio of 100. |
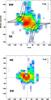 |
Fig. 5 CO 6−5 PV diagrams. Top: PA = 135° close to the major axis of the nuclear disk. The curves show the Keplerian rotation curves of a 106, 3 × 10⁶, and 6 × 10⁶M⊙ SMBH. Bottom: cut perpendicular (PA = 45°) to the nuclear disk. The contour levels are 25 × (1, 2, 3) mJy beam-1. Colours range from 25 to 90 mJy beam-1. A velocity of 0 km s-1 corresponds to 1743 km s-1. |
The extended source, to which we fit the IRAS FIR points and the 200 mJy Herschel 690 GHz continuum data point, does not have a similar size constraint. In general, however, we expect the low-J CO emission to be roughly co-existent with the extended dust component, and therefore we selected a size of 1.̋5 (Aalto et al. 2012, 2016) for the extended component4. We find that the compact component has N(H+H2) in the range of 1022−1023cm-2, and to the extended component we can fit values of a few times 1022cm-2 for dust temperatures around 40 K. These combined components will not provide CT obscuration, but we require sensitive, lower resolution ALMA observations to search for the potential presence of colder large-scale emission.
4.2.3. Is there a subparsec Compton thick core?
Alternatively, a CT source may be significantly smaller than our ALMA 5 pc beam. A simple model with N(H2) = 1 × 1025cm-2 and constrained to have an upper limit to its 690 GHz continuum flux of 2 mJy gives corresponding maximum sizes of an opaque dust structure in the NGC 1377 nucleus. Thus, for an upper limit, we can model the 690 GHz flux from such an opaque structure through S(690 GHz) = 10-26Bν(T) πr2/D2 (1−exp(−τ)) (where D is the distance to NGC 1377, r is the radius of the dust structure, and Bν(T) is the Planck function). Maximum sizes for r range from 0.7 to 0.2 for dust temperatures ranging from 100−700 K. The dust sublimation radius is 0.02−0.05 pc from an AGN of luminosity 1043 erg/s (Netzer 2015). An obscuring screen as small as r = 0.2 pc may therefore be possible and would not be detected with the resolution and sensitivity of the ALMA observations presented here.
The combination of observational limits imposed by sensitivity and resolution on the 690 GHz flux from an unresolved nuclear source combined with the physical constraints on dust properties suggest that a dense obscuring dust screen with radius r ≈ 0.2 pc could exist and not be detected by our observations. Further higher sensitivity observations are required to explore this possibility.
4.3. Origin of the FIR luminosity
The detection of faint radio emission with a synchrotron spectrum by Costagliola et al. (2016) suggests that NGC 1377 is not powered by a buried nascent starburst. This is consistent with the discovery of a molecular jet in NGC 1377, which could indicate that its nucleus is powered by a single accreting object, an AGN. In addition, based on their IR AGN-Starburst diagnostic diagrams, Dale et al. (2014) conclude that NGC 1377 is located away from “actively star forming” and in the region with a significant AGN contribution (near the 75% contribution line).
We previously estimated the mass of the buried SMBH as ≈1.5 × 10⁶M⊙ (Aalto et al. 2012). The Eddington luminosity of a 106M⊙ SMBH is about 5 × 10¹⁰L⊙. If all the mid-IR luminosity (1 × 10⁹L⊙ to 4 × 10⁹L⊙) is due to an accreting SMBH, we find it is growing at a rate of 1–10% Eddington, which would place it in the quasar mode of accretion5. Alternatively, the mid-IR emission may be originating from an extremely radio-quiet nuclear starburst as suggested by Roussel et al. (2006). The molecular jet would then be powered by an SMBH accreting at a substantially lower Eddington rate. The old stellar component may also contribute to the heating of the dust and gas.
In our models (see Sect. 4.2.2), the FIR emission cannot be emerging from the same compact structure as the mid-IR, but from a more extended component. The lack of star formation indicators implies that the extended FIR emission is not associated with dust heated by massive stars. An alternative scenario is that the FIR emission is emerging from the minor axis along the jet/outflow and that the dust is heated by mechanical interactions in the outflow and/or by photons escaping from the AGN along the poles.
5. Nuclear region dynamics
Our CO 6−5 observations provide important information on the very inner kinematics and how the activity is interacting with its surroundings in the central 10−20 pc. The PA of the integrated CO 6−5 emission (20° ± 15°) implies that it is largely aligned with the jet/outflow. The high-velocity (±145 km s-1) gas, on the other hand, has a PA of 140° ± 10° (see Sect. 5 and Fig. 3) and it is emerging close to the nucleus (r = 2−3 pc). The CO 6−5 high-velocity gas spans similar velocities to those found for the previous CO 3–2 observations. However, there the maximum velocity occurred further from the nucleus (0.̋25 = 25 pc) along a collimated, potentially precessing jet-structure (Aalto et al. 2016).
5.1. High-velocity gas
Disk.
If the high-velocity gas is due to rotation in a disk, the projected rotational velocity is 73 km s-1 and (assuming an edge-on disk) the dynamical mass6 is Mdyn = 3 × 10⁶M⊙ inside r = 2.5 pc. This is close to the SMBH mass of 1.5 × 10⁶M⊙ inferred from the M−σ relation (Aalto et al. 2012).
The PA of the blue and red peaks of the high-velocity gas of 140° is close to the orientation of the suggested circumnuclear disk (see Sect. 5). Thus, it is possible that the high-velocity gas is emerging from a Keplerian disk with a major axis of 120°−140° which is warped in relation to the large-scale stellar disk with a PA for its major axis of 90° (Aalto et al. 2012). In Fig. 5 we show the Keplerian tracks of three different compact masses overlayed on the major axis PV diagram of the high-velocity emission. Comparing the tracks to the data we see that the expected high-velocity cusp in the centre is missing. Deeper observations are required to determine if this is a sensitivity issue or if there is no nuclear gas with velocities >100 km s-1.
There is also CO 6−5 emission at forbidden velocities indicating non-circular motions in the form of turbulence, instabilities, and/or outflowing gas (García-Burillo et al. 2016). Within the errors, the data allows for either a single SMBH or a combination of a SMBH and a compact nuclear stellar cluster (see e.g. cluster rotation curves in Stone & Ostriker 2015).
We can obtain estimates to the disk gas inside 5 pc by adopting the limit to N(H2) derived in Sect. 4.2 and assume that it fills the beam, which leads to Mgas ≲ 105M⊙. However, since there may also be emission from the outflow in the inner beam, a limit to Mgas can also be obtained through inferring an edge-on disk with thickness h = r/ 2 and using the limit to N(H2) then Mgas ≲ 2 × 10⁴M⊙. In any case, the gas mass is significantly lower than the dynamical mass ( <3%), which again suggests similar properties to those of the non-self-gravitating gas torus of NGC 1068 (García-Burillo et al. 2016).
Jet/outflow.
The previously found molecular jet has a symmetry axis of ≈ 11° and was thought to precess with an angle θ = 10°−25° (Aalto et al. 2016). The simple precessing jet model proposed in Aalto et al. (2016) predicts that velocities, after peaking at a distance ±25 pc, decrease closer to the nucleus. In the CO 6−5 data there are no strong signatures ( >3σ) of high-velocity gas at ±0.̋25. This may be a sensitivity issue and/or suggest that the gas temperature and density is only high enough to excite the CO 3–2 line, but not the CO 6−5, 25 pc along the jet. The PA of 140° ± 10° of the nuclear CO 6−5 high-velocity gas is also inconsistent with it being associated with gas along the jet. However, luminous CO 6−5 emission at velocities closer to systemic is detected along the jet (see discussion in Sect. 5.2).
We tentatively conclude that the most likely origin of the nuclear CO 6−5 high-velocity gas is in a rotating, inclined disk. However, we cannot exclude that the jet behaviour has changed close to the nucleus or that it has turned off. We may be resolving the jet or the high-velocity gas may be emerging from another outflow structure.
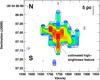 |
Fig. 6 Position-velocity (PV) diagram along the north–south axis. The contour levels are 25 × (1, 2, 3) mJy beam-1. Colours range from 25 to 90 mJy beam-1. |
5.2. Jet/outflow dynamics
A component that would fit the jet-precession model is the bright narrow feature emerging from the nucleus in the north–south direction (Fig. 6). It is found at systemic velocities, and would be consistent with a scenario where the jet has precessed away from its symmetry axis and is now at its maximum angle away from the symmetry axis. In this case, the jet precession angle would be close to θ = 10°. The high CO 6−5 brightness temperature of (at least the southern) collimated feature may indicate shock-heating by the jet-interaction. We note that if jet precession is caused by the warping of the nuclear disk (see discussion in Aalto et al. 2016) then the inner disk should have a PA close to 90°, which appears to be inconsistent with the PA of the nuclear disk found above. However, the precession may be governed by the accretion disk, which would be much smaller than 5 pc.
There are also other (somewhat fainter) narrow jet-like features in the map. One is a structure emerging to the north-east at PA = 45° and which may have a counterpart to the south-west. We can see it as a red-shifted component extending 20 pc along the north-eastern part of the minor axis (right panel in Fig. 5). It is not clear if this is a separate component or if all (seemingly) collimated features are part of the same outflow. In our previous CO 3–2 observations, we did not resolve the high-velocity jet in our 0.̋25 beam. Even though a radio jet may have a very narrow width and could be unresolved even by our CO 6−5 5 pc beam, it would interact with its surroundings resulting in a wider structure.
There is a velocity shift across the jet to the north and south of about 150 km s-1, but it is not clear if these are overlapping, separate dynamical components or if there is rotation in the jet/outflow. If the jet formation is strongly linked to the molecular disk in the form of a disk wind (see e.g. Gallimore et al. 2016, for a discussion of a potential disk wind scenario for NGC 1068). In this case we may expect to see remnants of the disk rotation in the outflowing gas as a velocity gradient across the jet (e.g. Smith & Rosen 2007; Launhardt et al. 2009).
There may also be contamination from the disk rotation near the nucleus. In addition, a very thin radio-jet pushing itself through a dense medium may result in gas being accelerated in opposite directions, perpendicular to the jet (see e.g. discussion in Dasyra et al. 2015). To fully explore the link between the disk and the jet/outflow, high-resolution observations at multiple frequencies are required.
6. Conclusions
We have used ALMA to image the CO 6−5 emission, and put limits on the 690 GHz continuum, in the nucleus of the extremely radio-quiet lenticular galaxy NGC 1377 with a resolution of 6 × 5 pc. We find luminous, compact (10 × 7 pc) CO 6−5 emission from hot (Tkin ≳ 100 K) molecular gas. The CO 6−5 integrated intensity is aligned with the previously discovered jet/outflow of NGC 1377 and is also tracing the dense, hot gas at the base of the outflow. Collimated, high brightness features 10 pc in length extend from the nucleus and are likely associated with the jet. The velocity structure is complex, suggesting either multiple overlapping dynamical components or rotation in the jet/outflow.
High-velocity gas (Δv ± 145km s-1) is detected inside r < 2−3 pc and we suggest that it is emerging from an inclined rotating disk or torus of PA 140° ± 20° and a dynamical mass of 3 × 10⁶M⊙. This mass is consistent with that of a supermassive black hole (SMBH), as inferred from the M−σ relation. The gas mass of the proposed disk/torus constitutes <3% of the nuclear dynamical mass.
In contrast to the intense CO 6−5 line emission, we do not detect 690 GHz dust continuum in the nuclear region of NGC 1377. The upper limit of S(690 GHz) ≲ 2 mJy implies an H2 column density N(H2) < 3 × 1023cm-2 (averaged in the central 6 × 5 pc beam). This is inconsistent with a Compton thick (CT) source and we discuss the possibility that CT obscuration may instead be occurring on smaller, subparsec scales or may be coming from a larger foreground structure. From SED fitting we suggest that half of the IR emission of NGC 1377 is nuclear and the rest (mostly the FIR) is emerging from larger scales. The extreme radio quietness and the lack of emission from other star formation tracers raise questions regarding the origin of the FIR emission. We discuss the possibility that it is arising from AGN-heated dust along the minor axis.
The limit to N(H+H2) is also similar to the hydrogen column density estimated from the silicate absorption feature (Roussel et al. 2006; Lahuis et al. 2007).
The sensitivity of the 690 GHz ALMA observations presented here declines with increasing beam size; in a 1.̋8 beam there are very few baselines left and the sensitivity is effectively 50 mJy. There is therefore nothing in our observations that contradicts that the Herschel flux can be distributed on the scales inferred from the CO observations.
This discussion assumes that the IR emission is absorbed and reradiated uv and X-ray emission from an efficiently accreting SMBH. An alternative possibility is an AGN in low-accretion radio-mode. It may generate a radio jet which is shock heating gas and dust in the nucleus. This scenario would be unusual but deserves future consideration, for example through searching for hard X-ray emission associated with hard-state low-accretion mode.

Acknowledgments
This paper makes use of the following ALMA data: ADS/JAO.ALMA#2012.1.00900.S. ALMA is a partnership of ESO (representing its Member States), NSF (USA), and NINS (Japan), together with NRC (Canada) and NSC and ASIAA (Taiwan), in cooperation with the Republic of Chile. The Joint ALMA Observatory is operated by ESO, AUI/NRAO, and NAOJ. We thank the Nordic ALMA ARC node for excellent support. S.A. acknowledges support from the Swedish National Science Council grant 621-2011-4143. F.C. acknowledges support from Swedish National Science Council grant 637-2013-7261. K.S. was supported by grant MOST 102-2119-M-001-011-MY3. S.G.B. acknowledges the economic support from grants ESP2015-68964-P and AYA2016-76682-C3-2-P. This research has made use of the NASA/IPAC Extragalactic Database (NED) which is operated by the Jet Propulsion Laboratory, California Institute of Technology, under contract with the National Aeronautics and Space Administration.
References
- Aalto, S., Muller, S., Sakamoto, K., et al. 2012, A&A, 546, A68 [NASA ADS] [CrossRef] [EDP Sciences] [Google Scholar]
- Aalto, S., Costagliola, S. M. F., Gonzalez-Alfonso, E., et al. 2015, A&A, 584, A42 [NASA ADS] [CrossRef] [EDP Sciences] [Google Scholar]
- Aalto, S., Costagliola, F., Muller, S., et al. 2016, A&A, 590, A73 [NASA ADS] [CrossRef] [EDP Sciences] [Google Scholar]
- Costagliola, F., Aalto, S., Sakamoto, K., et al. 2013, A&A, 556, A66 [Google Scholar]
- Costagliola, F., Herrero-Illana, R., Lohfink, A., et al. 2016, A&A, 594, A114 [NASA ADS] [CrossRef] [EDP Sciences] [Google Scholar]
- Dale, D. A., Helou, G., Magdis, G. E., et al. 2014, ApJ, 784, 83 [NASA ADS] [CrossRef] [Google Scholar]
- Dasyra, K. M., Bostrom, A. C., Combes, F., & Vlahakis, N. 2015, ApJ, 815, 34 [Google Scholar]
- Gallimore, J. F., Elitzur, M., Maiolino, R., et al. 2016, ApJ, 829, L7 [NASA ADS] [CrossRef] [Google Scholar]
- García-Burillo, S., Combes, F., Usero, A., et al. 2014, A&A, 567, A125 [NASA ADS] [CrossRef] [EDP Sciences] [Google Scholar]
- García-Burillo, S., Combes, F., Ramos Almeida, C., et al. 2016, ApJ, 823, L12 [NASA ADS] [CrossRef] [Google Scholar]
- González-Alfonso, E., Fischer, J., Graciá-Carpio, J., et al. 2014, A&A, 561, A27 [NASA ADS] [CrossRef] [EDP Sciences] [Google Scholar]
- Helou, G., Soifer, B. T., & Rowan-Robinson, M. 1985, ApJ, 298, L7 [Google Scholar]
- Imanishi, M. 2006, AJ, 131, 2406 [NASA ADS] [CrossRef] [Google Scholar]
- Imanishi, M., Nakanishi, K., Tamura, Y., & Peng, C. 2009, AJ, 137, 3581 [Google Scholar]
- Imanishi, M., Imase, K., Oi, N., & Ichikawa, K. 2011, AJ, 141, 156 [Google Scholar]
- Keene, J., Hildebrand, R. H., & Whitcomb, S. E. 1982, ApJ, 252, L11 [NASA ADS] [CrossRef] [Google Scholar]
- Lahuis, F., Spoon, H. W. W., Tielens, A. G. G. M., et al. 2007, ApJ, 659, 296 [NASA ADS] [CrossRef] [Google Scholar]
- Launhardt, R., Pavlyuchenkov, Y., Gueth, F., et al. 2009, A&A, 494, 147 [NASA ADS] [CrossRef] [EDP Sciences] [Google Scholar]
- McMullin, J. P., Waters, B., Schiebel, D., Young, W., & Golap, K. 2007, in Astronomical Data Analysis Software and Systems XVI, eds. R. A. Shaw, F. Hill, & D. J. Bell, ASP Conf. Ser., 376, 127 [Google Scholar]
- Netzer, H. 2015, ARA&A, 53, 365 [NASA ADS] [CrossRef] [Google Scholar]
- Roussel, H., Helou, G., Beck, R., et al. 2003, ApJ, 593, 733 [Google Scholar]
- Roussel, H., Helou, G., Smith, J. D., et al. 2006, ApJ, 646, 841 [NASA ADS] [CrossRef] [Google Scholar]
- Sakamoto, K., Wang, J., Wiedner, M. C., et al. 2008, ApJ, 684, 957 [NASA ADS] [CrossRef] [Google Scholar]
- Sakamoto, K., Aalto, S., Costagliola, F., et al. 2013, ApJ, 764, 42 [NASA ADS] [CrossRef] [Google Scholar]
- Smith, M. D., & Rosen, A. 2007, MNRAS, 378, 691 [NASA ADS] [CrossRef] [Google Scholar]
- Spoon, H. W. W., Marshall, J. A., Houck, J. R., et al. 2007, ApJ, 654, L49 [NASA ADS] [CrossRef] [Google Scholar]
- Stone, N. C., & Ostriker, J. P. 2015, ApJ, 806, L28 [NASA ADS] [CrossRef] [Google Scholar]
- Treister, E., & Urry, C. M. 2012, Adv. Astron., 2012, 516193 [NASA ADS] [CrossRef] [Google Scholar]
- van der Tak, F. F. S., Black, J. H., Schöier, F. L., Jansen, D. J., & van Dishoeck, E. F. 2007, A&A, 468, 627 [NASA ADS] [CrossRef] [EDP Sciences] [Google Scholar]
- Viti, S., García-Burillo, S., Fuente, A., et al. 2014, A&A, 570, A28 [NASA ADS] [CrossRef] [EDP Sciences] [Google Scholar]
- Wilson, C. D., Rangwala, N., Glenn, J., et al. 2014, ApJ, 789, L36 [NASA ADS] [CrossRef] [Google Scholar]
All Tables
All Figures
|
Fig. 1 CO 6−5 moment maps. Top: integrated intensity (mom0) where contours are 0.6 × (1, 4, 7, 10, 13, 16, 19, 22, 25) Jy km s-1 beam-1. Colours range from 0 to 15 Jy km s-1 beam-1. The dashed line marks the orientation of the molecular jet (see text for details). Centre: velocity field (mom1) where contours (and colours) range from 1700 km s-1 to 1820 km s-1 in steps of 10 km s-1. Bottom: map of the one-dimensional velocity dispersion (mom2), i.e. the FWHM line width of the spectrum divided by 2.35 for a Gaussian line profile. Contours are 4.4 × (1, 3, 5, 7, 9, 11, 13) km s-1 and colours range from 0 to 60 km s-1. The cross indicates the position of the 345 GHz continuum peak (Aalto et al. 2016). How the moment maps were constructed is described in Sect. 3. |
| In the text | |
|
Fig. 2 Central CO 6−5 spectrum where the high velocity gas is indicated in blue and red. |
| In the text | |
|
Fig. 3 Left: CO 3–2 integrated intensity image where emission close to systemic velocity (1700−1760 km s-1) is shown in greyscale. The high-velocity (±80 to ±150 km s-1) emission from the molecular jet is shown in contours (red and blue show the velocity reversals). The CO 3–2 beam ( |
| In the text | |
|
Fig. 4 Two-component model for the dust SED. It consists of a hot compact (0.̋14) component with Td = 100 K and an extended (1.̋5) component with Td = 40 K. For a gas-to-dust ratio the H2 column densities are N(H2) = 3 × 10²² and 2 × 10²², respectively. Luminosities are 1.1 × 10⁹L⊙ for the compact component and 2.2 × 10⁹L⊙ for the extended one. The observed SED points are marked as red squares and were taken from http://ned.ipac.caltech.edu/forms/photo.html. We used a modified black body to produce the SED. We calculate an optical depth at each wavelength and then we determine the dust temperature (modified by the optical depth). The mass absorption coefficients used can be found in González-Alfonso et al. (2014). We assume a standard gas-to-dust ratio of 100. |
| In the text | |
|
Fig. 5 CO 6−5 PV diagrams. Top: PA = 135° close to the major axis of the nuclear disk. The curves show the Keplerian rotation curves of a 106, 3 × 10⁶, and 6 × 10⁶M⊙ SMBH. Bottom: cut perpendicular (PA = 45°) to the nuclear disk. The contour levels are 25 × (1, 2, 3) mJy beam-1. Colours range from 25 to 90 mJy beam-1. A velocity of 0 km s-1 corresponds to 1743 km s-1. |
| In the text | |
|
Fig. 6 Position-velocity (PV) diagram along the north–south axis. The contour levels are 25 × (1, 2, 3) mJy beam-1. Colours range from 25 to 90 mJy beam-1. |
| In the text | |
Current usage metrics show cumulative count of Article Views (full-text article views including HTML views, PDF and ePub downloads, according to the available data) and Abstracts Views on Vision4Press platform.
Data correspond to usage on the plateform after 2015. The current usage metrics is available 48-96 hours after online publication and is updated daily on week days.
Initial download of the metrics may take a while.