| Issue |
A&A
Volume 573, January 2015
|
|
|---|---|---|
| Article Number | A63 | |
| Number of page(s) | 13 | |
| Section | Interstellar and circumstellar matter | |
| DOI | https://doi.org/10.1051/0004-6361/201424721 | |
| Published online | 18 December 2014 | |
Herschel/PACS view of disks around low-mass stars and brown dwarfs in the TW Hydrae association⋆,⋆⋆
1
Purple Mountain Observatory, Chinese Academy of Sciences,
2 West Beijing Road, 210008
Nanjing,
PR China
e-mail:
yliu@pmo.ac.cn
2
Key Laboratory for Radio Astronomy, Chinese Academy of Sciences,
2 West Beijing Road,
210008
Nanjing, PR
China
3
Kavli Institute for Astronomy and Astrophysics, Peking University,
Yi He Yuan Lu 5, Haidian Qu,
100871
Beijing, PR
China
4
Tsinghua University, Shuang Qing Lu 30, Haidian Qu, 100084
Beijing, PR
China
5
Department of Astrophysical Sciences, Princeton
University, 4 Ivy Lane, Peyton
Hall, Princeton,
NJ
08544,
USA
6
Department of Physics and Astronomy, Bucknell
University, Lewisburg, PA
17837,
USA
7
Harvard-Smithsonian Center for Astrophysics, 60 Garden St., MS 78,
Cambridge,
MA
02138,
USA
8
Department of Astronomy, The University of Texas at
Austin, Austin,
TX
78712,
USA
9
Institute for Astronomy, University of Hawaii at Manoa,
2680 Woodlawn Dr.,
Honolulu, HI
96822,
USA
10
Lowell Observatory, 1400 West Mars Hill Road, Flagstaff, AZ, 86001,
USA
11
Leiden Observatory, Leiden University,
PO Box 9513,
2300 RA
Leiden, The
Netherlands
12
Max-Planck-Institut für
Extraterrestrische Physik, Giessenbachstrasse 1, 85748
Garching,
Germany
Received: 31 July 2014
Accepted: 17 October 2014
We conducted Herschel/PACS observations of five very low-mass stars or brown dwarfs located in the TW Hya association with the goal of characterizing the properties of disks in the low stellar mass regime. We detected all five targets at 70 μm and 100 μm and three targets at 160 μm. Our observations, combined with previous photometry from 2MASS, WISE, and SCUBA-2, enabled us to construct spectral energy distributions (SEDs) with extended wavelength coverage. Using sophisticated radiative transfer models, we analyzed the observed SEDs of the five detected objects with a hybrid fitting strategy that combines the model grids and the simulated annealing algorithm and evaluated the constraints on the disk properties via the Bayesian inference method. The modeling suggests that disks around low-mass stars and brown dwarfs are generally flatter than their higher mass counterparts, but the range of disk mass extends to well below the value found in T Tauri stars, and the disk scale heights are comparable in both groups. The inferred disk properties (i.e., disk mass, flaring, and scale height) in the low stellar mass regime are consistent with previous findings from large samples of brown dwarfs and very low-mass stars. We discuss the dependence of disk properties on their host stellar parameters and find a significant correlation between the Herschel far-IR fluxes and the stellar effective temperatures, probably indicating that the scaling between the stellar and disk masses (i.e., Mdisk ∝ M⋆) observed mainly in low-mass stars may extend down to the brown dwarf regime.
Key words: stars: low-mass / circumstellar matter / brown dwarfs / protoplanetary disks
Herschel is an ESA space observatory with science instruments provided by European-led Principal Investigator consortia and with important participation from NASA.
Appendix A is available in electronic form at http://www.aanda.org
© ESO, 2014
1. Introduction
Circumstellar disks form as a natural result of angular momentum conservation during the early phase of star formation, i.e., collapse of rotating protostellar cores (Shu et al. 1987). They gradually lose mass and eventually dissipate through complex mechanisms such as accretion, photo-evaporation, and planet formation (e.g., Alexander et al. 2006; Balog et al. 2008; Williams & Cieza 2011). How brown dwarfs and very low-mass stars form is an interesting question in the field of star formation and remains a subject of debate although several theories have been proposed, for instance, a scaled down version of star formation processes, gravitational instabilities in disks and ejection of the stellar embryo (e.g., Luhman 2012; Chabrier et al. 2014). The disk properties of the (sub)stellar objects play a crucial role in understanding their formation. Numerous observations of brown dwarfs in recent years have detected disks and envelopes with properties similar to those found in T Tauri stars, suggesting that brown dwarfs may form in a similar way to hydrogen-burning stars (e.g., Liu et al. 2003; White & Basri 2003; Apai et al. 2005; Scholz et al. 2006; André et al. 2012; Harvey et al. 2012a,b; Joergens et al. 2013). Despite this progress, more thorough disk comparisons between the properties of disks in different stellar mass regimes are required to obtain a clear view of the formation mechanism of brown dwarfs and very low-mass stars.
For comparative studies between clusters, one of the foundational regions is the nearby TW Hya association (TWA, Webb et al. 1999). Comparing the stellar temperatures and luminosities of TWA members that have been identified to pre-main sequence tracks yields ages of ~7–10 Myr (Weinberger et al. 2013; Ducourant et al. 2014), young enough that ~20% of the primordial disks still exist but old enough that the surviving disks have likely undergone significant evolution. The membership of TWA still remains incomplete. Given its relatively old age and proximity to the earth, the TWA is an ideal place for studying the properties of disks and disk evolution in the low stellar mass regime (Looper et al. 2010a; Schneider et al. 2012).
The mass is one of the most important parameters of a disk because it sets the critical condition of whether giant planets can form within the disk. Most measurements of disk masses have been obtained from the (sub-)millimeter (mm) range (e.g., Andrews & Williams 2005; Andrews et al. 2013; Mohanty et al. 2013). Since massive disks are almost optically thin at (sub)-mm wavelengths, the measured continuum flux can be directly converted into a disk mass, with a relative accuracy that is dependent on a similarity in grain growth, composition, and disk structure, as well as on the gas-to-dust mass ratio. For very low-mass stars and brown dwarfs, there are only a few measurements of disk masses because of the sensitivity limits of ground-based sub-mm continuum observations. However, far-infrared (far-IR) wavelengths accessible by Herschel/PACS have been successfully used to estimate disk masses of very low-mass stars and brown dwarfs because most parts of the disk in this case become optically thin in the far-IR and are much brighter in the far-IR than in the sub-mm (Harvey et al. 2012a,b). Moreover, far-IR measurements supplemented with near- and mid-IR observations provide additional constraints on the structure of circumstellar disks.
In this paper, we focus on the PACS detections of five disk-bearing low-mass stars and brown dwarfs in the TWA. Our goal is to characterize the disk properties around these low stellar mass objects and try to compare the structure of disks in different stellar mass regimes.
2. Sample and observations
2.1. Sample properties
Our sample consists of five low-mass members of the TWA that do not have existing far-IR photometry, i.e., TWA 30A (Looper et al. 2010b), TWA 30B (Looper et al. 2010a), TWA 31, TWA 32 (Shkolnik et al. 2011), and TWA 34 (Schneider et al. 2012). Object properties are described in Table 2. The spectral types of our sample lie in the range of [M4, ~M6.5], corresponding to very low-mass stars or brown dwarfs according to theoretical evolutionary models (Chabrier et al. 2000). We derive the (sub)stellar temperatures using the spectral type to temperature conversion presented in Herczeg & Hillenbrand (2014). For TWA 31, we adopted a distance of 110 pc estimated by Shkolnik et al. (2011) under an assumption of its membership in the TWA. Distances for the four other objects are obtained from dynamical modeling of the TWA by Ducourant et al. (2014). We fit the photospheric emission of each target using the grid of BT-Settl models (Allard et al. 2012) with corresponding temperature and distance, thereby determining the (sub)stellar luminosity from the best-fit model deduced with a χ2 minimization. In this procedure, we assume solar metallicity, a gravity of log g = 3.5, and no interstellar extinction for all the targets. The fluxes at the 2MASS wavelengths are assumed to follow the phototsphere. In some cases such as TWA 30A, we also presume no excess in the WISE 3.4 μm band. The uncertainty in luminosity is dominated by errors in the dynamical distance calculations, which are typically quoted as ~10%, see Table 2.
TWA 32 is a  , near-equal mass binary (Shkolnik et al. 2011). In our analysis, we assume that only one of the two stars in the system retains a disk, similar to the Hen 3-600 and HD 98800 multiple star systems in the TWA (Andrews et al. 2010). The optical/near-IR photometry used for spectral energy distribution (SED) modeling (see Sect. 3) therefore should be adjusted to properly eliminate the contribution from the binary companion. We first fit the photospheric emission of the whole system, then altered the photometry by subtracting half of the best-fit photospheric flux at each wavelength.
Rich emission line spectra from TWA 30A and TWA 30B and strong Hα emission from TWA 31 indicate ongoing accretion (Looper et al. 2010a,b; Shkolnik et al. 2011). The Hα line equivalent widths for TWA 32 and TWA 34 (Shkolnik et al. 2011; Schneider et al. 2012) are consistent with expectations for the chromospheric activity of young mid-M dwarfs (White & Basri 2003), although in some cases accretion may not produce bright Hα emission. Looper et al. (2010a) found that the near-IR excess of TWA 30B is highly variable over timescales of a day. They suggested a highly inclined disk around this interesting object that causes changes in extinction induced by spatial variations in the disk structure rotating into our line of sight and out of it. The stellar luminosity cannot be empirically calculated from optical or near-IR photometry in this case because of obscuration by the nearly edge-on disk. Therefore, we infer a luminosity of log L/L⊙ = −1.2 ± 0.2 for TWA 30B based on the luminosities of other stars in the TWA with a similar spectral type, as calculated in this paper and by Herczeg & Hillenbrand (2014).
Observation log.
Target properties and IR photometry of detected TWA disks.
2.2. Observational setup
We used Herschel/PACS (Pilbratt et al. 2010; Poglitsch et al. 2010) to obtain far-IR photometry of five low-mass members of the TWA. The light in PACS is split into blue and red channels by a dichroic filter at ~120 μm. The integration time in the blue channel was split evenly between imaging with the 70 and 100 μm (see texp in Table 1). The red channel images photons with a central wavelength of 160 μm.
The PACS images were obtained with eight scan legs of 3′ each with steps of 4′′ at orientation angles of 70 and 110°. The spatial resolution was about 5′′ at 70 μm and 10′′ at 160 μm. The data were processed in the Herschel interactive processing environment (HIPE, version 6.0) with standard reduction routines.
2.3. Source flux determination
Fluxes are extracted from apertures of two pixels in radius, and subsequently corrected for the encircled energy fraction (0.55, 0.47, and 0.44 at 70, 100, and 160 μm) within the extraction region. The background was averaged in an annulus between 60–72′′ from the target. The locations of the detected emission are consistent with the object location to within the ~ 1−2′′ pointing accuracy of the observations.
The photometric flux densities and their 1σ errors of the five detected targets are summarized in Table 2. The absolute flux calibration is accurate to ~ 5%. The typical offset from the nominal position, ~ 2′′, corresponding to ~ 1 pixel in the image, is essentially identical in all wavelength channels and is well within the typical Herschel pointing uncertainty.
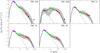 |
Fig. 1 Spectral energy distributions of the brown dwarf disks. The dots depict the photometry taken with 2MASS (purple), WISE (green), and Herschel/PACS (red). The upside down triangles show the 3σ upper limits measured with PACS and SCUBA-2. The best-fit models are indicated as black solid lines, whereas the dashed lines represent the photospheric emission levels. The gray lines denote all the models that are within the uncertainties given in Table 3, showing the constraints of the best fit models for each object. To deduce the uncertainties of model parameters with Bayesian analysis, we only take the models calculated in the grid into account, see Sect. 3. Notes: (1) for the binary TWA 32, the near-IR photometry shown in this figure are F2MASS J = 42.6 mJy, F2MASS H = 46.1 mJy and F2MASS K = 41.2 mJy. These values are different from the observed ones of the whole binary system, see Sect. 2.1. (2) For TWA 30B, all the models indicated as gray lines feature i = 75°. Models with other inclinations are not shown because the derivation of uncertainties in Rin, Mdisk, β and h100 is based on models with i = 75° in the grid; see Sect. 3 for an explanation. |
Validity ranges from the Bayesian analysis for the disk parameters.
3. SED modeling
All five objects have photometry from the Two Micron All Sky Survey (2MASS, Skrutskie et al. 2006) and the Wide-Field Infrared Explorer (WISE, Wright et al. 2010) surveys. For TWA 30A and TWA 30B, Mohanty et al. (2013) also derived upper limits of the flux in the sub-mm from SCUBA-2. We modeled the broadband SEDs of our targets using the radiative transfer code MC3D developed by Wolf (2003b) in order to characterize the structure of their surrounding disks.
Dust distribution in the disk: we introduce a parametrized flared disk in which dust and gas are well mixed and homogeneous throughout the system. This model has been successfully used to explain the observed SEDs of a large sample of young stellar objects and brown dwarfs (e.g., Wolf et al. 2003; Sauter et al. 2009; Harvey et al. 2012a). For the dust in the disk, we assume a density structure with a Gaussian vertical profile ![\begin{equation} \rho_{\rm{dust}}=\rho_{0}\left(\frac{R_{*}}{\varpi}\right)^{\alpha}\exp\left[-\frac{1}{2}\left(\frac{z}{h(\varpi)}\right)^2\right], \\ \label{dust_density} \end{equation}](/articles/aa/full_html/2015/01/aa24721-14/aa24721-14-eq78.png) (1)and a power-law distribution for the surface density
(1)and a power-law distribution for the surface density 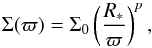 (2)where ϖ is the radial distance from the central star measured in the disk midplane, and h(ϖ) is the scale height of the disk. The disk extends from an inner radius Rin to an outer radius Rout. The Rout is fixed in the modeling process because the choice of this parameter makes essentially no difference to the synthetic SEDs in the simulated wavelength ranges (Harvey et al. 2012a). For the binary TWA 32, we take a value of 30 AU that is expected to be less than the separation within the system. We set Rout = 100 AU for the rest models. To allow flaring, the scale height follows the power law
 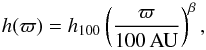 (3)with the exponent β describing the extent of flaring and the scale height h100 at a distance of 100 AU from the central star. The indices α, p, and β are codependent, i.e., p = α − β. To reduce the dimensionality of the parameter space, we fix p = 1 in the simulation since pure SED modeling cannot place tight constraints on this parameter.
Dust properties: we consider the dust grains to be a homogeneous mixture of amorphous silicate and carbon with a mean density of ρgrain = 2.5 g cm-3. The grain size distribution is given by the standard power law dn(a) ∝ a-3.5da with minimum and maximum grain sizes amin = 0.1 μm and amax = 100 μm, respectively. We set a low value for amin to ensure that its exact value has a negligible impact on the synthetic SEDs. Since there is no information about the maximum grain size, such as the (sub-)mm spectral index, in the five target disks, we increase amax from the interstellar medium’s value 0.25 μm (Mathis et al. 1977) to 100 μm to account for grain growth effects that are commonly observed in disks around T Tauri stars and brown dwarfs (e.g., Ricci et al. 2010, 2012; Broekhoven-Fiene et al. 2014). With the Mie theory, we calculate the optical properties of each dust component using the complex refractive indices of amorphous silicate and carbon published by Jäger et al. (1994), Dorschner et al. (1995) and Jäger et al. (1998). Relative abundances of 75% silicate and 25% carbon are used to derive the weighted mean values of dust grain parameters, for instance the absorption and scattering cross section (Wolf 2003a).
Heating sources: the disk is assumed to be passively heated by stellar irradiation (e.g., Chiang & Goldreich 1997). We take the BT-Settl atmosphere models with log g = 3.5 as the incident substellar spectra (Allard et al. 2012). The radiative transfer problem is solved self-consistently considering 100 wavelengths, which are logarithmically distributed in the range of [0.05 μm, 2000 μm].
Fitting method: the task of SED fitting was performed with a hybrid strategy that combines the database method and the simulated annealing (SA) algorithm (Kirkpatrick et al. 1983). A common method used to fit observational data is to precalculate a model database on a huge grid in parameter space. The fitting result can be identified very fast by evaluating the merit function (i.e., the χ2-distribution), once the database is built. The model grid can give us an overview of the fitting quality in different parameter domains through Bayesian analysis (Pinte et al. 2008). However, because the number of grid points increases substantially with the dimensionality, the grid resolution always has to be coarse owing to finite computational resources and limited time. SA is a versatile optimization technique. Based on the Metropolis-Hastings algorithm, it creates a random walk, i.e. a Markov chain, through the parameter space, thereby gradually minimizing the discrepancy between observation and prediction by following the local topology of the merit function. This approach has specific advantages for high-dimensionality optimization because no gradients need to be calculated and local optimum can be overcome intrinsically regardless of the dimensionality. We first ran a large grid of disk models for each source considering a broad range of disk parameters. Then SA was used to improve the result by taking the best fit in the model grid as the starting point of the Markov chain. Moreover, the initial step size of each dimension in the optimization process was set to be much smaller than the grid spacing. This kind of methodology makes use of the advantages of both database method and SA approach and has already been demonstrated to be successful for SED analysis (Liu et al. 2012, 2013).
Table A.1 summarizes the grid points of disk parameters calculated in the database. The grid adds up to a total number of 18 144 models for each target, whereas the length of a Markov chain is typically ~ 1000 models when the SA algorithm is aborted. The final fitting results are displayed in Fig. 1. The best-fit models are indicated as solid lines, whereas the dashed lines represent the photospheric emission level. The corresponding parameter sets are listed in Table 3. A comparison between the final best-fit parameter value and the grid points in the database can quantitatively evaluate the improvements brought by SA to the modeling strategy. Taking TWA 32 as an example, the best-fit h100,best−fit = 9 AU. The explored value of h100 that is closest to h100,best−fit in the database is 8 AU (see Table A.1), therefore, the distance between the final fit and the best solution in the database is Δ h100 = 1 AU. We notice that the adjustments introduced with SA to the best fits in the database for some targets (e.g., TWA 30A) are not too large, indicating that databases can generally provide acceptable results. Cases like TWA 30B demonstrate that optimization with SA is indeed desired for increasing the fitting quality. We emphasize that the best fits presented in Fig. 1 cannot be considered a unique solution since some of the model parameters are degenerate in the fitting process.
Bayesian analysis: despite the model degeneracy, previous studies have shown that modeling SEDs with broad wavelength coverage can constrain the mass and geometry of disks around brown dwarfs and low-mass stars (e.g., Harvey et al. 2012a,b; Olofsson et al. 2013; Spezzi et al. 2013). In particular, the Bayesian inference approach provides a statistical way to analyze the potential correlations and interplay between different parameters. The goodness of the fit is defined through a reduced  . The relative probability of a given model is proportional to exp(
 ) in our case because we choose uniform a priori probabilities for each disk parameter. All probabilities are normalized at the end of the procedure so that the sum of the probabilities of all models is equal to 1. The probability distributions of each parameter in the range of values explored in the model grid are shown in several figures in the Appendix. With the results from Bayesian analysis, it is clear which parameters are well constrained, e.g., when the probability distribution is sharply concentrated within a relatively narrow range. In contrast, only loose constraints can be obtained if the probabilities of the parameter are flatly distributed. Table 3 also gives the ranges (quoted in parenthesis) of validity for each parameter from its probability distribution, corresponding to regions where P> 0.5 × PMax.
For TWA 30B, by using a luminosity of log L/L⊙ = −1.2 ± 0.2 (see Sect. 2.1) in the modeling, we implicitly introduce a prior probability distribution for the disk inclination (i.e., non-uniform), because all the models with i< 60° will significantly overpredict the near- and mid-IR fluxes. Therefore, the Bayesian probability distributions for Rin, h100, Mdisk, and β shown in Fig. A.2 are deduced from analyzing models with i = 75° in the grid. The wide range of acceptable fits for TWA 30B shown in Fig. 1 appear discrepant with the observed photometry. The optimal model found from the local fit with SA is far from any point in the initial model grid. However, even in the local fit, only 22 of 1000 sets of parameters yielded a χ2 below the confidence threshold, an unusually small number. The resulting optimal parameter space is very tight and likely not representative of the true uncertainties in the parameters, especially since the star is only detected in scattered light. The uncertainties obtained from the Bayesian analysis of the grid very likely yields more realistic error bars, despite some poor fits to the observed data within that range.
4. Discussion
We compiled observed SEDs of five low-mass stars or brown dwarfs in the TWA by combining our Herschel/PACS photometry with previous data taken with 2MASS and WISE, and also for TWA 30A and TWA 30B with mm measurements. We exploited the broadband SEDs to characterize disk properties using sophisticated radiative transfer technique and a well-tested hybrid fitting approach. We also evaluated the constraints on different disk parameters through Bayesian analysis.
4.1. The disk properties of the targets
The Bayesian probability distributions indicate poor constraints on the disk inclination for most objects. Almost all the values sampled by our grid feature similar chances to reproduce the data well. This is consistent with previous findings since the determination of this parameter is based purely on the SED (e.g., Chiang & Goldreich 1999; Robitaille et al. 2007; Harvey et al. 2012a). Our results support the interpretation that the TWA 30B disk is viewed nearly edge-on. The quality of the SED fit drops significantly if the orientation is a small step outside the validity range presented here (i.e., i< 60°).
The disk inner radius is sensitive to the wavelength point at which the IR excess is dominated by the disk (Harvey et al. 2007). Our model grid explores different values for this parameter logarithmically distributed in the range of [1, 200]Rsub, where Rsub refers to the dust sublimation radius determined using the empirical relation Rsub = R⋆(Tsub/Teff)2.085 from Whitney et al. (2004) for individual targets, and Tsub is the dust sublimation temperature and was set to 1600 K. Because the observed SEDs are well sampled in the near- and mid-IR domain, this parameter is relatively well constrained for all objects. None of the five objects has a clear characteristic of transition disks with large (e.g., AU-scale) inner holes (Williams & Cieza 2011).
The flaring index β and the scale height h100 are key parameters for describing the disk geometry, which are thought to be different for disks around solar-type stars and their lower mass counterparts like brown dwarfs. For instance, Szűcs et al. (2010) investigated the Spitzer/IRAC and MIPS 24 μm photometries of ~ 200 stars in the Chamaeleon I star-forming region and found that disks around lower mass stars (spectral type later than M4.75) are generally flatter than the case of higher mass stars (spectral type earlier than M4.5). Coherent multiwavelength modeling suggests a typical flaring index β ~ 1.25 for T Tauri disks (Wolf et al. 2003; Walker et al. 2004; Sauter et al. 2009; Madlener et al. 2012; Gräfe et al. 2013). Harvey et al. (2012a) report PACS measurements of about 50 very low-mass stars and brown dwarfs with spectral types ranging from M3 to M9 in nearby regions. Through detailed modeling effort, they obtained a typically small (1.05–1.2) flaring index, which is consistent with our results for objects with spectral types similar to their sample. Theoretical models predict that disks around cooler stars should be more extended in the vertical direction (Walker et al. 2004). However, our findings, together with previous studies (e.g., Harvey et al. 2012a; Alves de Oliveira et al. 2013; Olofsson et al. 2013), show that both the T Tauri disks and brown dwarf disks feature similar scale heights, i.e., 5−20 AU. The small flaring index (βbest−fit = 1.01) and scale height (h100,best−fit = 2 AU) indicate a flat and thin disk around TWA 30A, consistent with the effect of dust settling in disks. The disk of TWA 30B also shows signs of evolution, i.e., a small amount of flaring (βbest−fit = 1.02). Given the relatively old age of the TWA, our interpretations on the disk structure of TWA 30A and TWA 30B are consistent with theories of circumstellar disk evolution.
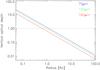 |
Fig. 2 Optical depth in the vertical direction as a function of radius at Herschel far-IR wavelengths for a typical brown dwarf disk model with log10Mdisk/M⊙ = −4.5 and dust properties including grain size distribution identical to those used in the SED simulation, see Sect. 3. |
Photometry in the (sub-)mm is the best tool for studying the disk mass since the emission in this wavelength regime is almost optically thin and in the clear Rayleigh-Jeans part of the SED. However, the very faint (sub-)mm fluxes of brown dwarf disks (or disks around very low-mass stars) make their characterization extremely challenging, leading to a very small number of such detections to date (Scholz et al. 2006; Ricci et al. 2012, 2013; Mohanty et al. 2013). As shown by Harvey et al. (2012a), Herschel far-IR observations provide an alternative way to estimate the masses of faint disks as in our case.
The five targets investigated here are detected with PACS at all wavelengths (70 μm, 100 μm, and 160 μm), except for TWA 30A and TWA 31 at 160 μm. Moreover, the observations taken with SCUBA-2 can place stringent upper limits on the disk masses for TWA 30A and TWA 30B. The Bayesian probability distributions of Mdisk exhibit an obvious peak, with the most probable disk masses close to the best-fit values for all sources, indicating strong constraints on this parameter. The validity range of Mdisk (10-6−10-4M⊙) is far below the typical masses (i.e., 10-3−10-1M⊙) of disks around T Tauri stars located in various regions with ages ranging from ~ 1−2 Myr (e.g., Taurus and Ophiuchus, Andrews & Williams 2005, 2007; Andrews et al. 2009), through ~ 2−3 Myr (e.g., IC348, Lee et al. 2011), and to ~ 5−11 Myr (e.g., TWA and Upper Scorpius, Mohanty et al. 2013; Mathews et al. 2012; Carpenter et al. 2014).
The lower disk masses around very low-mass stars and brown dwarfs are consistent with previous results from case studies and surveys (e.g., Broekhoven-Fiene et al. 2014; Harvey et al. 2012a). Nevertheless, we should re-examine this conclusion because the determination of disk mass with far-IR photometry may be considered as lower limits owing to optical depth effects. As an illustration, Fig. 2 shows the optical depth perpendicular to the disk as a function of radius, indicating that the inner region (<a few AU) of typical brown dwarf disks are optically thick at Herschel wavelengths. The large portion of optically thin far-IR emission demonstrates that PACS bands are long enough to provide reasonable disk mass estimation of brown dwarfs. The model presented in Fig. 2 should be considered as the “least favorable” example since the assumed disk mass is higher than any of the best-fit results (see Table 3). Therefore, the best-fit models are in principle less optically thick in the vertical direction than the case shown in Fig. 2. Future ALMA observations in the (sub-)mm regime will enable more accurate masses to be determined for these (very) low-mass disks.
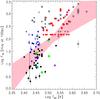 |
Fig. 3 Fluxes at Herschel 70 μm (F70) as a function of the stellar temperature (Teff). Data points are collected from Harvey et al. (2012a,b) for a mix of nearby regions (black squares), Olofsson et al. (2013) for Chameleon I (red circles), Spezzi et al. (2013) for Chameleon II (gray stars), Alves de Oliveira et al. (2013) for ρ Ophiuchi (blue crosses), and from Riviere-Marichalar et al. (2013, purple diamonds) and our program (green diamonds) for the TWA. Upper limits are indicated as upside down triangles with the same color scheme. The 100 μm fluxes reported by Olofsson et al. (2013) were converted to 70 μm fluxes by multiplying them with a factor of 1.12, the median from very low-mass stars with detections at both wavelengths. The shaded region marks 95% confidence intervals on the log Teff ~ log F70 relation, derived from a Bayesian linear regression analysis that takes the errors and upper limits of measurements into account (Kelly 2007). |
4.2. Dependence on the stellar properties
Many observations have demonstrated that disk properties, such as the accretion rate and dust processing speed, depend on their host stellar properties like the effective temperature (Teff) and mass (Muzerolle et al. 2005; Herczeg et al. 2009; Pascucci et al. 2009; Riaz et al. 2009). Correlation analysis is therefore very common in disk studies, although the derivation of both disk and stellar properties always depends on model assumptions. The Mdisk − M⋆ correlation study is of particular interest because any correlation between these two quantities has important implications for planet formation theories.
Andrews et al. (2013) analyzed for the first time mm continuum photometry of a sample of ~ 200 Class II disks that is statistically complete for stellar hosts with spectral types earlier than M8.5 in the Taurus molecular cloud. They find a strong correlation between the mm luminosity (a good proxy for disk mass) and the spectral type of the host star, as well as the stellar mass. Olofsson et al. (2013) derived the disk mass of 17 low-mass M-type stars from modeling their broadband SEDs, including Herschel far-IR photometry. However, they did not find a clear trend among the Mdisk-M⋆ diagram, probably because of the detection biases and the optical depth effect in the far-IR. The disk mass is not a direct observable, and its estimation needs additional assumptions like the dust opacity. Therefore, it is not appropriate to analyze the modeling results collected from the literature that make different assumptions.
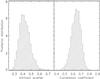 |
Fig. 4 Marginal posterior distributions of the intrinsic dispersion around the regression line and linear correlation coefficient. |
Considering the factors mentioned above, we instead compared the flux (F70) at the Herschel 70 μm with the effective temperature of the host stars. In Fig. 3, we show the results from our program and from the literature (Harvey et al. 2012a,b; Olofsson et al. 2013; Spezzi et al. 2013; Alves de Oliveira et al. 2013; Riviere-Marichalar et al. 2013). All fluxes are scaled assuming a distance of 100 pc. The conversion from spectral type to temperature from Herczeg & Hillenbrand (2014) was used to calculate Teff in a consistent manner. The stellar effective temperature and 70 μm flux are correlated, though with an especially large dispersion at low temperatures. We used Spearman’s rank correlation coefficient (ρ) and its two-sided probability (P) to test the correlation (Kim et al. 2009). The resulting ρ = 0.685 and p ≪ 0.05 suggest a statistically significant correlation between the amount of Herschel far-IR emission and the stellar temperature. This conclusion is also supported by Pearson’s linear correlation coefficient of γ = 0.728, a value close to 1.
To take the measurement errors and upper limits into account, we used the Bayesian linear regression method developed by Kelly (2007) to quantify the correlation, assuming an intrinsic linear dependence between log Teff and log F70. The errors of Teff are assumed to be 100 K for all targets in this analysis. The results are presented in Fig. 4. The histogram of the associated correlation coefficient in this figure confirms the tight relationship determined from the correlation tests. The lefthand panel of Fig. 4 shows the variance in the residuals between the estimated regression line and the dependent variable F70, reflecting typical dispersion in F70 around the regression line at any given Teff. The 95% pointwise confidence intervals on the regression line are indicated as shaded regions in Fig. 3. As Herschel160 μm images of faint disks are easily contaminated with the extended emission from the background, sources with solid detections at 160 μm so far are not sufficient in number for this correlation analysis.
The effective temperature is a good proxy for the stellar mass (M⋆) of low-mass stars and brown dwarfs, because the pre-main-sequence tracks of low-mass stars and brown dwarfs at ages 1 ~ 10 Myr are perpendicular to the temperature axis, i.e., without any obvious turning tendency. As shown in Fig. 2, PACS 70 μm emission approximately probe the brown dwarf disk mass, affected mainly by the optically thick emission from the disk inner region and limited by the fact that 70 μm is not completely into the Rayleigh-Jeans part of the SED. Given the high ratio of optically thin-to-thick regions of the disk, the uncertainty of disk mass estimated from far-IR photometry should not exceed one order of magnitude. This can be justified by the validity ranges of Mdisk deduced from Bayesian analysis (see Table 3). Therefore, the F70 ~ Teff correlation implies that the linear scaling Mdisk ∝ M⋆ observed mainly in T Tauri and Herbig AeBe stars (Andrews et al. 2013) may extend down to the brown dwarf regime. This is in line with the reliable finding from (sub-)mm studies that the disks around brown dwarf hosts are intrinsically low-mass (e.g., Klein et al. 2003; Scholz et al. 2006; Ricci et al. 2013; Broekhoven-Fiene et al. 2014).
The Mdisk ∝ M⋆ relation, if present, suggests that the disk-to-host mass ratio is basically independent of M⋆ for brown dwarfs, which agrees with the result found for T Tauri stars (Williams & Cieza 2011). Our correlation study is based on a sample of targets that span a wide range of age (i.e., with different evolutionary stages), which may play a role of broadening the observed relation. Moreover, the detection bias can also affect the correlation since most other samples have worse sensitivity to disk mass compared to TWA sources because they are located at larger distances and observed with shorter exposure times. For example, the data points taken from Spezzi et al. (2013) and Olofsson et al. (2013) are based on the Herschel Gould Belt survey (André et al. 2010) that is not sensitive enough to detect very faint disks as compared to dedicated projects like our program and the one in Harvey et al. (2012a). The ambiguity of non-detections by current PACS observations may cause additional spread in F70 and in turn weaken the Mdisk ~ M⋆ relation. Therefore, we emphasize that the correlation between Mdisk and M⋆ speculated here is not robust because it relies not only on the completeness and depth of the far-IR survey but also on the accuracy of the determined disk mass, both of which cannot be directly included in the analysis especially given that the available data are indeed limited. Deeper far-IR and more sensitive (sub-)mm photometry survey are required to improve constraints on the underlying morphology of the relationship between Mdisk and M⋆ in the low stellar mass regime.
5. Summary
We measured far-IR photometry for disks around five low-mass stars and brown dwarfs in the TWA. By combining with previous measurements at shorter wavelengths, these new datasets enable us to construct observed SEDs with extended coverage, providing a valuable opportunity to investigate the properties of disks in the TWA. We performed detailed SED analysis for our targets with the radiative transfer code MC3D and the hybrid fitting approach. Using the Bayesian inference method, we evaluated the constraints on disk parameters obtained from the modeling effort.
Our results show that the disks around low-mass stars or brown dwarfs are generally flatter than their higher mass counterparts, but the range of disk mass extends to well below the value found in T Tauri stars. The radiative transfer simulation demonstrates that typical brown dwarf disks are vertically optically thin in far-IR emission over a large portion of radial distances, which indicates that the disk mass of brown dwarfs can be roughly probed by far-IR observation. A comparison between the Herschel far-IR photometry and the stellar temperature displays a significant correlation between these two quantities, suggesting that the linear scaling Mdisk ∝ M⋆ observed mainly in T Tauri and Herbig AeBe stars may exist down to the brown dwarf regime. With unprecedented capacity, future ALMA observations will be able to extend the SEDs to the mm wavelengths, which will help us to improve the constraints on the disk mass and geometry and therefore to better understand the formation and evolution of very low-mass stars and brown dwarfs.
Online material
Appendix A: Disk parameters for the model grids and Bayesian probability analysis
Disk parameters for the grids of models.
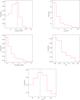 |
Fig. A.1 Probability distributions of model parameters for TWA 30A. The vertical dashed lines denote the best-fit values. |
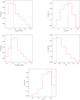 |
Fig. A.2 Probability distributions of model parameters for TWA 30B. The vertical dashed lines denote the best-fit values. |
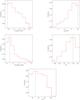 |
Fig. A.3 Probability distributions of model parameters for TWA 31. The vertical dashed lines denote the best-fit values. |
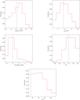 |
Fig. A.4 Probability distributions of model parameters for TWA 32. The vertical dashed lines denote the best-fit values. |
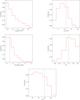 |
Fig. A.5 Probability distributions of model parameters for TWA 34. The vertical dashed lines denote the best-fit values. |
Acknowledgments
We thank the anonymous referee for valuable comments that improved the manuscript. We thank Hongchi Wang and Zhibo Jiang for useful discussions. Y.L. acknowledges the support by the Natural Science Foundation of Jiangsu Province of China (Grant No. BK20141046). G.J.H. is supported by the Youth Qianren Program of the National Science Foundation of China. This publication makes use of data products from the Wide-field Infrared Survey Explorer, which is a joint project of the University of California, Los Angeles, and the Jet Propulsion Laboratory/California Institute of Technology, funded by the National Aeronautics and Space Administration. PACS has been developed by a consortium of institutes led by MPE (Germany) and including UVIE (Austria); KU Leuven, CSL, IMEC (Belgium); CEA, LAM (France); MPIA (Germany); INAF- IFSI/OAA/OAP/OAT, LENS, SISSA (Italy); IAC (Spain). This work is supported by the Strategic Priority Research Program “The Emergence of Cosmological Structures” of the Chinese Academy of Sciences, Grant No. XDB09000000.
References
- Alexander, R. D., Clarke, C. J., & Pringle, J. E. 2006, MNRAS, 369, 229 [NASA ADS] [CrossRef] [Google Scholar]
- Allard, F., Homeier, D., Freytag, B., & Sharp, C. M. 2012, in EAS Pub. Ser. 57, eds. C. Reylé, C. Charbonnel, & M. Schultheis, 3 [Google Scholar]
- Alves de Oliveira, C., Ábrahám, P., Marton, G., et al. 2013, A&A, 559, A126 [NASA ADS] [CrossRef] [EDP Sciences] [Google Scholar]
- André, P., Men’shchikov, A., Bontemps, S., et al. 2010, A&A, 518, L102 [NASA ADS] [CrossRef] [EDP Sciences] [Google Scholar]
- André, P., Ward-Thompson, D., & Greaves, J. 2012, Science, 337, 69 [NASA ADS] [CrossRef] [PubMed] [Google Scholar]
- Andrews, S. M., & Williams, J. P. 2005, ApJ, 631, 1134 [NASA ADS] [CrossRef] [Google Scholar]
- Andrews, S. M., & Williams, J. P. 2007, ApJ, 671, 1800 [CrossRef] [Google Scholar]
- Andrews, S. M., Wilner, D. J., Hughes, A. M., Qi, C., & Dullemond, C. P. 2009, ApJ, 700, 1502 [NASA ADS] [CrossRef] [Google Scholar]
- Andrews, S. M., Czekala, I., Wilner, D. J., et al. 2010, ApJ, 710, 462 [NASA ADS] [CrossRef] [Google Scholar]
- Andrews, S. M., Rosenfeld, K. A., Kraus, A. L., & Wilner, D. J. 2013, ApJ, 771, 129 [NASA ADS] [CrossRef] [Google Scholar]
- Apai, D., Pascucci, I., Bouwman, J., et al. 2005, Science, 310, 834 [NASA ADS] [CrossRef] [PubMed] [Google Scholar]
- Balog, Z., Rieke, G. H., Muzerolle, J., et al. 2008, ApJ, 688, 408 [NASA ADS] [CrossRef] [Google Scholar]
- Broekhoven-Fiene, H., Matthews, B., Duchêne, G., et al. 2014, ApJ, 789, 155 [NASA ADS] [CrossRef] [Google Scholar]
- Carpenter, J. M., Ricci, L., & Isella, A. 2014, ApJ, 787, 42 [NASA ADS] [CrossRef] [Google Scholar]
- Chabrier, G., Baraffe, I., Allard, F., & Hauschildt, P. 2000, ApJ, 542, 464 [NASA ADS] [CrossRef] [Google Scholar]
- Chabrier, G., Johansen, A., Janson, M., & Rafikov, R. 2014, in Protostars and Planets VI, eds. H. Beuther et al. (University of Arizona Press), in press [arXiv:1401.7559] [Google Scholar]
- Chiang, E. I., & Goldreich, P. 1997, ApJ, 490, 368 [NASA ADS] [CrossRef] [Google Scholar]
- Chiang, E. I., & Goldreich, P. 1999, ApJ, 519, 279 [NASA ADS] [CrossRef] [Google Scholar]
- Cutri, R. M., et al. 2012, VizieR Online Data Catalog: II/311 [Google Scholar]
- Dorschner, J., Begemann, B., Henning, T., Jaeger, C., & Mutschke, H. 1995, A&A, 300, 503 [NASA ADS] [Google Scholar]
- Ducourant, C., Teixeira, R., Galli, P. A. B., et al. 2014, A&A, 563, A121 [NASA ADS] [CrossRef] [EDP Sciences] [Google Scholar]
- Gräfe, C., Wolf, S., Guilloteau, S., et al. 2013, A&A, 553, A69 [NASA ADS] [CrossRef] [EDP Sciences] [Google Scholar]
- Harvey, P., Merín, B., Huard, T. L., et al. 2007, ApJ, 663, 1149 [NASA ADS] [CrossRef] [Google Scholar]
- Harvey, P. M., Henning, T., Liu, Y., et al. 2012a, ApJ, 755, 67 [NASA ADS] [CrossRef] [Google Scholar]
- Harvey, P. M., Henning, T., Ménard, F., et al. 2012b, ApJ, 744, L1 [NASA ADS] [CrossRef] [Google Scholar]
- Herczeg, G. J., & Hillenbrand, L. A. 2014, ApJ, 786, 97 [NASA ADS] [CrossRef] [Google Scholar]
- Herczeg, G. J., Cruz, K. L., & Hillenbrand, L. A. 2009, ApJ, 696, 1589 [Google Scholar]
- Jäger, C., Mutschke, H., Begemann, B., Dorschner, J., & Henning, T. 1994, A&A, 292, 641 [NASA ADS] [Google Scholar]
- Jäger, C., Mutschke, H., & Henning, T. 1998, A&A, 332, 291 [NASA ADS] [Google Scholar]
- Joergens, V., Bonnefoy, M., Liu, Y., et al. 2013, A&A, 558, L7 [NASA ADS] [CrossRef] [EDP Sciences] [Google Scholar]
- Kelly, B. C. 2007, ApJ, 665, 1489 [NASA ADS] [CrossRef] [Google Scholar]
- Kim, K. H., Watson, D. M., Manoj, P., et al. 2009, ApJ, 700, 1017 [NASA ADS] [CrossRef] [Google Scholar]
- Kirkpatrick, S., Gelatt, C. D., & Vecchi, M. P. 1983, Science, 220, 671 [NASA ADS] [CrossRef] [MathSciNet] [PubMed] [Google Scholar]
- Klein, R., Apai, D., Pascucci, I., Henning, T., & Waters, L. B. F. M. 2003, ApJ, 593, L57 [NASA ADS] [CrossRef] [Google Scholar]
- Lee, N., Williams, J. P., & Cieza, L. A. 2011, ApJ, 736, 135 [NASA ADS] [CrossRef] [Google Scholar]
- Liu, M. C., Najita, J., & Tokunaga, A. T. 2003, ApJ, 585, 372 [NASA ADS] [CrossRef] [Google Scholar]
- Liu, Y., Madlener, D., Wolf, S., Wang, H., & Ruge, J. P. 2012, A&A, 546, A7 [NASA ADS] [CrossRef] [EDP Sciences] [Google Scholar]
- Liu, Y., Madlener, D., Wolf, S., & Wang, H.-C. 2013, RA&A, 13, 420 [Google Scholar]
- Looper, D. L., Bochanski, J. J., Burgasser, A. J., et al. 2010a, AJ, 140, 1486 [NASA ADS] [CrossRef] [Google Scholar]
- Looper, D. L., Mohanty, S., Bochanski, J. J., et al. 2010b, ApJ, 714, 45 [NASA ADS] [CrossRef] [Google Scholar]
- Luhman, K. L. 2012, ARA&A, 50, 65 [NASA ADS] [CrossRef] [Google Scholar]
- Madlener, D., Wolf, S., Dutrey, A., & Guilloteau, S. 2012, A&A, 543, A81 [NASA ADS] [CrossRef] [EDP Sciences] [Google Scholar]
- Mathews, G. S., Williams, J. P., Ménard, F., et al. 2012, ApJ, 745, 23 [NASA ADS] [CrossRef] [Google Scholar]
- Mathis, J. S., Rumpl, W., & Nordsieck, K. H. 1977, ApJ, 217, 425 [NASA ADS] [CrossRef] [Google Scholar]
- Mohanty, S., Greaves, J., Mortlock, D., et al. 2013, ApJ, 773, 168 [NASA ADS] [CrossRef] [Google Scholar]
- Muzerolle, J., Luhman, K. L., Briceño, C., Hartmann, L., & Calvet, N. 2005, ApJ, 625, 906 [NASA ADS] [CrossRef] [Google Scholar]
- Olofsson, J., Szűcs, L., Henning, T., et al. 2013, A&A, 560, A100 [NASA ADS] [CrossRef] [EDP Sciences] [Google Scholar]
- Pascucci, I., Apai, D., Luhman, K., et al. 2009, ApJ, 696, 143 [NASA ADS] [CrossRef] [Google Scholar]
- Pilbratt, G. L., Riedinger, J. R., Passvogel, T., et al. 2010, A&A, 518, L1 [CrossRef] [EDP Sciences] [Google Scholar]
- Pinte, C., Padgett, D. L., Ménard, F., et al. 2008, A&A, 489, 633 [NASA ADS] [CrossRef] [EDP Sciences] [Google Scholar]
- Poglitsch, A., Waelkens, C., Geis, N., et al. 2010, A&A, 518, L2 [NASA ADS] [CrossRef] [EDP Sciences] [Google Scholar]
- Riaz, B., Lodieu, N., & Gizis, J. E. 2009, ApJ, 705, 1173 [NASA ADS] [CrossRef] [Google Scholar]
- Ricci, L., Testi, L., Natta, A., & Brooks, K. J. 2010, A&A, 521, A66 [NASA ADS] [CrossRef] [EDP Sciences] [Google Scholar]
- Ricci, L., Testi, L., Natta, A., Scholz, A., & de Gregorio-Monsalvo, I. 2012, ApJ, 761, L20 [NASA ADS] [CrossRef] [Google Scholar]
- Ricci, L., Isella, A., Carpenter, J. M., & Testi, L. 2013, ApJ, 764, L27 [NASA ADS] [CrossRef] [Google Scholar]
- Riviere-Marichalar, P., Pinte, C., Barrado, D., et al. 2013, A&A, 555, A67 [NASA ADS] [CrossRef] [EDP Sciences] [Google Scholar]
- Robitaille, T. P., Whitney, B. A., Indebetouw, R., & Wood, K. 2007, ApJS, 169, 328 [NASA ADS] [CrossRef] [Google Scholar]
- Sauter, J., Wolf, S., Launhardt, R., et al. 2009, A&A, 505, 1167 [NASA ADS] [CrossRef] [EDP Sciences] [Google Scholar]
- Schneider, A., Song, I., Melis, C., Zuckerman, B., & Bessell, M. 2012, ApJ, 757, 163 [NASA ADS] [CrossRef] [Google Scholar]
- Scholz, A., Jayawardhana, R., & Wood, K. 2006, ApJ, 645, 1498 [NASA ADS] [CrossRef] [Google Scholar]
- Shkolnik, E. L., Liu, M. C., Reid, I. N., Dupuy, T., & Weinberger, A. J. 2011, ApJ, 727, 6 [NASA ADS] [CrossRef] [Google Scholar]
- Shu, F. H., Adams, F. C., & Lizano, S. 1987, ARA&A, 25, 23 [Google Scholar]
- Skrutskie, M. F., Cutri, R. M., Stiening, R., et al. 2006, AJ, 131, 1163 [NASA ADS] [CrossRef] [Google Scholar]
- Spezzi, L., Cox, N. L. J., Prusti, T., et al. 2013, A&A, 555, A71 [NASA ADS] [CrossRef] [EDP Sciences] [Google Scholar]
- Szűcs, L., Apai, D., Pascucci, I., & Dullemond, C. P. 2010, ApJ, 720, 1668 [NASA ADS] [CrossRef] [Google Scholar]
- Walker, C., Wood, K., Lada, C. J., et al. 2004, MNRAS, 351, 607 [NASA ADS] [CrossRef] [Google Scholar]
- Webb, R. A., Zuckerman, B., Platais, I., et al. 1999, ApJ, 512, L63 [NASA ADS] [CrossRef] [Google Scholar]
- Weinberger, A. J., Anglada-Escudé, G., & Boss, A. P. 2013, ApJ, 762, 118 [NASA ADS] [CrossRef] [Google Scholar]
- White, R. J., & Basri, G. 2003, ApJ, 582, 1109 [NASA ADS] [CrossRef] [Google Scholar]
- Whitney, B. A., Indebetouw, R., Bjorkman, J. E., & Wood, K. 2004, ApJ, 617, 1177 [NASA ADS] [CrossRef] [Google Scholar]
- Williams, J. P., & Cieza, L. A. 2011, ARA&A, 49, 67 [NASA ADS] [CrossRef] [Google Scholar]
- Wolf, S. 2003a, ApJ, 582, 859 [NASA ADS] [CrossRef] [Google Scholar]
- Wolf, S. 2003b, Comput. Phys. Comm., 150, 99 [Google Scholar]
- Wolf, S., Padgett, D. L., & Stapelfeldt, K. R. 2003, ApJ, 588, 373 [NASA ADS] [CrossRef] [Google Scholar]
- Wright, E. L., Eisenhardt, P. R. M., Mainzer, A. K., et al. 2010, AJ, 140, 1868 [NASA ADS] [CrossRef] [Google Scholar]
All Tables
All Figures
|
Fig. 1 Spectral energy distributions of the brown dwarf disks. The dots depict the photometry taken with 2MASS (purple), WISE (green), and Herschel/PACS (red). The upside down triangles show the 3σ upper limits measured with PACS and SCUBA-2. The best-fit models are indicated as black solid lines, whereas the dashed lines represent the photospheric emission levels. The gray lines denote all the models that are within the uncertainties given in Table 3, showing the constraints of the best fit models for each object. To deduce the uncertainties of model parameters with Bayesian analysis, we only take the models calculated in the grid into account, see Sect. 3. Notes: (1) for the binary TWA 32, the near-IR photometry shown in this figure are F2MASS J = 42.6 mJy, F2MASS H = 46.1 mJy and F2MASS K = 41.2 mJy. These values are different from the observed ones of the whole binary system, see Sect. 2.1. (2) For TWA 30B, all the models indicated as gray lines feature i = 75°. Models with other inclinations are not shown because the derivation of uncertainties in Rin, Mdisk, β and h100 is based on models with i = 75° in the grid; see Sect. 3 for an explanation. |
| In the text | |
|
Fig. 2 Optical depth in the vertical direction as a function of radius at Herschel far-IR wavelengths for a typical brown dwarf disk model with log10Mdisk/M⊙ = −4.5 and dust properties including grain size distribution identical to those used in the SED simulation, see Sect. 3. |
| In the text | |
|
Fig. 3 Fluxes at Herschel 70 μm (F70) as a function of the stellar temperature (Teff). Data points are collected from Harvey et al. (2012a,b) for a mix of nearby regions (black squares), Olofsson et al. (2013) for Chameleon I (red circles), Spezzi et al. (2013) for Chameleon II (gray stars), Alves de Oliveira et al. (2013) for ρ Ophiuchi (blue crosses), and from Riviere-Marichalar et al. (2013, purple diamonds) and our program (green diamonds) for the TWA. Upper limits are indicated as upside down triangles with the same color scheme. The 100 μm fluxes reported by Olofsson et al. (2013) were converted to 70 μm fluxes by multiplying them with a factor of 1.12, the median from very low-mass stars with detections at both wavelengths. The shaded region marks 95% confidence intervals on the log Teff ~ log F70 relation, derived from a Bayesian linear regression analysis that takes the errors and upper limits of measurements into account (Kelly 2007). |
| In the text | |
|
Fig. 4 Marginal posterior distributions of the intrinsic dispersion around the regression line and linear correlation coefficient. |
| In the text | |
|
Fig. A.1 Probability distributions of model parameters for TWA 30A. The vertical dashed lines denote the best-fit values. |
| In the text | |
|
Fig. A.2 Probability distributions of model parameters for TWA 30B. The vertical dashed lines denote the best-fit values. |
| In the text | |
|
Fig. A.3 Probability distributions of model parameters for TWA 31. The vertical dashed lines denote the best-fit values. |
| In the text | |
|
Fig. A.4 Probability distributions of model parameters for TWA 32. The vertical dashed lines denote the best-fit values. |
| In the text | |
|
Fig. A.5 Probability distributions of model parameters for TWA 34. The vertical dashed lines denote the best-fit values. |
| In the text | |
Current usage metrics show cumulative count of Article Views (full-text article views including HTML views, PDF and ePub downloads, according to the available data) and Abstracts Views on Vision4Press platform.
Data correspond to usage on the plateform after 2015. The current usage metrics is available 48-96 hours after online publication and is updated daily on week days.
Initial download of the metrics may take a while.