| Issue |
A&A
Volume 516, June-July 2010
|
|
|---|---|---|
| Article Number | A97 | |
| Number of page(s) | 12 | |
| Section | Atomic, molecular, and nuclear data | |
| DOI | https://doi.org/10.1051/0004-6361/201014485 | |
| Published online | 21 July 2010 | |
Dielectronic recombination of argon-like ions
D. Nikolic1 - T. W. Gorczyca1 - K. T. Korista1 - N. R. Badnell2
1 - Department of Physics, Western Michigan University, Kalamazoo, MI
49008, USA
2 - Department of Physics, University of Strathclyde, Glasgow G4 0NG,
UK
Received 23 March 2010 / Accepted 16 April 2010
Abstract
Context. We present a theoretical investigation of
dielectronic recombination (DR) of Ar-like ions that sheds new light on
the behavior of the rate coefficient at low-temperatures where these
ions form in photoionized plasmas.
Aims. We provide results for the total and partial
Maxwellian-averaged DR rate coefficients from the initial ground level
of K II-Zn XIII
ions. It is expected that these new results will advance the accuracy
of the ionization balance for Ar-like M-shell ions and pave the way
towards a detailed modeling of astrophysically relevant X-ray
absorption features.
Methods. We utilize the AUTOSTRUCTURE computer code
to obtain the accurate core-excitation thresholds in target ions and
carry out multiconfiguration Breit-Pauli (MCBP) calculations of the DR
cross section in the independent-processes, isolated-resonance,
distorted-wave (IPIRDW) approximation.
Results. Our results mediate the complete absence of
direct DR calculations for certain Ar-like ions and question the
reliability of the existing empirical rate formulas, often inferred
from renormalized data within this isoelectronic sequence.
Key words: atomic data - atomic processes - plasmas - scattering
1 Introduction
Atomic structure and dynamic behavior of highly-charged ions is one of the key ingredients presently required for both laboratory plasma diagnostics and interpretation of astrophysical phenomena (Fawcett 1991; Liedhal 2000; Kallman & Palmeri 2007). The most common diagnostic technique to probe for electron temperature of laser-produced, fusion, or astrophysical plasmas involves spectroscopical observations of intensity ratios of EUV or X-ray emission lines coming from consecutive ionization stages of a single plasma component. The accuracy of derived plasma parameters is strongly affected by uncertainties in chemical abundances, often inherited through the use of unreliable collisional ionization and/or dielectronic recombination (DR) rates (Savin & Laming 2002). Seon et al. (2003) investigated the effect of the uncertainties in DR rates on an isoelectronic line ratio in Ti and Cr plasmas and found substantial differences in the fractional abundances obtained for Ti V and Cr VII ions (a shift of the curves to lower temperatures) as compared to those inferred using the recommended recombination rate coefficients (Mazzotta et al. 1998).In recent years an enormous amount of progress, both theoretically and experimentally, has been made in improving the DR rate database along isoelectronic series within the first and second rows, and the third row up through Mg-like ions (see the review by Kallman & Palmeri 2007, and references therein). In most cases it is found that the newly determined DR rates are significantly larger than their earlier recommended estimates, having profound consequences on the ionization balance and thermal equilibrium in both photoionized and collisionally ionized plasmas, from the solar corona to Active Galactic Nuclei (AGN) (see, for example, Chakravorty et al. 2008; Bryans et al. 2006,2009b; Dere et al. 2009; Bryans et al. 2009a; Chakravorty et al. 2009). In this work, we present improved theoretical predictions of the DR rates of Ar-like ions. Of these ions, those of the iron peak elements are some of the more abundant in cosmic plasmas. In much of the remainder of this introduction we will provide some of the motivation in improving their atomic database, in particular their DR rate coefficients.
The strong contribution of M-shell Fe ions to the unresolved
transition array of inner-shell
absorption lines in ![]() 15-17 Å
X-ray spectra of several AGN observed with XMM-Newton and Chandra, was
initially not well understood (Netzer
2004). The fact that AGN photoionization models initially
overpredicted the average ionization stage of iron was attributed in
part to an underestimate in the low-temperature DR rate coefficients
for M-shell iron (Kraemer
et al. 2004), and constituted the main motivation
behind the benchmark calculations recently performed by Badnell (2006), as well
as experimental and theoretical results presented in Lukic et al. (2007).
The present work further extends the calculations of Badnell (2006) for Fe IX
ions by augmenting the configuration interaction (CI) with some of the
most important
15-17 Å
X-ray spectra of several AGN observed with XMM-Newton and Chandra, was
initially not well understood (Netzer
2004). The fact that AGN photoionization models initially
overpredicted the average ionization stage of iron was attributed in
part to an underestimate in the low-temperature DR rate coefficients
for M-shell iron (Kraemer
et al. 2004), and constituted the main motivation
behind the benchmark calculations recently performed by Badnell (2006), as well
as experimental and theoretical results presented in Lukic et al. (2007).
The present work further extends the calculations of Badnell (2006) for Fe IX
ions by augmenting the configuration interaction (CI) with some of the
most important ![]() ionic core excitations (Zeng
et al. 2006; Aggarwal et al. 2006).
ionic core excitations (Zeng
et al. 2006; Aggarwal et al. 2006).
In the framework of testing nucleosynthesis models, Ellison et al. (2001) identified Co as a rewarding element to study galactic and stellar formation histories through the observed abundance trends (del Peloso et al. 2005). For example, the agreement of the modeled time-dependent ejecta compositions and velocities with observed Type 1a supernovae spectra requires a substantial initial presence of Ni , Co , and Fe in the outer layers of the ejecta (Hillebrandt & Niemeyer 2000). In the present work, we study the photorecombination of Co X as an example of a heavier iron peak element for which the stellar photospheric elemental abundances are less well known (Adelman et al. 2000).
Nickel is one of the most important heavy impurities in tokamaks and early attempts by the TFR Group (1980) to model the fractional abundance of its charge states suffered from deficient DR data. Recent simulations of the observed plasma emission from magnetic confinement fusion devices, namely the JET tokamak in Abingdon and RFX in Padova (Mattioli et al. 2004), also lacked accurate recombination rate coefficients for the Ni XI ion. However, reliable electron impact ionization data of the remaining ions in the nickel isonuclear sequence have been provided by Pindzola et al. (1991) and were widely used by Mattioli et al. (2004) in simulations of Ni emission line spectra. The past few years have marked a renewed theoretical interest (Aggarwal & Keenan 2007,2008; Verma et al. 2007) in electron excitation data for argon-like nickel, initiated by its identification in numerous astrophysical plasmas (consult Verma et al. 2007 for an exhaustive up-to-date bibliography). The most recent studies of the Intra-Cluster Medium, as discussed by Werner et al. (2008), put constraints on supernova models by using Ni/Fe abundance patterns in the ejecta of type Ia supernovae. In addition, from the Mass Time-of-Flight Spectrometer data accumulated during the first decade of SOHO's operation, Karrer et al. (2007) inferred charge-state distributions, isotopic composition, and the elemental Ni /Fe ratio of the solar wind, and confirmed that both nickel and iron become enriched in the solar corona.
The significance of reliable atomic data has been demonstrated
by Churazov et al.
(2004) through the
modeling and interpretation of the 5-9 keV spectrum from the
multi-temperature core of the Perseus galaxy cluster. In their study, Churazov et al. (2004)
used APEC (Smith
et al. 2001) and MEKAL (Mewe
et al. 1985) models, both having the redshift of
major line energies, the heavy element abundances, and the plasma
temperatures as free parameters. It has been shown that the MEKAL model
yields the best description of the spectra only when nickel is
overabundant relative to iron by a factor of ![]() 2 compared to solar. However, this enhancement is
not required by the simulations of the APEC code
(http://cxc.harvard.edu/atomdb) that uses updated atomic data.
2 compared to solar. However, this enhancement is
not required by the simulations of the APEC code
(http://cxc.harvard.edu/atomdb) that uses updated atomic data.
The present computational study is part of an ongoing
investigation of DR processes in argon-like
ions (Nikolic
et al. 2010,2007,2009), and deals with
![]() ionic
core excitations and associated dielectronic resonances that
dominate electron-ion recombination in photoionized plasmas. The
theoretical foundation and computational method we use for the DR
calculations are found elsewhere (Badnell
et al. 2003) and here we only outline the essence.
With the use of the open-source AUTOSTRUCTURE code (Badnell 1986,1997),
we carry out MCBP computations of energy levels and decay rates in an
intermediate coupling scheme for
Ar-like K II, Ca III,
Sc IV, Ti V, V VI,
Cr VII, Mn VIII,
Fe IX, Co X, Ni
XI, Cu XII, and
Zn XIII ions.
In order to account efficiently for all DR contributions coming from
numerous Rydberg series of
resonances and offer them to the plasma modeling community in
convenient level-resolved format,
we further enforce the independent-processes, isolated-resonance,
distorted-wave (IPIRDW) approximation (Pindzola
et al. 1992).
ionic
core excitations and associated dielectronic resonances that
dominate electron-ion recombination in photoionized plasmas. The
theoretical foundation and computational method we use for the DR
calculations are found elsewhere (Badnell
et al. 2003) and here we only outline the essence.
With the use of the open-source AUTOSTRUCTURE code (Badnell 1986,1997),
we carry out MCBP computations of energy levels and decay rates in an
intermediate coupling scheme for
Ar-like K II, Ca III,
Sc IV, Ti V, V VI,
Cr VII, Mn VIII,
Fe IX, Co X, Ni
XI, Cu XII, and
Zn XIII ions.
In order to account efficiently for all DR contributions coming from
numerous Rydberg series of
resonances and offer them to the plasma modeling community in
convenient level-resolved format,
we further enforce the independent-processes, isolated-resonance,
distorted-wave (IPIRDW) approximation (Pindzola
et al. 1992).
In the remainder of this paper, we will proceed as follows. Section 2 discusses the process of electron-ion recombination and transparently outlines the main relations and equations arising within the adopted methodology. A comparative overview of existing atomic structure in argon-like ions is provided throughout Sect. 3, and an analysis of the results is presented in Sect. 4.
Table 1:
Radial scaling parameters, ![]() ,
for the n=3 valence orbitals optimized in the
Slater-type-orbital model potential.
,
for the n=3 valence orbitals optimized in the
Slater-type-orbital model potential.
Table 2:
Dominant radiative transition data from the ground state of the
recombining ion
![]() ,
where
,
where ![]() denotes
denotes ![]() .
.
Table 3:
The lowest ![]() core excitation thresholds (in Rydbergs) for K II
and Ca III.
core excitation thresholds (in Rydbergs) for K II
and Ca III.
2 Elementary processes of relevance
The contribution of the photorecombination process of an ionization state q+ from a single partial wave![$\displaystyle {\rm {I}}^{(q-1)+\ast\ast}\left(
\begin{array}{l}
{\rm 3s}^{2}3{\...
...~4\ell' n\ell \\ [2pt]
{\rm 3s3p}^{6}~4\ell' n\ell
\end{array}\right)_{J,~\pi}$](/articles/aa/full_html/2010/08/aa14485-10/img97.png)

Here c is a continuum state consisting of an initial electron incident upon the target ion
Within the adopted IPIRDW framework, our calculations rely on
lowest-order perturbation
theory to compute Lorentzian resonance profiles as a function of the
electron's center-of-mass
(c.m.) energy ![]() .
The total DR cross section is then given as
.
The total DR cross section is then given as
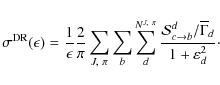
Here
![\begin{displaymath}
\mathcal{S}_{c \to b}^{d} [\mbox{Mb Ry$^{2}$ }] = 2.674\time...
...to b}}{\sum_{c'} A^{a}_{d \to c'} + \sum_s A^{r}_{d \to s}}\;,
\end{displaymath}](/articles/aa/full_html/2010/08/aa14485-10/img107.png)
with gd and
The DR/RR rate coefficient (in units of
![]() )
for
)
for ![]() ions in
a plasma with a Maxwellian electron energy distribution
ions in
a plasma with a Maxwellian electron energy distribution
![]() is
given by
is
given by
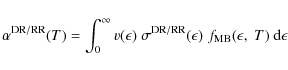
and conveniently modeled using physically-motivated fitting formulae (Burgess 1965)
where the more general form
3 Atomic structure
Before performing the electron-ion scattering calculation in Eq. (1), it is necessary to obtain an accurate description of the Ar-like target-ion states. Our approach for the entire Ar-like isoelectronic sequence is essentially the same as what was done earlier for Ti V (Nikolic et al. 2009). Since the dominant DR contribution is due to theWith this configuration basis, the 1s, 2s, 2p, 3s, 3p, and 3d
Slater-type orbitals were determined by varying the radial scaling
parameters, ![]() ,
to minimize the equally-weighted-sum of MCBP eigenenergies of the
seventeen lowest states, using the model potential of Burgess et al. (1989)
with mass-velocity and Darwin corrections. The values of the radial
scaling parameters for closed-core orbitals (1s, 2s, and 2p) remained
throughout the optimization
in near proximity to their default value of 1.0. We then applied small
adjustments to the
,
to minimize the equally-weighted-sum of MCBP eigenenergies of the
seventeen lowest states, using the model potential of Burgess et al. (1989)
with mass-velocity and Darwin corrections. The values of the radial
scaling parameters for closed-core orbitals (1s, 2s, and 2p) remained
throughout the optimization
in near proximity to their default value of 1.0. We then applied small
adjustments to the ![]() scaling parameters in order to reproduce the NIST experimental
scaling parameters in order to reproduce the NIST experimental
![]() radiative
data of Shirai
et al. (2000). The resultant
radiative
data of Shirai
et al. (2000). The resultant
![]() values
are listed in Table 1
and the
radiative data are listed in Table 2. As is seen
in Table 2,
our target description is such that the present oscillator strengths
are in excellent agreement with the experimental values.
values
are listed in Table 1
and the
radiative data are listed in Table 2. As is seen
in Table 2,
our target description is such that the present oscillator strengths
are in excellent agreement with the experimental values.
Table 4:
The lowest ![]() core excitation thresholds (in Rydbergs) for V VI
and Cr VII.
core excitation thresholds (in Rydbergs) for V VI
and Cr VII.
Table 5:
The lowest ![]() core excitation thresholds (in Rydbergs) for Mn VIII
and Fe IX.
core excitation thresholds (in Rydbergs) for Mn VIII
and Fe IX.
Table 6:
The lowest ![]() core excitation thresholds (in Rydbergs) for Co X
and Ni XI. Uncertainties are enclosed in
lower parentheses.
core excitation thresholds (in Rydbergs) for Co X
and Ni XI. Uncertainties are enclosed in
lower parentheses.
Table 7:
The lowest ![]() core excitation thresholds (in Rydbergs) for Cu XII
and Zn XIII. Uncertainties are enclosed in
lower parentheses.
core excitation thresholds (in Rydbergs) for Cu XII
and Zn XIII. Uncertainties are enclosed in
lower parentheses.
We have also confirmed that the computed eigenenergies were
stationary with respect to the small variations in
![]() values
that were used to fine-tune the
values
that were used to fine-tune the
![]() oscillator
strengths. Indeed, as is seen in Tables 3, 4, 5, 6, and 7 for the
lowest-lying Ar-like states, our computed energies are in excellent
agreement with the experimental values given in the NIST Atomic Spectra
Database (Sugar
& Corliss 1985; Shirai et al. 2000; Pettersen
et al. 2007).
In the case of higher ionization stages, the atomic data produced by Froese-Fischer & Tachiev (2006)
using the multi-configurational Hartree-Fock (MCHF) method, or by a
non-relativistic single-configuration approach of Ghosh & Mukherjee (1997),
are up to 7.2% lower than the NIST values. In contrast to the present
study, the calculations of Froese-Fischer
& Tachiev (2006) lacked the important
oscillator
strengths. Indeed, as is seen in Tables 3, 4, 5, 6, and 7 for the
lowest-lying Ar-like states, our computed energies are in excellent
agreement with the experimental values given in the NIST Atomic Spectra
Database (Sugar
& Corliss 1985; Shirai et al. 2000; Pettersen
et al. 2007).
In the case of higher ionization stages, the atomic data produced by Froese-Fischer & Tachiev (2006)
using the multi-configurational Hartree-Fock (MCHF) method, or by a
non-relativistic single-configuration approach of Ghosh & Mukherjee (1997),
are up to 7.2% lower than the NIST values. In contrast to the present
study, the calculations of Froese-Fischer
& Tachiev (2006) lacked the important
![]() excitation
contributions, which is essential for improving the radiative
transition data. Furthermore, for higher degrees of ionization, only
the terms of the
excitation
contributions, which is essential for improving the radiative
transition data. Furthermore, for higher degrees of ionization, only
the terms of the ![]() configuration were retained in their calculations. The basic CIV3
atomic data for Fe IX produced by Verma et al. (2006)
are noticeably closer to the present results than those of Aggarwal et al. (2006)
using the fully relativistic multi-configurational Flexible Atomic Code
(FAC) of Gu (2004).
configuration were retained in their calculations. The basic CIV3
atomic data for Fe IX produced by Verma et al. (2006)
are noticeably closer to the present results than those of Aggarwal et al. (2006)
using the fully relativistic multi-configurational Flexible Atomic Code
(FAC) of Gu (2004).
![\begin{figure}
\par\mbox{\subfigure{\resizebox{8.5cm}{!}{\includegraphics[angle=...
...ncludegraphics[angle=0,scale=1.0]{14485f1b.eps}} }}
\vspace*{2.2mm}
\end{figure}](/articles/aa/full_html/2010/08/aa14485-10/img263.png)
|
Figure 1: Comparison of existing total DR ground-level rate coefficients for K II ( left) and Ca III ( right): (a) red solid curve, empirical results of Mewe et al. (1980); (b) black solid curve, recommended data of Mazzotta et al. (1998); red dashed curve, present MCBP results. RR channels are also shown as the long-dashed curve. |
| Open with DEXTER | |
![\begin{figure}
\par\mbox{\subfigure{\resizebox{8.5cm}{!}{\includegraphics[angle=...
...{8.5cm}{!}{\includegraphics[angle=0,scale=1.0]{14485f2b.eps} } }}
\end{figure}](/articles/aa/full_html/2010/08/aa14485-10/img264.png)
|
Figure 2: Comparison of existing total DR ground-level rate coefficients for Sc IV ( left) and Ti V ( right): (a) gray open circles, TSR experiments by Schippers et al. (1998,2002); (b) black doted curve, compilation by Landini & Fossi (1991); (c) black dash-dotted curve, empirical formula of Hahn (1991); (d) black solid curve, recommended value by Mazzotta et al. (1998); (e) black dashed curve, empirical results of Mewe et al. (1980). The present RR results are also shown as the long-dashed curve. |
| Open with DEXTER | |
![\begin{figure}
\par\mbox{\subfigure{\resizebox{8.5cm}{!}{\includegraphics[angle=...
...ox{8.5cm}{!}{\includegraphics[angle=0,scale=1.0]{14485f3b.eps}} }}\end{figure}](/articles/aa/full_html/2010/08/aa14485-10/img265.png)
|
Figure 3: Comparison of existing total DR ground-level rate coefficients for V VI ( left) and Cr VII ( right): (a) red solid curve, empirical results of Mewe et al. (1980); (b) black solid curve, recommended data of Mazzotta et al. (1998); (c) black dash-dotted curve, empirical formula of Hahn (1991); red dashed curve, present MCBP results. RR channels are also shown as the long-dashed curve. |
| Open with DEXTER | |
![\begin{figure}
\par\mbox{\subfigure{\resizebox{8.5cm}{!}{\includegraphics[angle=...
...ox{8.5cm}{!}{\includegraphics[angle=0,scale=1.0]{14485f4b.eps}} }}\end{figure}](/articles/aa/full_html/2010/08/aa14485-10/img266.png)
|
Figure 4: Comparison of existing total DR ground-level rate coefficients. On the left is for Mn VIII: (a) red solid curve, empirical results of Mewe et al. (1980); (b) black solid curve, recommended data of Mazzotta et al. (1998); (c) green solid curve, LS results of Jacobs & Davis (1983); red dashed curve, present MCBP results. On the right is Fe IX: black dots with error bars, TSR experiment by Schmidt et al. (2008); (a) red solid curve, empirical results of Mewe et al. (1980); (b) blue solid curve, compilation of Arnaud & Raymond (1992); (c) black solid curve, result of Jacobs et al. (1977); (d) green solid curve, empirical data of Kato & Asano (1999); (e) black dash-dotted curve, empirical formula of Hahn (1991); (f) ``4CF'' and ``5CF'' MCBP results of Badnell (2006); red dashed curve, present ``18CF'' MCBP results; The present RR results are also shown as the long-dashed curve. |
| Open with DEXTER | |
4 DR results
To treat the DR processes occurring in Eq. (1), all possible
continuum and resonance wavefunctions
are constructed by coupling an appropriate distorted-wave free
![]() or
bound
or
bound ![]() orbital to each target
configuration wavefunction, as obtained in the previous section.
The energies, radiative rates, and Auger rates of each resonance are
then computed and used in
Eqs. (2) and (4) to produce
Maxwellian rate coefficients that are shown in
Figs. 7-9.
In all the figures, the bars indicating the collisionally ionized zone
were obtained assuming the
conditions of coronal equilibrium with electron-collisional plasma
temperatures
for which the fractional abundance of the target ion in question
surpasses 10% of its peak value (Bryans
et al. 2008).
Similar approximate temperature indicators for gas in photoionization
equilibrium have been computed using Cloudy (v08.00; Ferland et al. 1998).
Although these results did not include the DR rate coefficient data
reported here, the indicated temperature range should still be
reasonably accurate.
orbital to each target
configuration wavefunction, as obtained in the previous section.
The energies, radiative rates, and Auger rates of each resonance are
then computed and used in
Eqs. (2) and (4) to produce
Maxwellian rate coefficients that are shown in
Figs. 7-9.
In all the figures, the bars indicating the collisionally ionized zone
were obtained assuming the
conditions of coronal equilibrium with electron-collisional plasma
temperatures
for which the fractional abundance of the target ion in question
surpasses 10% of its peak value (Bryans
et al. 2008).
Similar approximate temperature indicators for gas in photoionization
equilibrium have been computed using Cloudy (v08.00; Ferland et al. 1998).
Although these results did not include the DR rate coefficient data
reported here, the indicated temperature range should still be
reasonably accurate.
For K II and Ca III,
the only other data available in Fig. 1 are the
results of Mewe et al.
(1980) and Mazzotta
et al. (1998). The rate coefficients of Mazzotta et al. (1998)
are inferred by using the general formula of Burgess
(1965) that is first scaled down to match the empirical DR
rate of Hahn (1989) for Fe
IX and then this same scaling is applied to
other ions in the isoelectronic sequence.
Surprisingly, this procedure gives results that are in fair agreement
with our present calculations, but, as is seen for higher ionization
stages, this method fails to account correctly for low-temperature DR.
The results of Mewe et al.
(1980), on the other hand, were obtained using a
parameterized empirical formula based upon the renormalized results of
Jacobs et al. (1977)
and Ansari et al. (1970)
for ![]() ,
,
![]() ,
and
,
and ![]() core-excitations of Fe IX; that procedure
gives erroneous results for the position and peak of the rate
coefficient.
core-excitations of Fe IX; that procedure
gives erroneous results for the position and peak of the rate
coefficient.
The results shown in Fig. 2 have been analyzed more fully in our earlier studies of Sc IV (Nikolic et al. 2010) and Ti V (Nikolic et al. 2009), but the following points should be made. First, there is experimental data available for both of these ions (Schippers et al. 1998,2002), and these measurements were useful for quantifying the positions of low-energy resonances. However, the experiments for these low-charged Ar-like ions were subject to motional Stark effect that reionized the higher-n recombined bound states and led to a reduction in the DR cross section. Thus, the measured rate coefficient is unphysically too low at higher temperatures and is inappropriate for use in plasma modeling. Also, the experimental rate coefficient also contains the contribution due to RR, which is why the Sc IV experimental rate coefficient exceeds our DR result at lower temperatures and merges with our RR result.
Another new feature seen in Fig. 2 that
was absent in Fig. 1 is
that, as the ionization stage is increased, the lowest-lying members of
the Rydberg series given in Eq. (1), namely the
![]() and
and
![]() resonances,
approach zero continuum energy and give a large
contribution to
the rate coefficient at the lower temperatures found in photoionized
plasmas. This contribution is not included in the results of Mazzotta et al. (1998);
those data are determined from the Burgess formula (Burgess 1965), which only
considers high-temperature DR. We note that the data of Mazzotta et al. (1998)
also differs significantly from the present DR rate coefficient in the
collisionally ionized zone. The other available data - the empirical
results of Mewe et al.
(1980), Landini
& Fossi (1991), and Hahn
(1991) - differ dramatically from the present MCBP results.
resonances,
approach zero continuum energy and give a large
contribution to
the rate coefficient at the lower temperatures found in photoionized
plasmas. This contribution is not included in the results of Mazzotta et al. (1998);
those data are determined from the Burgess formula (Burgess 1965), which only
considers high-temperature DR. We note that the data of Mazzotta et al. (1998)
also differs significantly from the present DR rate coefficient in the
collisionally ionized zone. The other available data - the empirical
results of Mewe et al.
(1980), Landini
& Fossi (1991), and Hahn
(1991) - differ dramatically from the present MCBP results.
For the higher ionization stages of V VI, Cr VII, and Mn VIII shown in Figs. 3 and 4, the present rate coefficient again has a significant low-temperature DR contribution that is absent in all previously available data. For Fe IX, there exist several other results, but most of these are again empirical results that fail to account for low-temperature DR contributions in the photoionized plasma region and also differ significantly from our present DR results in the collisionally-ionized plasma region. We also show the earlier MCBP results of Badnell (2006). Those calculations were quite similar to the present ones, except that a smaller configuration basis was used and thus a slightly larger rate coefficient was obtained. We have established that by augmenting those earlier calculations with the inclusion of additional correlation configurations, as we include here, the two results are brought into agreement. Both MCBP results are somewhat lower than the experimental rate coefficient, as has been discussed more fully by Schmidt et al. (2008). We note that the experiment for Fe IX was not influenced by external fields, unlike the experiments for Sc IV and Ti V, but may contain trielectronic recombination contributions, which are included in our computations as well. Our DR rate coefficients for Co X through Zn XIII are shown in Figs. 5 and 6, where it is seen again that all previous data do not account for the low-temperature contributions that dominate in the photoionized plasma region.
![\begin{figure}
\par\mbox{\subfigure{\resizebox{8.5cm}{!}{\includegraphics[angle=...
...ox{8.5cm}{!}{\includegraphics[angle=0,scale=1.0]{14485f5b.eps}} }}\end{figure}](/articles/aa/full_html/2010/08/aa14485-10/img273.png)
|
Figure 5: Comparison of existing total DR ground-level rate coefficients. On the left is for Co X: (a) red solid curve, empirical results of Mewe et al. (1980); (b) black solid curve, recommended data of Mazzotta et al. (1998); red dashed curve, present MCBP results. On the right is for Ni XI ion: (a) red solid curve, empirical results of Mewe et al. (1980); (b) black solid curve, recommended data of Mazzotta et al. (1998); (c) black dash-doted curve, empirical formula of Hahn (1991); (d) blue solid curve, compilation of Arnaud & Rothenflug (1985); (e) green solid curve, empirical data of Kato & Asano (1999); red dashed curve, the present MCBP results. RR channels are also shown as the long-dashed curve. |
| Open with DEXTER | |
![\begin{figure}\par\mbox{\subfigure{\resizebox{8.5cm}{!}{\includegraphics[angle=0...
...ox{8.5cm}{!}{\includegraphics[angle=0,scale=1.0]{14485f6b.eps}} }}\end{figure}](/articles/aa/full_html/2010/08/aa14485-10/img274.png)
|
Figure 6: Comparison of existing total DR ground-level rate coefficients for Cu XII ( left) and Zn XIII ( right): (a) red solid curve, empirical results of Mewe et al. (1980); (b) black solid curve, recommended data of Mazzitelli & Mattioli (2002); red dashed curve, present MCBP results. RR channels are also shown as the long-dashed curve. |
| Open with DEXTER | |
![\begin{figure}\par\mbox{\subfigure{\resizebox{8.5cm}{!}{\includegraphics[angle=0...
...x{8.5cm}{!}{\includegraphics[angle=0,scale=1.0]{14485f7b.eps} } }}\end{figure}](/articles/aa/full_html/2010/08/aa14485-10/img275.png)
|
Figure 7:
Present Maxwellian-averaged DR and RR rate coefficients for K II
( left) and Ca III (
right).
The red and gray dashed curves are the total DR and RR rate
coefficients, respectfully. The intra-shell
|
| Open with DEXTER | |
In Figs. 7-9, we show
the DR contributions from
each resonance series. As anticipated due to its large core oscillator
strength, the
![]() resonances
are dominant. The lowest
resonances
are dominant. The lowest
![]() resonances
are first seen to be indistinct from the rest of the series
for K II and Ca III,
then begin to show a separate feature at low temperatures for Sc IV,
and completely
dominate at low temperatures for Ti V. As
the nuclear charge is increased from V VI
through Zn XIII, additional low-temperature
features are seen to oscillate as the n=4 and n=5
resonances move from above to below threshold. Also seen as the
ionization stage increases is the appearance of the
resonances
are first seen to be indistinct from the rest of the series
for K II and Ca III,
then begin to show a separate feature at low temperatures for Sc IV,
and completely
dominate at low temperatures for Ti V. As
the nuclear charge is increased from V VI
through Zn XIII, additional low-temperature
features are seen to oscillate as the n=4 and n=5
resonances move from above to below threshold. Also seen as the
ionization stage increases is the appearance of the
![]() (n=3,4)
resonances near threshold that dominate the
low-temperature rate coefficient.
(n=3,4)
resonances near threshold that dominate the
low-temperature rate coefficient.
![\begin{figure}
\par\mbox{\subfigure{\resizebox{8.5cm}{!}{\includegraphics[angle=...
...{8.5cm}{!}{\includegraphics[angle=0,scale=1.0]{14485f8b.eps} } }}
\end{figure}](/articles/aa/full_html/2010/08/aa14485-10/img278.png)
|
Figure 8:
Present Maxwellian-averaged DR and RR rate coefficients for Sc IV
( left) and Ti V (
right).
The red and gray dashed curves are the total DR and RR rate
coefficients, respectfully. The intra-shell
|
| Open with DEXTER | |
Table 8:
Fitting parameters ![]() and
and
![]() used
for modeling the Maxwellian-averaged DR rate coefficients - see
Eq. (5).
Uncertainties are enclosed in lower parentheses, where
used
for modeling the Maxwellian-averaged DR rate coefficients - see
Eq. (5).
Uncertainties are enclosed in lower parentheses, where
![]() denotes
denotes
![]() .
.
Table 9:
Fit coefficients for total ground state RR rate coefficients of
recombining ions, see Eq. (6), where
![]() denotes
denotes
![]() with
uncertainties given in lower parentheses.
with
uncertainties given in lower parentheses.
![\begin{figure*}
\par\mbox{\subfigure{\resizebox{8cm}{!}{\includegraphics[angle=0...
...8cm}{!}{\includegraphics[angle=0,scale=1.0]{14485f9h.eps}} }}
\par
\end{figure*}](/articles/aa/full_html/2010/08/aa14485-10/img505.png)
|
Figure 9:
Present Maxwellian-averaged DR and RR rate coefficients for V VI
- Zn XIII ions.
The red and gray dashed curves are the total DR and RR rate
coefficients, respectfully. The intra-shell
|
| Open with DEXTER | |
Lastly, we list the DR fitting coefficients for each ion, as described by Eq. (5), in Table 8. The RR fitting coefficients of Eq. (6) are listed in Table 9.
5 Summary
It is clear that all previously-available DR data for Ar-like ions are inadequate at lower temperatures since the contributions from low-lying resonances are not accounted for. Thus, those earlier data are inappropriate for use in modeling photoionized plasmas. And even at higher temperatures relevant to collisionally ionized plasmas, the earlier data were obtained using rather crude parameterization formulas that are not as reliable as our computed MCBP rate coefficients. The results reported here serve as what we assess to be the most accurate and complete set of Ar-like DR data for use in spectral diagnostic studies of laboratory and astrophysical plasmas.
AcknowledgementsThis work was funded in part by NASA APRA, NASA SHP SR&T, and PPARC grants.
References
- Adelman, S. J., Gulliver, A. F., & Lodén, L. O. 2000, A&A, 353, 335 [NASA ADS] [Google Scholar]
- Aggarwal, K. M., & Keenan, F. P. 2007, A&A, 475, 393 [NASA ADS] [CrossRef] [EDP Sciences] [Google Scholar]
- Aggarwal, K. M., & Keenan, F. P. 2008, Eur. Phys. J. D, 46, 205 [NASA ADS] [CrossRef] [EDP Sciences] [Google Scholar]
- Aggarwal, K. M., Keenan, F. P., Kato, T., & Murakami, I. 2006, A&A, 460, 331 [NASA ADS] [CrossRef] [EDP Sciences] [Google Scholar]
- Ansari, S. M. R., Elwert, G., & Mücklich, P. 1970, Z. Naturforsch., 25a, 1781 [NASA ADS] [Google Scholar]
- Arnaud, M., & Raymond, J. 1992, ApJ, 398, 394 [NASA ADS] [CrossRef] [Google Scholar]
- Arnaud, M., & Rothenflug, R. 1985, A&AS, 60, 425 [NASA ADS] [Google Scholar]
- Badnell, N. R. 1986, J. Phys. B, 19, 3827 [Google Scholar]
- Badnell, N. R. 1997, J. Phys. B, 30, 1 [Google Scholar]
- Badnell, N. R. 2006, ApJ, 651, L73 [NASA ADS] [CrossRef] [Google Scholar]
- Badnell, N. R., O'Mullane, M. G., Summers, H. P., et al. 2003, A&A, 406, 1151 [NASA ADS] [CrossRef] [EDP Sciences] [Google Scholar]
- Baluja, K. L. 1986, J. Phys. B, 19, L551 [NASA ADS] [CrossRef] [Google Scholar]
- Bryans, P., Badnell, N. R., Gorczyca, T. W., et al. 2006, ApJS, 167, 343 [NASA ADS] [CrossRef] [Google Scholar]
- Bryans, P., Landi, E., & Savin, D. W. 2008, ArXiv e-prints, 805 [Google Scholar]
- Bryans, P., Kreckel, H., Roueff, E., Wakelam, V., & Savin, D. W. 2009a, ApJ, 694, 286 [NASA ADS] [CrossRef] [Google Scholar]
- Bryans, P., Landi, E., & Savin, D. W. 2009b, ApJ, 691, 1540 [NASA ADS] [CrossRef] [Google Scholar]
- Burgess, A. 1965, ApJ, 141, 1588 [NASA ADS] [CrossRef] [Google Scholar]
- Burgess, A., Manson, H. E., & Tully, J. A. 1989, A&A, 217, 319 [NASA ADS] [Google Scholar]
- Chakravorty, S., Kembhavi, A. K., Elvis, M., Ferland, G., & Badnell, N. R. 2008, MNRAS, 384, L24 [NASA ADS] [CrossRef] [Google Scholar]
- Chakravorty, S., Kembhavi, A. K., Elvis, M., & Ferland, G. 2009, MNRAS, 393, 83 [NASA ADS] [CrossRef] [Google Scholar]
- Churazov, E., Forman, W., Jones, C., Sunyaev, R., & Böhringer, H. 2004, MNRAS, 347, 29 [NASA ADS] [CrossRef] [Google Scholar]
- del Peloso, E. F., Cunha, K., da Silva, L., & Porto de Mello, G. F. 2005, A&A, 441, 1149 [NASA ADS] [CrossRef] [EDP Sciences] [Google Scholar]
- Dere, K. P., Landi, E., Young, P. R., et al. 2009, A&A, 498, 915 [NASA ADS] [CrossRef] [EDP Sciences] [Google Scholar]
- Ellison, S. L., Ryan, S. G., & Prochaska, J. X. 2001, MNRAS, 326, 628 [NASA ADS] [CrossRef] [Google Scholar]
- Fawcett, B. C. 1991, Z. Phys. D. Suppl., 21, 1 [Google Scholar]
- Ferland, G. J., Korista, K. T., Verner, D. A., et al. 1998, PASP, 110, 761 [Google Scholar]
- Froese-Fischer, C., Tachiev, G., & Irimia, A. 2006, Atomic Data and Nuclear Data Tables, 92, 607 [NASA ADS] [CrossRef] [Google Scholar]
- Ghosh, T. K., & Mukherjee, P. K. 1997, Phys. Scr., 55, 273 [NASA ADS] [CrossRef] [Google Scholar]
- Gu, M. F. 2004, The Flexible Atomic Code, Atomic Processes In Plasmas: 14th APS Topical Conference on Atomic Processes in Plasmas (Santa Fe, New Mexico, USA: AIP), 730, 127 [Google Scholar]
- Hahn, Y. 1989, J. Quant. Spec. Radiat. Transf., 41, 315 [Google Scholar]
- Hahn, Y. 1991, Phys. Scr., T37, 53 [NASA ADS] [CrossRef] [Google Scholar]
- Hillebrandt, W., & Niemeyer, J. C. 2000, ARA&A, 38, 191 [NASA ADS] [CrossRef] [Google Scholar]
- Jacobs, V. L., & Davis, J. 1983, NRL Memorandum Report, 5105, 1 [Google Scholar]
- Jacobs, V. L., Davis, J., Kepple, P. C., & Blaha, M. 1977, ApJ, 211, 605 [NASA ADS] [CrossRef] [Google Scholar]
- Kallman, T. R., & Palmeri, P. 2007, Reviews of Modern Physics, 79, 79 [Google Scholar]
- Karrer, R., Bochsler, P., Giammanco, C., et al. 2007, Space Sci. Rev., 130, 317 [NASA ADS] [CrossRef] [Google Scholar]
- Kato, T., & Asano, E. 1999, NIFS-DATA, 54, data from NIFS DATABASE at https://dbshino.nifs.ac.jp [Google Scholar]
- Kraemer, S. B., Ferland, G. J., & Gabel, J. R. 2004, ApJ, 604, 556 [NASA ADS] [CrossRef] [Google Scholar]
- Landini, M., & Fossi, B. C. M. 1991, A&ASS, 91, 183 [NASA ADS] [Google Scholar]
- Liedhal, D. A. 2000, in Atomic Data Needs for X-ray Astronomy, ed. M. A. Bautista, A. K. Kallman, & T. R. Pradhan, Laboratory for High Energy Astrophysics (NASA Goddard Space Flight Center: HEASARC), 151 [Google Scholar]
- Loginov, A. V., & Tuchkin, V. I. 2002, Opt. Spectrosc. , 93, 186 [NASA ADS] [CrossRef] [Google Scholar]
- Lukic, D. V., Schnell, M., Savin, D. W., et al. 2007, ApJ, 664, 1244 [NASA ADS] [CrossRef] [Google Scholar]
- Mattioli, M., Fournier, K. B., Coffey, I., et al. 2004, J. Phys. B, 37, 13 [NASA ADS] [CrossRef] [Google Scholar]
- Mazzitelli, G., & Mattioli, M. 2002, At. Data Nucl. Data Tables, 82, 313 [Google Scholar]
- Mazzotta, P., Mazzitelli, G., Colafrancesco, S., & Vittorio, N. 1998, A&AS, 133, 403 [NASA ADS] [CrossRef] [EDP Sciences] [Google Scholar]
- Mewe, R., Schrijver, J., & Sylwester, J. 1980, A&AS, 40, 323 [NASA ADS] [Google Scholar]
- Mewe, R., Gronenschild, E. H. B. M., & van den Oord, G. H. J. 1985, A&AS, 62, 197 [Google Scholar]
- Netzer, H. 2004, ApJ, 604, 551 [NASA ADS] [CrossRef] [Google Scholar]
- Nikolic, D., Gorczyca, T. W., Fu, J., Savin, D. W., & Badnell, N. R. 2007, Nucl. Instrum. Methods B, 261, 145 [NASA ADS] [CrossRef] [Google Scholar]
- Nikolic, D., Gorczyca, T. W., & Badnell, N. R. 2009, Phys. Rev. A, 79, 012703 [NASA ADS] [CrossRef] [Google Scholar]
- Nikolic, D., Gorczyca, T. W., & Badnell, N. R. 2010, Phys. Rev. A, 81, 030501(R) [NASA ADS] [Google Scholar]
- Pettersen, K., Ekberg, J., Martinson, I., & Reader, J. 2007, Phys. Scripta, 75, 702 [NASA ADS] [CrossRef] [Google Scholar]
- Pindzola, M. S., Griffin, D. C., Bottcher, C., Buie, M. J., & Gregory, D. C. 1991, Phys. Scr., T37, 35 [NASA ADS] [CrossRef] [Google Scholar]
- Pindzola, M. S., Badnell, N. R., & Griffin, D. C. 1992, Phys. Rev. A, 46, 5725 [NASA ADS] [CrossRef] [PubMed] [Google Scholar]
- Savin, D. W., & Laming, J. M. 2002, ApJ, 566, 1166 [NASA ADS] [CrossRef] [Google Scholar]
- Schippers, S., Bartsch, T., Brandau, C., et al. 1998, J. Phys. B, 31, 4873 [NASA ADS] [CrossRef] [Google Scholar]
- Schippers, S., Kieslich, S., Müller, A., et al. 2002, Phys. Rev. A, 65, 042723 [NASA ADS] [CrossRef] [Google Scholar]
- Schmidt, E. W., Schippers, S., Bernhardt, D., et al. 2008, A&A, 492, 265 [NASA ADS] [CrossRef] [EDP Sciences] [Google Scholar]
- Seon, K. I., Nam, U. W., & Park, I. H. 2003, J. Phys. B, 36, 2679 [NASA ADS] [CrossRef] [Google Scholar]
- Shirai, T., Sugar, J., Musgrove, A., & Wiese, W. L. 2000, Spectral Data for Highly Ionized Atoms: Ti, V, Cr, Mn, Fe, Co, Ni, Cu, Kr, and Mo, J. Phys. Chem. Ref. Data, Monograph No. 8 (Melville, NY: AIP Press), http://physics.nist.gov/PhysRefData/ASD [Google Scholar]
- Smith, R. K., Brickhouse, N., Liedahl, D. A., & Raymond, J. C. 2001, ApJ, 556, L91 [NASA ADS] [CrossRef] [Google Scholar]
- Storey, P. J., Zeippen, C. J., & Le Dourneuf, M. 2002, A&A, 394, 753 [NASA ADS] [CrossRef] [EDP Sciences] [Google Scholar]
- Sugar, J., & Corliss, C. 1985, J. Phys. Chem. Ref. Data, 14, 1, (Suppl. 2) http://physics.nist.gov/PhysRefData/ASD [NASA ADS] [CrossRef] [Google Scholar]
- TFR Group. 1980, Plasma Phys., 22, 851 [NASA ADS] [CrossRef] [Google Scholar]
- Verma, N., Jha, A. K. S., & Mohan, M. 2006, ApJS, 164, 297 [NASA ADS] [CrossRef] [Google Scholar]
- Verma, N., Jha, A. K. S., & Mohan, M. 2007, Eur. Phys. J. D, 42, 235 [NASA ADS] [CrossRef] [EDP Sciences] [Google Scholar]
- Verner, D. A., & Ferland, G. J. 1996, ApJS, 103, 467 [NASA ADS] [CrossRef] [Google Scholar]
- Werner, N., Durret, F., Ohashi, T., Schindler, S., & Wiersma, R. P. C. 2008, Space Sci. Rev., 134, 337 [NASA ADS] [CrossRef] [Google Scholar]
- Zeng, J. L., Wang, Y. G., Zhao, G., & Yuan, J. M. 2006, Chin. Phys., 15, 1502 [NASA ADS] [CrossRef] [Google Scholar]
All Tables
Table 1:
Radial scaling parameters, ![]() ,
for the n=3 valence orbitals optimized in the
Slater-type-orbital model potential.
,
for the n=3 valence orbitals optimized in the
Slater-type-orbital model potential.
Table 2:
Dominant radiative transition data from the ground state of the
recombining ion
![]() ,
where
,
where ![]() denotes
denotes ![]() .
.
Table 3:
The lowest ![]() core excitation thresholds (in Rydbergs) for K II
and Ca III.
core excitation thresholds (in Rydbergs) for K II
and Ca III.
Table 4:
The lowest ![]() core excitation thresholds (in Rydbergs) for V VI
and Cr VII.
core excitation thresholds (in Rydbergs) for V VI
and Cr VII.
Table 5:
The lowest ![]() core excitation thresholds (in Rydbergs) for Mn VIII
and Fe IX.
core excitation thresholds (in Rydbergs) for Mn VIII
and Fe IX.
Table 6:
The lowest ![]() core excitation thresholds (in Rydbergs) for Co X
and Ni XI. Uncertainties are enclosed in
lower parentheses.
core excitation thresholds (in Rydbergs) for Co X
and Ni XI. Uncertainties are enclosed in
lower parentheses.
Table 7:
The lowest ![]() core excitation thresholds (in Rydbergs) for Cu XII
and Zn XIII. Uncertainties are enclosed in
lower parentheses.
core excitation thresholds (in Rydbergs) for Cu XII
and Zn XIII. Uncertainties are enclosed in
lower parentheses.
Table 8:
Fitting parameters ![]() and
and
![]() used
for modeling the Maxwellian-averaged DR rate coefficients - see
Eq. (5).
Uncertainties are enclosed in lower parentheses, where
used
for modeling the Maxwellian-averaged DR rate coefficients - see
Eq. (5).
Uncertainties are enclosed in lower parentheses, where
![]() denotes
denotes
![]() .
.
Table 9:
Fit coefficients for total ground state RR rate coefficients of
recombining ions, see Eq. (6), where
![]() denotes
denotes
![]() with
uncertainties given in lower parentheses.
with
uncertainties given in lower parentheses.
All Figures
|
|
Figure 1: Comparison of existing total DR ground-level rate coefficients for K II ( left) and Ca III ( right): (a) red solid curve, empirical results of Mewe et al. (1980); (b) black solid curve, recommended data of Mazzotta et al. (1998); red dashed curve, present MCBP results. RR channels are also shown as the long-dashed curve. |
| Open with DEXTER | |
| In the text | |
|
|
Figure 2: Comparison of existing total DR ground-level rate coefficients for Sc IV ( left) and Ti V ( right): (a) gray open circles, TSR experiments by Schippers et al. (1998,2002); (b) black doted curve, compilation by Landini & Fossi (1991); (c) black dash-dotted curve, empirical formula of Hahn (1991); (d) black solid curve, recommended value by Mazzotta et al. (1998); (e) black dashed curve, empirical results of Mewe et al. (1980). The present RR results are also shown as the long-dashed curve. |
| Open with DEXTER | |
| In the text | |
|
|
Figure 3: Comparison of existing total DR ground-level rate coefficients for V VI ( left) and Cr VII ( right): (a) red solid curve, empirical results of Mewe et al. (1980); (b) black solid curve, recommended data of Mazzotta et al. (1998); (c) black dash-dotted curve, empirical formula of Hahn (1991); red dashed curve, present MCBP results. RR channels are also shown as the long-dashed curve. |
| Open with DEXTER | |
| In the text | |
|
|
Figure 4: Comparison of existing total DR ground-level rate coefficients. On the left is for Mn VIII: (a) red solid curve, empirical results of Mewe et al. (1980); (b) black solid curve, recommended data of Mazzotta et al. (1998); (c) green solid curve, LS results of Jacobs & Davis (1983); red dashed curve, present MCBP results. On the right is Fe IX: black dots with error bars, TSR experiment by Schmidt et al. (2008); (a) red solid curve, empirical results of Mewe et al. (1980); (b) blue solid curve, compilation of Arnaud & Raymond (1992); (c) black solid curve, result of Jacobs et al. (1977); (d) green solid curve, empirical data of Kato & Asano (1999); (e) black dash-dotted curve, empirical formula of Hahn (1991); (f) ``4CF'' and ``5CF'' MCBP results of Badnell (2006); red dashed curve, present ``18CF'' MCBP results; The present RR results are also shown as the long-dashed curve. |
| Open with DEXTER | |
| In the text | |
|
|
Figure 5: Comparison of existing total DR ground-level rate coefficients. On the left is for Co X: (a) red solid curve, empirical results of Mewe et al. (1980); (b) black solid curve, recommended data of Mazzotta et al. (1998); red dashed curve, present MCBP results. On the right is for Ni XI ion: (a) red solid curve, empirical results of Mewe et al. (1980); (b) black solid curve, recommended data of Mazzotta et al. (1998); (c) black dash-doted curve, empirical formula of Hahn (1991); (d) blue solid curve, compilation of Arnaud & Rothenflug (1985); (e) green solid curve, empirical data of Kato & Asano (1999); red dashed curve, the present MCBP results. RR channels are also shown as the long-dashed curve. |
| Open with DEXTER | |
| In the text | |
|
|
Figure 6: Comparison of existing total DR ground-level rate coefficients for Cu XII ( left) and Zn XIII ( right): (a) red solid curve, empirical results of Mewe et al. (1980); (b) black solid curve, recommended data of Mazzitelli & Mattioli (2002); red dashed curve, present MCBP results. RR channels are also shown as the long-dashed curve. |
| Open with DEXTER | |
| In the text | |
|
|
Figure 7:
Present Maxwellian-averaged DR and RR rate coefficients for K II
( left) and Ca III (
right).
The red and gray dashed curves are the total DR and RR rate
coefficients, respectfully. The intra-shell
|
| Open with DEXTER | |
| In the text | |
|
|
Figure 8:
Present Maxwellian-averaged DR and RR rate coefficients for Sc IV
( left) and Ti V (
right).
The red and gray dashed curves are the total DR and RR rate
coefficients, respectfully. The intra-shell
|
| Open with DEXTER | |
| In the text | |
|
|
Figure 9:
Present Maxwellian-averaged DR and RR rate coefficients for V VI
- Zn XIII ions.
The red and gray dashed curves are the total DR and RR rate
coefficients, respectfully. The intra-shell
|
| Open with DEXTER | |
| In the text | |
Copyright ESO 2010
Current usage metrics show cumulative count of Article Views (full-text article views including HTML views, PDF and ePub downloads, according to the available data) and Abstracts Views on Vision4Press platform.
Data correspond to usage on the plateform after 2015. The current usage metrics is available 48-96 hours after online publication and is updated daily on week days.
Initial download of the metrics may take a while.