| Issue |
A&A
Volume 525, January 2011
|
|
|---|---|---|
| Article Number | A141 | |
| Number of page(s) | 14 | |
| Section | Interstellar and circumstellar matter | |
| DOI | https://doi.org/10.1051/0004-6361/201014152 | |
| Published online | 09 December 2010 | |
N2H+ depletion in the massive protostellar cluster AFGL 5142
1
Departament d’Astronomia i Meteorologia (IEEC-UB)Institut de Ciències del
Cosmos, Universitat de Barcelona, Martí i Franquès 1, 08028
Barcelona, Catalunya,
Spain
e-mail: gbusquet@am.ub.es
2
Harvard-Smithsonian Center for Astrophysics,
Cambridge, MA, 02138, UK
3
Department of Physics and Astronomy, University College
London, Grower
Street, London
WC1E 6BT,
UK
4
Institut de Ciències de l’Espai (CSIC-IEEC), Campus UAB, Facultat
de Ciències, Torre C-5 parell,
08193, Bellaterra, Catalunya, Spain
5
Academia Sinica Institute of Astronomy and Astrophysics,
Taipei,
Taiwan
Received:
28
January
2010
Accepted:
22
August
2010
Aims. We aim at investigating the NH3/N2H+ abundance ratio toward the high-mass star-forming region AFGL 5142 with high angular resolution in order to study whether the NH3/N2H+ ratio behaves similarly to the low-mass case, for which the ratio decreases from starless cores to cores associated with young stellar objects (YSOs).
Methods. CARMA was used to observe the 3.2 mm continuum and N2H+ (1–0) emission toward AFGL 5142. We used NH3 (1, 1) and (2, 2), as well as HCO+ (1–0) and H13CO+ (1–0) data available from the literature, to study the chemical environment. Additionally, we performed a time-dependent chemical modeling of the region.
Results. The 3.2 mm continuum emission reveals a dust condensation of ~23 M⊙ associated with the massive YSOs, deeply embedded in the strongest NH3 core (hereafter central core). The dense gas emission traced by N2H+ reveals two main cores, the western core of ~0.08 pc in size and the eastern core of ~0.09 pc, surrounded by a more extended and complex structure of ~0.5 pc, mimicking the morphology of the NH3 emission. The two cores are located to the west and to the east of the 3.2 mm dust condensation. Toward the central core the N2H+ emission drops significantly, indicating a clear chemical differentiation in the region. The N2H+ column density in the central core is one order of magnitude lower than in the western and eastern cores. Furthermore, we found low values of the NH3/N2H+ abundance ratio ~50–100 toward the western and eastern cores and high values up to 1000 associated with the central core. The chemical model used to explain the differences seen in the NH3/N2H+ ratio indicates that density along with temperature is a key parameter in determining the abundances of both NH3 and N2H+. The high density (n ≃ 106 cm-3) and temperature (T ≃ 70 K) reached in the central core allow molecules such as CO to evaporate from grain mantles. The CO desorption causes a significant destruction of N2H+, which favors the formation of HCO+. This result is supported by our observations, which show that N2H+ and HCO+ are anticorrelated in the central core. The observed values of the NH3/N2H+ ratio in the central core can be reproduced by our model for times of t ≃ 4.5−5.3 × 10⁵ yr, while in the western and eastern cores the NH3/N2H+ ratio can be reproduced by our model for times in the range 104−3 × 10⁶ yr.
Conclusions. The NH3/N2H+ abundance ratio in AFGL 5142 does not follow the same trend as in regions of low-mass star formation mainly because of the high temperature reached in hot cores.
Key words: astrochemistry / stars: formation / ISM: individual objects: AFGL 5142 / ISM: clouds / ISM: molecules / ISM: abundances
© ESO, 2010
1. Introduction
It is well known that N-bearing molecules, such as NH3 and N2H+, are excellent tracers of the interstellar dense gas because none of these molecules deplete onto dust grains until densities reach ~106 cm-3 (Bergin & Langer 1997; Tafalla et al. 2004; Flower et al. 2006). Thus observations of these dense gas tracers have become a powerful tool when studying the sites of star formation. However, only a few observational studies have focused on comparing NH3 and N2H+ cores, and these studies, which were carried out toward low-mass star-forming regions, find that the NH3/N2H+ abundance ratio is around 60–90 close to the young stellar objects (YSOs), while it rises to 140–190 in starless cores (Caselli et al. 2002a; Hotzel et al. 2004; Friesen et al. 2010). In the intermediate-mass cores surrounding the high-mass star IRAS 20293+3952, Palau et al. (2007) find the same trend, with a high NH3/N2H+ ratio, up to 300, in the cores with starless properties, and around 50 for the cores associated with YSOs, clearly showing that chemical differentiation is important in the region. All these studies show that the NH3/N2H+ abundance ratio is consistent with being a “chemical clock”.
To investigate the behavior of the NH3/N2H+ abundance ratio in high-mass star-forming regions and see if the NH3/N2H+ ratio in massive YSOs shows the same trend as in the low-mass regime, we carried out observations and chemical modeling of the high-mass star-forming region AFGL 5142, located at a distance of 1.8 kpc (Snell et al. 1988) in the Perseus arm. The region was selected as a good candidate for studying the NH3/N2H+ ratio because the high angular resolution NH3 emission reveals several dense cores, which have very different temperatures, and one of them is associated with star formation in clustered mode with the presence of hot cores.
The region consists of two main centers of high-mass star formation in different evolutionary stages. The brightest near-infrared source (Hunter et al. 1995) IRAS 05274+3345, with a bolometric luminosity of 3.8 × 10³ L⊙ (Carpenter et al. 1990), lies near the western edge of the NH3 gas (Estalella et al. 1993) and a lack of dense gas emission associated with it suggests that the IRAS source is a more evolved region, which is consistent with detection of optical nebulosity (Eiroa et al. 1994). Based on its position in the J vs. J − H diagram, Chen et al. (2005) classify the IRAS source as a B2 star of 3 Myr. Torrelles et al. (1992) detect a faint radio continuum source, IRAS 05274+3345 East (hereafter referred as AFGL 5142), about 30′′ to the east of the IRAS source, which coincides with the peak position of the dust emission at 3.4 mm (Hunter et al. 1999) and the NH3 emission peak (Estalella et al. 1993). Assuming that the centimeter emission arises from an optically thin H ii region, the flux density is equivalent to a zero-age main sequence (ZAMS) star of spectral type B2 or earlier (Torrelles et al. 1992; Hunter et al. 1995) with a luminosity of 4 × 10³ L⊙.
In the near-infrared, Hunter et al. (1995) report a cluster of 28 embedded sources in a region of 1′ (~0.3 pc in radius) near the position of the radio continuum source. Recently, Qiu et al. (2008) carried out Spitzer Space Telescope IRAC and MIPS observations toward AFGL 5142. The authors identify 44 YSOs, 20 of them clustered around the central massive star and surrounded by a more extended and sparse distribution of young stars and protostars. In addition, high angular resolution observations of maser emission reveal a cluster of H2O and CH3OH masers in an area of ~5′′ (Hunter et al. 1995; Goddi & Moscadelli 2006; Goddi et al. 2007). Subsequent observations with the very large array (VLA) in the A configuration at 8.4 GHz and with the submillimeter array (SMA) at 1.2 mm with ~1′′ of angular resolution were carried out by Zhang et al. (2007), who find that the centimeter source is resolved into three peaks, and that the 3.4 mm source detected by Hunter et al. (1999) actually consists of five millimeter sources. Regarding the molecular outflow emission in this region, Zhang et al. (2007) identify three molecular outflows in CO (2–1) and SO 65–54, one of them coinciding with an HCO+ outflow and the well-collimated SiO jet detected by Hunter et al. (1999). All three outflows appear to originate from the dust condensation in a region of about 3′′. All this information indicates that active star formation in clustered mode is taking place in AFGL 5142.
The dense gas emission in this region has been studied with single-dish telescopes in NH3, CS, HCN, HCO+, CH3OH, and CH3CN (Verdes-Montenegro et al. 1989; Estalella et al. 1993; Hunter et al. 1995, 1999; Cesaroni et al. 1999). In particular, the dense gas emission traced by the NH3 molecule has been observed with high angular resolution using the VLA (Zhang et al. 2002). The high angular resolution NH3 emission consists of a central and compact core associated with the dust condensation, harboring at least three intermediate/high-mass young stars, surrounded by fainter NH3 cores located in a more extended structure with no signs of stellar activity (either maser nor molecular outflow emission associated with it) indicating that the region may harbor cores in different evolutionary stages. The presence of cores containing massive star(s), together with cores with no star-formation activity, makes this region a good choice for studying how the NH3/N2H+ ratio behaves in high-mass star-forming regions.
In this paper we report CARMA observations of the continuum emission at 3.2 mm and the dense gas traced by N2H+ (1–0) toward AFGL 5142. The paper layout is as follows. In Sect. 2 we summarize our observations and the data reduction process. In Sect. 3 we present the main results for the continuum and N2H+ molecular line emission. In Sect. 4 we analyze the molecular emission of several species by computing their column density maps. In Sect. 5 we show the main results of the chemical model to qualitatively reproduce the abundances of the region. Finally, in Sect. 6 we discuss our findings, and we list the main conclusions in Sect. 7.
2. Observations
The Combined Array for Research in Millimeter-wave Astronomy1 (CARMA) was used to observe the 3.2 mm continuum and the N2H+ (1–0) emission toward AFGL 5142. CARMA consists of six 10 m and nine 6 m antennas located at 2200 m elevation at Cedar Flat in the Inyo Mountains of California. The observations were carried out on 2007 February 4 and March 11 using the array in the C configuration with 14 antennas in the array. The projected baselines ranged from 26 to 370 m. The phase center was set at  ,
,  . The FWHM of the primary beam at the frequency of the observations was 132′′ for the 6 m antennas and 77′′ for the 10 m antennas. System temperatures were around 250 K during both days.
The digital correlator was configured to observe simultaneously the continuum emission and the N2H+ (1–0) group of the hyperfine transitions (93.176331 GHz, in the lower sideband). The continuum data were recorded in two ~500 MHz bands covering the frequency ranges 93.44–93.88 GHz and 96.74–97.18 GHz from the receiver lower and upper sidebands, respectively. We used two consecutive bands of 8 MHz of bandwidth with 63 channels in each band, providing a spectral resolution of 0.42 km s-1 to observe the N2H+ (1–0) emission.
Phase calibration was performed with the quasars 0530+135 and 0555+398, with typical rms in the phases of 12° and 8°, respectively. The absolute position accuracy was estimated to be around  . Flux and bandpass calibration was set by using 3C84. Data were calibrated and imaged using the standard procedures in MIRIAD (Sault et al. 1995). We combined the data from both days of observations. The rms in the naturally weighted maps is ~0.7 mJy beam-1 in the continuum, and ~55 mJy beam-1 per 0.42 km s-1 channel in the line data. The synthesized beam of the continuum image is
  , PA = 68.8°. For the line emission, which is more extended than the continuum, we applied a uv-taper function of 52 kλ (
 in the image plane) to improve the signal-to-noise ratio and to recover the extended emission. The resulting synthesized beam is
  , with PA = 79.1°. The continuum and N2H+ emissions were cleaned using a box around the emitting region.
3. Results
3.1. Continuum emission
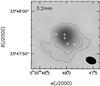 |
Fig. 1 3.2 mm continuum emission toward AFGL 5142. Contour levels range from 3 to 60σ in steps of 3σ, where σ is the rms of the map, 0.7 mJy beam-1. The synthesized beam, shown in the bottom right corner, is |
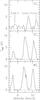 |
Fig. 2 N2H+ (1–0) spectra toward three positions of AFGL 5142. The three positions labeled on each panel are, from top to bottom, CC (NH3 peak or central core), EC (peak of the eastern core), and WC (peak of the western core, see Fig. 4). |
Figure 1 presents the continuum map at 3.2 mm. We detected a single millimeter peak associated with IRAS 05274+3345 East (we could not resolve the two main 1.2 mm peaks MM-1 and MM-2, separated by about 1′′, detected with the SMA by Zhang et al. 2007). The millimeter continuum emission has a single compact peak component with a flux density of 107.1 ± 1.6 mJy, surrounded by a more extended and flattened emission elongated in the west and southeast directions. A 2D Gaussian fit to the compact component yields a deconvolved size of  , PA = 16.5° (5200 AU at the distance of the source). The peak position is
  ;
;  . The total flux density when taking into account the extended emission is 126.4 ± 3.1 mJy, in very good agreement with the flux density at 88 GHz reported by Hunter et al. (1999), which is ~125 mJy. Assuming that the dust emission is optically thin, and using the dust opacity law of Hildebrand (1983), with a dust emissivity index of β = 1 (see Zhang et al. 2007, for a description of its derivation), and for a dust temperature of 45 K (based on the estimation of Hunter et al. 1999) the total mass of dust and gas from thermal continuum emission is 23 M⊙ (after correcting for the expected contribution, ~4%, from the ionized gas; see Hunter et al. 1999). This mass is consistent with the mass estimated from the 1 mm SMA observations (~21 M⊙). Although Zhang et al. (2007) report a mass of 50 M⊙, the difference arises from the value adopted for the dust emissivity index, β = 1.5 instead of 1. There is a factor of 4 in the uncertainty of the mass, mainly due to uncertainties in the dust opacity and the dust emissivity index.
3.2. Molecular line emission: N2H+
Parameters of the hyperfine fits to the N2H+ (1–0) line for the central position of each core.
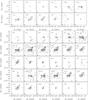 |
Fig. 3 Top panel: N2H+ (1–0) channel maps for the hyperfine F1F = 01 → 12 (isolated line) toward AFGL 5142. Contour levels are −2, 2, 4, 6, 8, 10, and 12 times the rms noise of the maps, 0.055 Jy beam-1. Bottom panel: N2H+ (1–0) channel maps for the hyperfine F1F = 21 → 11, 23 → 12, 22 → 11, and F1F = 11 → 10, 12 → 12, and 10 → 11. Contour levels are −4, −2, 2, 4, 6, 8, 10, 12, and 14 times the rms of the map, 0.055 Jy beam-1. In all panels the cross marks the position of the 3.2 mm continuum source. The synthesized beam is shown in the bottom left corner. Velocities referres to the F1F = 01 → 12 hyperfine with the systemic velocity vLSR= −3 km s-1. |
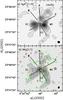 |
Fig. 4 a) N2H+ zero-order moment integrated for all the hyperfine components of the (1–0) transition. Contours start at 3%, increasing in steps of 10% of the peak intensity, 6.01 Jy beam-1km s-1. b) NH3 (1, 1) zero-order moment (Zhang et al. 2002). Contours start at 10%, increasing in steps of 10% of the peak intensity, 0.202 Jy beam-1km s-1. The synthesized beams, |

In Fig. 2 we show the N2H+ (1–0) spectra not corrected for the primary beam response at some selected positions of AFGL 5142, and in Table 1 we present the line parameters obtained from the fit of the hyperfine spectra toward these positions. Figure 3 presents the velocity channel maps for the N2H+ (1–0) emission toward AFGL 5142. The channel with maximum intensity for the hyperfine component F1F = 01 → 12 was found at the velocity v = −3.5 km s-1. The systemic velocity of the cloud is vLSR = −3 km s-1.
The zero-order moment map integrated for all the hyperfine transitions is presented in Fig. 4a. For comparison, we also show (in Fig. 4b) the NH3 (1, 1) integrated intensity map from Zhang et al. (2002) overlaid with the cluster of infrared sources reported in recent studies (Hunter et al. 1995; Chen et al. 2005; Qiu et al. 2008) in order to have a complete view of the stellar content in AFGL 5142. The overall structure of the integrated N2H+ (1–0) emission consists of two main cores, located to the west and to the east of the dust condensation (hereafter western and eastern cores), surrounded by a more extended structure with an X-shape morphology, roughly following the same morphology as the NH3 emission. As can be seen in Fig. 4, the western core seems to contain at least one infrared source embedded in the dense gas, located close to the position of the NH3 peak, and it displays typical characteristics of protostars (Chen et al. 2005), whereas the infrared source lying close to the peak position of the eastern core has no associated infrared excess and has been classified as a Herbig Ae/Be or T Tauri star (Chen et al. 2005). However, there is no clear evidence that these infrared sources are really associated with the dense gas. Additionally, since the sensitivity of Spitzer observations is ~1 M⊙ (Qiu et al. 2008) and that of near-infrared studies is ~0.2–0.4 M⊙ (Chen et al. 2005), we cannot discard the possibility of more infrared sources embedded in the dense gas. A 2D Gaussian fit to the western and eastern cores yields deconvolved sizes of ~ (~0.08 × 0.07 pc) and ~
 (~0.09 × 0.07 pc), respectively. Interestingly, toward the dust condensation where the intermediate/high-mass stars are deeply embedded in the strongest and compact NH3 core (hereafter central core), the N2H+ emission decreases drastically. However, the central core is detected in N2H+ in some velocity channels from 7 km s-1 to 8.7 km s-1, and its peak positions is slightly shifted to the east (~2′′) from the dust and NH3 peaks.
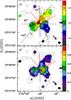 |
Fig. 5 a) First-order moment map (velocity) for the hyperfine F1F = 01 → 12 line of N2H+ (1–0) toward AFGL 5142 (color scale); b) second-order moment map (velocity dispersion) for the hyperfine F1F = 01 → 12 line of N2H+ (1-0) (color scale). In both figures, black contours are the same as in Fig. 4a, showing the N2H+ (1–0) emission, with contours starting at 3%, and increasing in steps of 10% of the peak intensity. Color scales are in km s-1. The synthesized beam is shown in the bottom right corner of the image. The black cross marks the position of the 3.2 mm source reported in this work. Blue and red lines represent the direction of outflows A, B, and C (Zhang et al. 2007), and the black dashed line in the top panel indicates the position-velocity cuts (see Fig. 6). The second-order moment gives the velocity dispersion and must be multiplied by the factor 2 |

We used the hyperfine component F1F = 01 → 12 to study the kinematics of the N2H+ emission seen from Fig. 3 since this hyperfine component is strong and not blended with the other hyperfine components. In Fig. 5a we show the first-order moment map (intensity weighted mean vLSR), and in Fig. 5b the second-order map (intensity weighted velocity dispersion) for this hyperfine component.
The first-order moment map shows that the eastern and western cores appear at different velocities (see also the channel maps shown in Fig. 3). Toward the eastern core there is a small velocity gradient in the east-west direction from ~−3.5 km s-1 to ~−1.8 km s-1. On the other hand, the western core shows a velocity gradient from ~−4.7 km s-1 to ~−2.6 km s-1 with increasing velocities from the southwest to the northeast. In fact, as can be seen in Fig. 5b, the emission from the western core has very broad lines, with a velocity dispersion of ~0.8–1 km s-1, which corresponds for a Gaussian line profile, to a FWHM of  , where σv is the velocity dispersion of ~1.8–2.3 km s-1 (corrected for instrumental resolution) at the eastern side of the western core. This region of broad emission coincides with the passage of outflow B of Zhang et al. (2007). The values around ~2 km s-1 are significantly higher than the thermal line width ~0.2–0.3 km s-1 (estimated for a kinetic temperature of 25 K and 45 K, respectively), indicative of N2H+ having a significant contribution from nonthermal processes, such as turbulence injected by the molecular outflows, and/or global systematic motions. Regarding the eastern core, the typical value found for the velocity dispersion is in the range ~0.3–0.5 km s-1, corresponding to line widths of ~0.2–1.1 km s-1 (corrected for instrumental resolution). In addition, there is a clumpy cavity structure toward the northwest clearly visible in the −2.6 and −2.2 km s-1 channel maps of Fig. 3, which appear redshifted by ~1 km s-1 with respect to the systemic velocity.
In Fig. 6a we present the position-velocity (PV) plot made across the east-west direction (PA = 90°), encompassing the N2H+ peaks of the western and eastern cores, which clearly shows a ring-like structure with the western core having very broad line widths. The line broadening of ~3.5 km s-1 is also seen in the PV-plot made across the western core at PA = 15° (Fig. 6b). Additionally, we performed a third cut at PA = 140° (Fig. 6c), picking up the eastern side of the cavity and the eastern core. From this plot, it seems that there are two structures, a velocity gradient associated with the eastern core of ~1.5 km s-1 in a region of 7′′ and a curve structure associated with the cavity. The curve structure seen in the PV-plot of Fig. 6c suggests that the cavity is expanding. Overall it seems that both cuts, at PA = 90° and PA = 140°, reveal expanding motions, suggesting that these motions could be produced by a combination of stellar winds, radiation, and/or molecular outflows from the central cluster. As a result, the AFGL 5142 cluster seems to be in process of disrupting the natal cloud. However, we will not discuss the kinematics of the region further since it is not the aim of this paper.
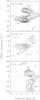 |
Fig. 6 N2H+p − v plot for the F1F = 01 → 12 hyperfine at a) PA = 90° (along the eastern and western cores). Channel maps have been convolved with a beam 6′′ × 2′′ with PA perpendicular to the direction of the cut. Contours start at 10%, increasing in steps of 5% of the peak emission, 0.408 Jy beam-1. The central position corresponds to the 3.2 mm source. Positive offsets are toward the east; b) PA = 15°. Channel maps have been convolved with a beam 2′′ × 2′′. Contours start at 10%, increasing in steps of 10% of the peak emission, 0.601 Jy beam-1. The central position is taken at the peak position of the western core, which is Δ x = −6.5′′, Δ y = −3′′ offset from the phase center. Positive offsets are toward the northeast. c) PA = 140°. Contours start at 20%, and increase in steps of 10% of the peak emission, 0.376 Jy beam-1. Positive offsets are toward the southeast. The central position corresponds to Δ x = 3.9′′, Δ y = −0.59′′ offset from the phase center. In all panels, the vertical dashed line indicates the systemic velocity, vLSR= −3 km s-1. |
4. Analysis
4.1. Column density maps
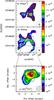 |
Fig. 7 a) N2H+ column density map. b) NH3 column density map. c) H13CO+ column density map overlaid with the 3.2 mm continuum emission (contours). In all panels scale units are cm-2. The synthesized beam, ~4′′, is shown in the bottom right corner of each panel. The white cross marks the position of the 3.2 mm peak. |
We studied the chemical environment of AFGL 5142 by analyzing the column density of several molecular species. We used the N2H+ (1–0) (this work), NH3 (1, 1) and NH3 (2,2) from Zhang et al. (2002), and HCO+ (1–0) and H13CO+ (1–0) from Hunter et al. (1999) data. To properly compare the emission of all the molecules, we convolved the N2H+, NH3, HCO+, and H13CO+ channel maps to obtain a final circular beam of ~4′′. We computed the column density maps by extracting the spectra for positions in a grid of 1′′ × 1′′. Using CLASS we fitted the hyperfine structure of each spectrum for N2H+ (1–0) and NH3 (1, 1), and a single Gaussian for the NH3 (2, 2), HCO+ (1–0) and H13CO+ (1–0). We fitted only those positions with an intensity greater than 5σ for N2H+ (1–0) and NH3 (1, 1) in order to ensure we are detecting all the hyperfine components, whereas for the other molecular species we fitted the spectra with an intensity greater than 4σ. In the following sections we show the method used to compute the column density for each molecule. The main results are summarized in Table 2.
4.1.1. N2H+
We used the hyperfine structure fitting program in CLASS (Forveille et al. 1989) adopting the hyperfine frequencies given in Caselli et al. (1995) to determine the vLSR, the intrinsic line widths, total optical depths, and excitation temperatures (Tex) in each position of the grid. The value of Tex was derived assuming a filling factor of 1. As shown in Table 1, the excitation temperature, Tex, derived from the hyperfine fits in the eastern core is in the range ~14–16 K, while Tex has lower values around ~10–12 K and ~8–9 K for the western and central cores, respectively.
The results obtained from the fits indicate that the N2H+ emission is essentially optically thin for most of the region (τTOT ≃ 0.3–0.6); however, the optical depth in the western core reaches higher values, around τTOT ≃ 1.5–2. We calculated the N2H+ column density, corrected for the primary beam response, following the expression given in Caselli et al. (2002b), and approximating the partition function to Qrot ≃ (kTex/hB) ~0.4473 Tex, where k is the Boltzmann constant, Tex the excitation temperature, h the Planck constant, and B the rotational constant of N2H+.
Figure 7a shows the resulting N2H+ column density map. Clearly, we found important variation in the N2H+ column density in AFGL 5142. The highest value of the N2H+ column density, 3 × 1013 cm-2, is reached in the western core. Toward the eastern core we found values of the N2H+ column density around ~1 × 1013 cm-2, while the N2H+ column density has the lowest values, around ~1−5 × 1012 cm-2, toward the millimeter condensation, i.e., toward the central core (see Table 2). The values found in the western and eastern cores are in good agreement with the N2H+ column densities reported by Pirogov et al. (2003, 2007) for dense molecular cloud cores with massive stars and star clusters and Fontani et al. (2006) for a sample of high-mass protostellar candidates. In addition, the values of the N2H+ column density found in the western and eastern cores of AFGL 5142 are also consistent with those reported in recent studies conducted toward massive star-forming regions observed with interferometers (e.g., Palau et al. 2007; Beuther & Henning 2009), but those obtained in the central core are clearly below. It is important to emphasize the difference of 1 order of magnitude in the N2H+ column density in the central core compared to the western and eastern cores. The uncertainty in the N2H+ column density lies between 25 and 50%, and it has been estimated taking into account the uncertainty in the output parameters of CLASS and the uncertainty in the calibration.
4.1.2. NH3
The optical depth of the main line derived from the NH3 emission is in the range τTOT ≃ 1.5–2.5 toward the central and compact NH3 core containing the intermediate/high-mass stars, while the emission in the extended structure is optically thin.
From the results of the fits of the NH3 (1, 1) and NH3 (2, 2) spectra, we derived the rotational temperature (Trot) and computed the NH3 column density map following the procedures described in Ho & Townes (1983) and Harju et al. (1993) (see also the appendix of Busquet et al. 2009 for a description of the method). It is worth noting that the rotational temperature map obtained from this analysis is similar to the NH3 (2, 2)/NH3 (1, 1) intensity map presented in Zhang et al. (2002).
The NH3 column density map, corrected for the primary beam attenuation, is shown in Fig. 7b. The map shows small variations along the entire cloud. In contrast to N2H+, the NH3 column density reaches the maximum value, around 3 × 1015 cm-2, toward the central core at the position of the millimeter condensation, and where we found the minimum N2H+ column density (see Table 2). The values found for the NH3 column density toward AFGL 5142 are similar to those obtained by Palau et al. (2007) in the massive star-forming region IRAS 20293+3952. The uncertainty in the NH3 column density is ~15–25%, estimated from the uncertainty in the rotational temperature (see Busquet et al. 2009), the output parameters of CLASS, and the uncertainty in the calibration.
Average column density for each dense core.
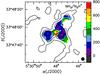 |
Fig. 8 Color scale: N(NH3)/N(N2H+) abundance ratio map overlaid with the N2H+ emission (black contour), with contours starting at 3%, and increasing in steps of 20% of the peak intensity. The synthesized beam, ~4′′, is shown in the bottom right corner. The white cross marks the position of the 3.2 mm peak. |
4.1.3. H13CO+
To derive the H13CO+ column density, we assumed that H13CO+ (1–0) emission is optically thin while HCO+ (1–0) is optically thick. The H13CO+ (1–0) optical depth has been estimated from the ratio of the H13CO+ and HCO+ integrated intensity emission obtained from Gaussian fits and excluding the high-velocity components of HCO+ (1–0) coming from molecular outflow emission.
Assuming that all levels are populated according to the same excitation temperature Tex and approximating the partition function to kTex/hB, with B the rotational constant of the molecule, the column density of a linear molecule obtained from the transition J → J − 1 is 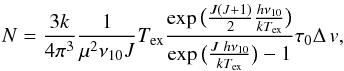 (1)where μ is the electric dipole momentum of the molecule, ν10 the frequency of the transition J = 1 → 0, and τ0 the opacity at the line center.
For the particular case of H13CO+ (1–0) molecular transition, μ = 3.88 Debye = 3.88 × 10⁻¹⁸ (cgs), ν10 = 86.754 GHz, the column density can be written, in practical units, as ![\begin{equation} \Big[\frac{N(\mathrm{H^{13}CO^{+}})}{\mathrm{cm^{-2}}}\Big]=2.56\times10^{11}\frac{1}{1-{\rm e}^{-4.16/T_\mathrm{ex}}}\Big[\frac{T_\mathrm{ex}}{\mathrm{K}}\Big]\tau_{0}\Big[\frac{\Delta\,v}{\mathrm{km\, s^{-1}}}\Big]\cdot \label{eqhtcopcoldens} \end{equation}](/articles/aa/full_html/2011/01/aa14152-10/aa14152-10-eq159.png) (2)In Fig. 7c we present the H13CO+ column density map toward the central core of AFGL 5142. An obvious feature is that the H13CO+ column density map is correlated with the NH3 column density map, reaching the maximum value, around 5 × 1012 cm-2 toward the millimeter condensation, but is anticorrelated with the N2H+ column density. The values obtained for the H13CO+ column density are similar to those found toward regions of high-mass star formation (e.g., Zinchenko et al 2009). Taking the uncertainty in the output parameters of CLASS and the uncertainty in the calibration into account, we estimated an uncertainty in the H13CO+ column density around ~30–45%.
(2)In Fig. 7c we present the H13CO+ column density map toward the central core of AFGL 5142. An obvious feature is that the H13CO+ column density map is correlated with the NH3 column density map, reaching the maximum value, around 5 × 1012 cm-2 toward the millimeter condensation, but is anticorrelated with the N2H+ column density. The values obtained for the H13CO+ column density are similar to those found toward regions of high-mass star formation (e.g., Zinchenko et al 2009). Taking the uncertainty in the output parameters of CLASS and the uncertainty in the calibration into account, we estimated an uncertainty in the H13CO+ column density around ~30–45%.
4.2. The NH3/N2H+ abundance ratio map
Figure 8 shows the NH3/N2H+ abundance ratio map toward AFGL 5142. First of all, it is important to point out that the N2H+ spectra toward some positions of the central core have low signal-to-noise, so only a few positions with high enough signal-to-noise ratio were fitted properly, so hence the values obtained toward the central core, especially those toward the southwestern side of the millimeter condensation, are overestimated due to the interpolation process. A clear feature seen from the NH3/N2H+ ratio map is that the highest values, ranging from ~400 up to 1000, are reached close to the position of the central core (i.e., harboring a cluster of millimeter sources). We explicitly checked that such high values are real so not produced by the interpolation process. Toward the western core, which could contain a low-mass YSO, we found values of the NH3/N2H+ ratio around 50–100, whereas in the eastern core, maybe containing a more evolved object, the NH3/N2H+ ratio is around 50–100 toward the center of the core and increases up to 200 at the edges. In Table 2 we give the average value of the NH3/N2H+ ratio for these three cores. The uncertainty estimated for the NH3/N2H+ abundance ratio is around ~30–60%. As already pointed out by Zhang et al. (2002), the VLA NH3 data recover 65% of the flux observed by the Effelsberg 100 m telescope (Estalella et al. 1993), and the missing flux arises mainly from smooth structures with scales larger than 50′′. Unfortunately, we cannot estimate the amount of flux filtered out by CARMA in N2H+ due to the lack of short-spacing information. However, since the CARMA N2H+ and VLA NH3 images are sensitive to similar angular scales, the NH3/N2H+ ratio is not seriously affected by differences in the missing flux.
5. Chemical modeling
5.1. The UCL_CHEM model
We employed UCL_CHEM, a time- and depth- dependent chemical model similar to the one used in Viti & Williams (1999) and Viti et al. (2001, 2004) to study the behavior of the NH3/N2H+ abundance ratio. For simplicity, in this study we performed time-dependent single-point calculations. The model consists of a two-phase calculation. In phase I we follow the chemical and dynamical evolution of a collapsing core. This phase starts from a fairly diffuse medium (n ≃ 400 cm-3) in neutral atomic form (apart from a fraction of hydrogen in H2) that undergoes a collapse following the free-fall collapse law described in Rawlings et al. (1992) until densities typical of massive dense cores (n ≃ 105−107 cm-3) are reached. During this time, atoms and molecules from the gas freeze on to the dust grains and hydrogenate where possible, as in Viti & Williams (1999). The degree of freeze out or depletion, defined in terms of the depletion of the CO molecule, is a free parameter (although linked with density, see Rawlings et al. 1992), which we explore in this study. During phase I we adopted a constant temperature of 12 K and assumed a standard value for the cosmic ionization rate, ζ = 3 × 10-17 s-1. The initial gas-phase elemental abundances relative to hydrogen nuclei adopted in this work, based on the findings of Sofia & Meyer (2001), are listed in Table 3. We included 127 gas-phase species and 42 surface species interacting in 1869 chemical reactions adapted from the UMIST 2006 database (Woodall et al. 2007). During the collapse phase (phase I), we let the chemistry develop for 3 Myr, regardless of when the final density is reached.
Initial gas-phase elemental abundances relative to hydrogen nuclei.
Parameters of the UCL_CHEM model.
In phase II we explored the chemical evolution of the core that harbors a newly born massive star by simulating the presence of an infrared source at the center of the core and by subjecting the core to a time-dependent increase of the gas and dust temperature (assumed to be the same because of the high densities considered), which was performed differently depending on the core we were modeling. For the central core we adopted a maximum temperature of ~70 K, whereas the temperature toward the western and eastern cores is around ~25 K (both derived from NH3 data, see Zhang et al. 2002). During phase II we performed the same treatment for the increasing temperature and evaporation from grains as in Viti et al. (2004), which includes the experimental results on desorption from grains and the evaporation of icy mantles formed in star-forming regions (Collings et al. 2003a,b, 2004). In this case, the evaporation of a fraction of mantle species occur when the temperature for a particular desorption event is reached (see Viti et al. 2004, for a complete description). In phase II we followed the evolution of each core for 3 Myr.
5.2. Results
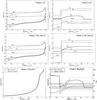 |
Fig. 9 Left: fractional abundances with respect to hydrogen as a function of time during phase I for the central core (top panel) and the western/eastern cores (middle panel). The NH3/N2H+ abundance ratio for both the central core and the western/eastern core are also shown in the bottom panel. Right: same as left panels but for phase II calculation. The y-axis ranges according to the model. In the bottom right panel we also show the temperature as a function of time, indicated by the thin lines. The two shaded areas mark the range of values (400–1000 for the central core and 50–200 for the western/eastern cores) of the NH3/N2H+ abundance ratio estimated from the observational data. |
We computed a grid of models to investigate the differences observed in the N2H+ column density and the NH3/N2H+ abundance ratio. For the central core we followed the chemical evolution of a core of 0.02 pc in diameter, whereas we adopted a size of 0.04 pc for the eastern and western cores. We explored a range of densities, n ≃ 105–107 cm-3, and for a particular density we used different percentages of freeze-out at the end of phase I. From this analysis we found that the observed values of the NH3/N2H+ ratio can be reproduced by our model using a high degree of depletion at the end of the collapse phase (phase I) and by adopting a density n ≃ 106 cm-3 for the central core and n ≃ 105 cm-3 for the western/eastern cores. It is worth noting that the model for the central core is supported by our estimate of the density from the dust continuum emission. Adopting the mass derived in this work (see Sect. 3.1) and a size of 6′′, we obtained a density of ~5 × 106 cm-3, consistent with the density adopted in the chemical model. In Table 4 we list the parameter choices for the two selected models (CC and WC/EC models), which can reproduce both the observed NH3 and N2H+ column densities and the NH3/N2H+ abundance ratio. In the following sections, we discuss the main results obtained by our chemical model for phases I and II.
5.2.1. Fractional abundances and the NH3/N2H+ abundance ratio during phase I
Results obtained from the chemical model.
In Fig. 9 (left panels) we present the fractional abundances (with respect to hydrogen nuclei) of some molecular species of interest (i.e., CO, N2,  , NH3, N2H+, and HCO+), together with the NH3/N2H+ abundance ratio as a function of time for the central core (CC model) and the western/eastern cores (WC/EC model) during phase I. First of all, the fractional abundances obtained for the central core (top panel) and the western/eastern cores (middle panel) do not show significant differences because they only differ in the core size and the final density reached at the end of this phase. As can be seen in Fig. 9, the fractional abundance of CO, N2, NH3, N2H+, and HCO+ increases with time (with a more pronounced increase for the case of CO, N2, and NH3), reaching its maximum value at times t ≃ 2.5 × 10⁶ yr. After this time, the fractional abundances start to decrease because molecules freeze out onto dust grains due to the low temperature (T ≃ 12 K) and high density (n ≃ 105−106 cm-3) achieved in these cores. On the other hand, the ion keeps more or less a constant abundance until t ≃ 2.5 × 10⁶ yr, and then its abundance rises moderately.
The primary formation route for N2H+ is through the reaction between H and N2, which also produces H2. N2H+ can then react with many atoms and molecules such as C, O, H2O, or CO to form N2. It is therefore clear that the abundance in the gas phase of these removal agents will be critical in determining the abundance of N2H+ present. At high densitites, but before the effects of freeze-out dominate, all the molecular species that are important in the removal of N2H+ and NH3 will be high. In particular, for both models the main formation route for N2H+ is initially H2 +  → N2H+ + H, and then the chemical reaction + N2 → N2H+ + H becomes important, while NH3 is mainly formed via dissociative recombination of
  . The latter is formed via consecutive hydrogenation of N+ (via reactions with molecular hydrogen).
During phase I the NH3/N2H+ abundance ratio behaves in the same way for both the central core and the western/eastern cores models, and only during the latest time steps does it depend on the adopted density (n ≃ 105 cm-3 for the western/eastern cores and n ≃ 106 cm-3 for the central core). In both cases, the NH3/N2H+ ratio starts from low values and reaches values around 1000 and even higher for t > 2.5 × 10⁶ yr because CO depletion favors the formation of NH3 against N2H+ in core centers at high densities. This suggests that long-lived starless cores are associated with high values of the NH3/N2H+ abundance ratio.
5.2.2. Fractional abundances and the NH3/N2H+ abundance ratio during phase II
Figure 9 (right panels) shows the fractional abundances (with respect to hydrogen nuclei) as a function of time of CO, N2, , NH3, N2H+, and HCO+ derived from our chemical model during phase II for the central core (top panel) and the western/eastern cores (middle panel). The fractional abundances in the central core clearly have a different behavior compared to that of the western and eastern cores as a consequence of the different density, and especially the different temperature reached at the end of phase II. In the central core, the fractional abundance of CO, N2, N2H+, and HCO+ is constant during the initial stages, and once the temperature increases, their fractional abundances rise significantly. On the other hand, the fractional abundance of the molecular ion decreases with time. This is of course because is highly reactive at high densities. The abrupt increase in the fractional abundance takes place at the same time for all molecules, around t ≃ 6.1 × 10³ yr (corresponding to a temperature of T ≃ 21 K). This time corresponds to the time when a fraction of weakly bound species evaporates from the grain mantle (see Table 1 in Viti et al. 2004). The fractional abundance of N2H+ reaches its maximum value 4.6 × 10⁻¹¹ (corresponding to a N2H+ column density of ~1.8 × 1012 cm-2) at t ≃ 1.7 × 10⁴ yr. The rapid destruction of N2H+ (by the chemical reaction N2H+ + CO → HCO+ + N2) occurs at t ≃ 2.3 × 10⁴ yr, with a variation in the fractional abundance of one oder of magnitude, with the N2H+ column density around ~8 × 1011 cm-2, consistent with the value estimated from the observations. On the other hand, HCO+ fractional abundance is constant at ~6 × 10⁻¹⁰. Assuming [HCO+/H13CO+] = 40, we estimated an H13CO+ column density of ~1.3 × 1012 cm-2, in good agreement with the estimation from the observational data (see Table 2). This chemical behavior could be explained in terms of CO desorption from grain mantles, which causes a substantial destruction of N2H+ favoring the formation of HCO+, where this reaction is the main removal mechanism of N2H+ for “standard” CO abundances of [CO/H2] ≃ 10-4 (Jørgensen et al. 2004b; Lee et al. 2004). In fact, as can be seen in Fig. 9 (top panel), the CO fractional abundance is ~10-4, high enough to lead to significant destruction of N2H+.
In contrast to the case of N2H+ and HCO+, the increase in the NH3 fractional abundance is slow, which indicates that gas phase chemistry dominates pure evaporation. This is simply a consequence of most of the ammonia being still locked in water ice; in fact, as shown by the experiments by Collings et al. (2004), ammonia is released back into the gas phase only if temperatures of ~100–120 K are reached (Viti et al. 2004). The maximum value, of 4.1 × 10⁻⁸ (or N(NH3) ≃ 3.2 × 1015 cm-2), is reached at t ≃ 1.3 × 10⁵ yr, and then it drops until it reaches a constant abundance of 1 × 10⁻⁹ (or a column density of ~8.2 × 1013 cm-2). This behavior, i.e., the decrease in the NH3 fractional abundance, takes place through reactions of the NH3 molecule with the ions C+ and HCO+. In this situation, the C+ fractional abundance increases at late stages, while the fractional abundance of HCO+ is more or less constant, which is consistent with HCO+ being produced from the destruction of N2H+ (see above) and destroyed through reactions with NH3.
Regarding the western and eastern cores, which were modeled assuming the same core size (~0.04 pc) and same temperature (the maximum temperature is 25 K), we found that the fractional abundance of NH3 increases moderately with time, while the fractional abundances of CO, N2, N2H+, and HCO+ rise considerably during the initial stages due to desorption effects, similar to the case of the the central core model. At t ≃ 4 × 10³ yr, N2H+ and HCO+ have constant abundance, around ~2 × 10⁻¹⁰ (N(N2H+) ≃ 4 × 1012 cm-2) and ~1.8 × 10⁻⁹ (N(HCO+) ≃ 3.6 × 1013 cm-2 or N(H13CO+) =9 × 1011 cm-2, assuming [HCO+/H13CO+] = 40) for N2H+ and HCO+, respectively, while the NH3 fractional abundance increases, up to ~5.2 × 10⁻⁸ (N(NH3) ≃ 1 × 1015 cm-2) at t ≃ 1.3 × 10⁵ yr, and then remains roughly constant, too. For these cores, the values obtained from the chemical modeling agree (within a factor of 2 in the case of N2H+, and a factor of 4 in the case of NH3) with the column densities reported from the observational data. Finally, the CO fractional abundance in the western/eastern cores is ~10-5, significantly lower than the CO fractional abundance of the central core, indicating that the relatively low CO abundance in the western/eastern cores does not lead to a substantial destruction of N2H+. Therefore, the fraction of CO that will evaporate from grain mantles plays an important role in determining the fractional abundance of N2H+, hence the NH3/N2H+ abundance ratio.
In Table 5 we show the values of the NH3 and N2H+ column densities, together with the NH3/N2H+ abundance ratio for the two models that agree with the observed values. In Fig. 9 (bottom right panel) we present the NH3/N2H+ abundance ratio as a function of time for the central core and the western/eastern core obtained during phase II. The NH3/N2H+ abundance ratio observed toward the central core, around ~400–1000, can be reproduced by our chemical model for times t ≃ 104 yr and t = (4.5–5.3) × 105 yr. For the time range t ≃ 104–4.5 × 10⁵ yr, the model produces a higher NH3/N2H+ abundance ratio, ~4000, slightly above the observed values for the central core. However, we adopted the longer age as it is more realistic. For the western/eastern cores, the NH3/N2H+abundance ratio initially shows high values, then it decreases due to desorption effects and finally reaches a constant value ~200 for typical ages of low-mass YSOs, at around t ≃ 105−106 yr. In addition, in Fig. 9 (bottom panel) we also show the temperature as a function of time. For the central core, when the temperature is low, the NH3/N2H+ ratio is high (>104). Around T ≃ 21 K there is a clear drop in the NH3/N2H+ ratio due to desorption effects. As temperature increases, the NH3/N2H+ rises until it reaches a constant value, ~103, at around T ≃ 45 K. For the western and eastern cores the temperature varies from 12 to 25 K, producing small variations in the NH3/N2H+ ratio, and only for times in the range 103–104 yr does the NH3/N2H+ ratio change significantly, similar to the case of the central core. It is worth noting that in the model for the central core, the visual extinction is AV ≃ 40, but typically the visual extinction in hot cores (i.e., embedded in the central core) is around ~100 or even higher. To evaluate the error in the NH3/N2H+ abundance introduced by this difference, we performed an additional model with a higher density, which gives a visual extinction of Av ≃ 100. In this situation, the NH3/N2H+ ratio is affected by a difference of ~3–25%. The abrupt drop in the NH3/N2H+ ratio produced at early ages (t ≃ 5 × 10³ yr) in both the central core and western/eastern cores stems from to desorption effects of some molecules.
Finally, we explored the fractional abundances of other molecular species and compared them with observations when available or made some predictions for future observations. We found that the fractional abundance of CH3CN obtained from the chemical model is in the range ~8 × 10⁻⁸−10-7 at t = (4.5−5.5) × 105 yr , in agreement with the value reported by Zhang et al. (2007), which is in the range (1−4) × 10-8. Additionally, our model predicts a CO abundance of 10-4 indicating that CO is desorbed from grain mantles due to the relatively high temperature (around ~70 K) and the powerful molecular outflows detected in CO (Zhang et al. 2007). We found that molecules like HC3N, H2CO, C2H, and CS should be detectable toward the central core, since their fractional abundances are even higher than the NH3 ones. Concerning the western and eastern cores, the CO fractional abundance, of 10-5, is one order of magnitude lower than that of the central core. For these cores, molecules such as CS, C2H, and CH3CN are quite abundant and would be detectable, but we would not expect to detect any H2CO and HC3N.
In summary, the models that can reproduce the observed values of the NH3/N2H+ abundance ratio toward the central core, as well as in the western and eastern cores, were obtained with a high depletion at the end of phase I. The differences between the central and the western/eastern cores seen in the NH3/N2H+ abundance ratio therefore seem to mainly come from density and temperature effects. In particular, as shown by the chemical modeling of the region, the temperature is a key parameter in determining the NH3/N2H+ abundance ratio, hence the abundance of each molecule. As temperature rises, the fraction of species that will evaporate increases, and consequently the chemistry evolves differently.
6. Discussion
The results obtained from the N2H+ observations, together with NH3 data from the literature (Zhang et al. 2002) show that there are three dense cores associated with the high-mass star-forming region AFGL 5142. The central core, strong in NH3 but almost devoid of N2H+, harbors a cluster of massive stars in their making. On the other hand, the western and eastern cores are stronger in N2H+ than in NH3 emission. In the following section, we discuss the possible reasons for the observed variation in the NH3 / N2H+ abundance ratio among the cores found in AFGL 5142.
The central dense core in AFGL 5142 is actively forming a cluster of massive stars, still in the accretion phase, which displays the typical signposts of star formation (molecular outflow and maser emission). Concerning the western and eastern cores, the relatively high temperature, around 20 K, could be due to the presence of an embedded YSO and/or heating produced by the three molecular outflows associated with the central core, which strongly affects the surrounding dense gas (Zhang et al. 2002, 2007). Thus, the association of the western and eastern cores with an infrared source is not obvious.
The NH3/N2H+ abundance ratio map presented in Fig. 8 shows significant variations with a ratio around ~50–100 toward the western and eastern cores and a ratio up to 1000 toward the central core, due to a significant drop in the N2H+ abundance. The values found for the NH3/N2H+ abundance ratio in the western and eastern cores are similar to those found in previous studies for cores harboring YSOs, for both low- and high-mass star-forming regions (Caselli et al. 2002a; Hotzel et al. 2004; Palau et al. 2007; Friesen et al. 2010). These studies are all consistent with a high ratio (≤ 300) that seems to be associated with starless cores, and a low ratio around 60–90 is found toward the YSOs, suggesting an anticorrelation between the the NH3/N2H+ abundance ratio and the evolutionary stage. Thus, the high NH3/N2H+ ratio toward the central core does not follow the anticorrelation between the NH3/N2H+ ratio and the evolutionary stage of the core as in the studies mentioned above. The noticeable increase in the NH3/N2H+ ratio in the central core suggests a strong differentiation of the N2H+ abundance between the central core and the western/eastern cores. Below we briefly investigate the origin of such a differentiation.
UV radiation effects:
As suggested by Qiu et al. (2008), UV photons from IRAS 05274+334 are not likely to affect the dense gas, and the effects of the UV field from the embedded protostar(s) do not seem to be a major concern in determining the NH3 and N2H+ abundance of the central core, since the high visual extinction, AV ≃ 40 mag or higher, prevents UV photons from penetrating the central core.
Excitation effects:
Even though we considered the effects of opacity and different Tex in the calculation of the column densities, we consider whether the different excitation conditions among the dense cores may be the cause of the lower abundance of N2H+, i.e., the high NH3/N2H+ ratio. The critical density of N2H+ is ~105 cm-3 (Jørgensen 2004a), while the critical density of NH3 is ~104 cm-3 (Ho 1977). From the dust continuum emission, we estimated a density of ~106 cm-3 in the central core. In addition, the density obtained from single-dish observations at 850 μm (Jenness et al. 1995), adopting a core size of ~26′′, is ~4 × 105 cm-3. For these densities the transitions of both NH3 and N2H+ are thermalized, and thus excitation effects do not seem appropriate to explain the N2H+ emission drop in the central core.
On the other hand, the hyperfine structure method in CLASS assumes equal excitation temperature for all the hyperfine components. Daniel et al. (2006) show that this assumption does not hold for the case of high opacities due to radiative processes. Since in AFGL 5142 we derived an opacity of τTOT ≃ 0.3–0.6 for the N2H+ molecule, the problem reported by Daniel et al. (2006) is not likely to affect our result.
Physical and chemical effects:
The high values up to 1000 of the NH3/N2H+ abundance ratio found in the central core of AFGL 5142 can be reproduced by our chemical model for high densities (n ≃ 106 cm-3) and high temperaures (T ≃ 70 K). The chemical modeling performed in Sect. 5 indicates that both density and temperature play an important role in determining the molecular abundance of NH3 and N2H+, hence their ratio. The central core has a higher temperature and density than the western and eastern cores. Thus, a different chemistry can develop due to CO evaporation from the grain mantles. The CO desorption in the central core of AFGL 5142 leads to the destruction of N2H+, so that the NH3/N2H+ abundance ratio increases considerably relative to the value found in the western and eastern cores. This is supported by the fact that 13CO is not frozen out in the central core, whereas it is faintly detected in the western and eastern cores (Zhang et al. 2007). As pointed out in Sect. 5.2.2, Collings et al. (2004) find experimental evidence that the desorption of NH3 from grain mantles takes place at a temperature of ~120 K. Therefore, since in our model we assumed a maximum temperature of 70 K, the high NH3/N2H+ abundance ratio in the central core is mainly a consequence of the destruction of N2H+ by CO rather than an enhancement of NH3 in the gas phase. The disappearance of N2H+ from the gas phase has been reported by several authors, both in low- and high-mass star-forming regions. In the low-mass regime, there are several reports of central N2H+ depletion in Class 0/Class I protostars (e.g., IRAM 04191+1522: Belloche & André 2004; VLA 1623: Di Francesco et al. 2004; L483 mm: Jørgensen 2004a; Barnard 1c: Matthews et al. 2006; BHR 71 IRS1: Chen et al. 2008). Regarding the high-mass regime, Pirogov et al. (2003, 2007) used a single-dish telescope to observed a sample of dense cores associated with massive stars and star clusters containing IRAS point sources, and find that, for most of the sources, there is a decrease in the N2H+ abundance toward the dust column density peak. Furthermore, interferometric observations of N2H+ toward the high-mass star-forming regions IRAS 23033+5951 (Reid & Matthews 2008) also reveal a significant destruction of N2H+. Therefore, the high ratio measured toward the central core of AFGL 5142 seems to come from the rapid destruction of N2H+ when CO is released from grain mantles as seems to be the case for the other regions cited above.
Evolutionary effects:
Although in our chemical model we did not include molecular outflows, they may strongly affect the surrounding dense gas, hence the NH3/N2H+ abundance ratio. As already discussed by Chen et al. (2008), who propose three stages in the interaction between the N2H+ emission and molecular outflows, based on the morphology of the N2H+ dense gas and the jet/outflow emission. Here we suggest a qualitative picture of the evolution of the NH3/N2H+ abundance ratio. First, in starless cores with high densities, most molecules are highly depleted, which favors the formation of NH3 and N2H+. It seems that the CO depletion favors the formation of NH3 against N2H+ in core centers at high densities. Thus, the NH3/N2H+ ratio reaches high values, consistent with the results found in low-mass starless cores (Caselli et al. 2002a; Hotzel et al. 2004; Friesen et al. 2010) as well as for starless cores nearby massive stars, like in the high-mass star-forming regions IRAS 20293+3952 (Palau et al. 2007). The high NH3/N2H+ ratio in starless cores has been reproduced by our chemical model shown in Fig. 9 (left panels). After this phase, once the star has formed, the NH3/N2H+ ratio decreases, as found in the low-mass regime (Caselli et al. 2002a; Hotzel et al. 2004; Friesen et al. 2010), and in YSOs close to the massive star (e.g., IRAS 20293+3952: Palau et al. 2007; IRAS 00117+612: Busquet et al. in prep.). In this situation, CO is less depleted, and N2H+ molecules in the envelope are entrained by the molecular outflow, with the N2H+ emission elongated in the direction of the molecular outflow, as found in IRAS 20293+3952 (Palau et al. 2007) and IRAS 00117+6412 (Palau et al. 2010). Finally, the next evolutionary stage involves the release of CO by powerful molecular outflows, which leads to the destruction of N2H+ and forms large holes in the envelope. Then, the NH3/N2H+ abundance ratio raises considerably, like in the central core of AFGL 5142.
Therefore, either molecular outflows and density/temperature effects seem to be key pieces in the determination of the NH3/N2H+ abundance ratio. To quantify the importance of the temperature in the NH3/N2H+ ratio, we compared the results obtained in AFGl 5142 with the low-mass star-forming region L483. This region seems to be in the same stage of disruption of the envelope as AFGL5142, as the N2H+ shows two clumps on both sides of the YSO (see Jørgensen 2004a; Fuller & Wootten 2000), being then in the later evolutionary stage of the scenario proposed above. However, the NH3 emission in L483 also shows a hole close to the position of the YSO, suggesting that possibly the NH3/N2H+ abundance ratio is much lower than the values found in AFGL 5142, around 400–1000. This seems to indicate that the effects of molecular outflows alone cannot explain the high values derived in AFGL 5142, although this should be modeled to draw a firm conclusion. Thus, the high temperature reached in the central core due to the presence of hot cores seems to affect significantly the NH3/N2H+abundance ratio, indicating that the NH3/N2H+ ratio behaves differently than in low-mass star-forming regions.
7. Conclusions
We used CARMA to observe the 3.2 mm continuum emission and the N2H+ molecular line emission toward the massive protostellar cluster AFGL 5142. The N2H+ dense gas emission, which mimics the morphology of NH3, shows two main cores, one to the west (the western core) of the dust condensation of ~0.08 pc of size and another core to the east (the eastern core), of ~0.09 pc. Interestingly, toward the dust condensation, of M ≃ 23 M⊙, the N2H+ emission drops significantly, whereas the compact NH3 core (i.e., the central core) peaks at this position. The analysis of the N2H+ column density and the NH3/N2H+ abundance ratio indicates a strong differentiation in the N2H+ abundance. While we found low values around ~50–100 of the NH3/N2H+ abundance ratio associated with the western and eastern cores, the NH3/N2H+ ratio rises significantly up to 1000 toward the central core, in which the formation of several massive stars is taking place. We performed a chemical modeling of the region using the time-dependent chemical model UCL_CHEM. The chemical model shows that a high NH3/N2H+ abundance ratio can be reproduced in three different situations: i) in long-lived starless cores; ii) in high density cores with low temperature, ~20–25 K, and containing YSOs; and iii) in high density cores with YSOs and high temperature.
For the central core we found that such a high value of the NH3/N2H+ abundance ratio could be explained with a density of ~106 cm-3 and a maximum temperature of 70 K, producing a substantial destruction of the N2H+ molecule by CO, which is desorbed from the grains mantles due to the high temperature and possibly the molecular outflows associated with the massive YSOs embedded in the central core. On the other hand, to reproduce the observed NH3/N2H+ abundance ratio toward the western and eastern cores, we used a lower density of ~105 cm-3 and temperature (maximum temperature reached is 25 K). These results suggests that, in addition to the core evolution, the physical properties of the core, such as density and temperature, play an important role in determining the NH3/N2H+ abundance ratio. In conclusion, in AFGl 5142 we found that the NH3/N2H+ abundance ratio behaves differently to the low-mass case mainly because of the high temperature reached in hot cores.
Support for CARMA construction was derived from the Gordon and Betty Moore Foundation, the Kenneth T. and Eileen L. Norris Foundation, the Associates of the California Institute of Technology, the states of California, Illinois, and Maryland, and the National Science Foundation. Ongoing CARMA development and operations are supported by the National Science Foundation under a cooperative agreement and by the CARMA partner universities.
Acknowledgments
We thank the anonymous referee for his/her valuable comments and suggestions. G. B. is grateful to Dr. L. Testi and Dr. T. R. Hunter for providing the HCO+ and H13CO+ data. G. B., R. E., A. P., and Á. S.-M. are supported by the Spanish MEC grant AYA2005-08523-C03 and the MICINN grant AYA2008-06189-C03 (co-funded with FEDER funds). A. P. is supported by a JAE-Doc CSIC fellowship co-funded with the European Social Fund. This research has been partially funded by Spanish MICINN under the ESP2007-65475-C02-02 and Consolider-CSD2006-00070 grants. Q. Z. acknowledges the support from the Smithsonian Institute USS Endowment funds.
References
- Belloche, A., & Andé, P. 2004, A&A, 419, L35 [NASA ADS] [CrossRef] [EDP Sciences] [Google Scholar]
- Bergin, E. A., & Langer, W. D. 1997, ApJ, 486, 316 [NASA ADS] [CrossRef] [Google Scholar]
- Beuther, H., & Henning, Th. 2009, A&A, 503, 859 [NASA ADS] [CrossRef] [EDP Sciences] [Google Scholar]
- Busquet, G., Palau, A., Estalella, R., et al. 2009, A&A, 506, 1183 [NASA ADS] [CrossRef] [EDP Sciences] [Google Scholar]
- Carpenter, J. M., Snell, R. L., & Schloerb, F. P. 1990, ApJ, 362, 147 [NASA ADS] [CrossRef] [Google Scholar]
- Caselli, P., Myers, P. C., & Thaddeus, P. 1995, ApJ, 455, L77 [NASA ADS] [CrossRef] [Google Scholar]
- Caselli, P., Benson, P., Myers, P. C., & Tafalla, M. 2002a, ApJ, 572, 238 [NASA ADS] [CrossRef] [Google Scholar]
- Caselli, P., Walmsley, C. M., Zucconi, A., et al. 2002b, ApJ, 565, 344 [NASA ADS] [CrossRef] [Google Scholar]
- Cesaroni, R., Felli, M., & Walmsley, C. M. 1999, A&AS, 136, 333 [NASA ADS] [CrossRef] [EDP Sciences] [Google Scholar]
- Chen, X., Launhardt, R., Bourke, T. L., & Barnes, P. J. 2008, ApJ, 683, 862 [NASA ADS] [CrossRef] [Google Scholar]
- Chen, Y., Yao, Y., Yang, J., Zeng, Q., & Sato, S. 2005, ApJ, 629, 288 [NASA ADS] [CrossRef] [Google Scholar]
- Collings, M. P., Dever, J. W., Fraser, H. J., McCoustra, M. R. S., & Williams, D. A. 2003a, ApJ, 583, 1058 [NASA ADS] [CrossRef] [Google Scholar]
- Collings, M. P., Dever, J. W., Fraser, H. J., & McCoustra, M. R. S. 2003b, Ap&SS, 285, 633 [NASA ADS] [CrossRef] [Google Scholar]
- Collings, M. P., Anderson, M. A., Chen, R., et al. 2004, MNRAS, 354, 1133 [NASA ADS] [CrossRef] [Google Scholar]
- Daniel, F., Cernicharo, J., & Dubernet, M. -L. 2006, ApJ, 648, 461 [NASA ADS] [CrossRef] [Google Scholar]
- Di Francesco, J., André, P., & Myers, P. C. ApJ, 617, 425 [Google Scholar]
- Eiroa, C., Torrelles, J. M., Miranda, L. F., Anglada, G., & Estalella, R. 1994, A&AS, 108, 73 [NASA ADS] [Google Scholar]
- Estalella, R., Mauersberger, R., Torrelles, J. M., et al. 1993, ApJ, 419, 698 [NASA ADS] [CrossRef] [Google Scholar]
- Flower, D. R., Pineau des Forêts, G., & Walmsley, C. M. 2006, A&A, 456, 215 [NASA ADS] [CrossRef] [EDP Sciences] [Google Scholar]
- Fontani, F., Caselli, P., Crapsi, A., et al. 2006, A&A, 460, 709 [NASA ADS] [CrossRef] [EDP Sciences] [Google Scholar]
- Forveille, T., Guilloteau, S., & Lucas, R. 1989, CLASS Manual (Grenoble: IRAM) [Google Scholar]
- Friesen, R. K., Di Francesco, J., Shimajiri, Y., & Takakuwa, S. 2010, ApJ, 708, 1002 [NASA ADS] [CrossRef] [Google Scholar]
- Fuller, G. A., & Wootten, A. 2000, ApJ, 534, 854 [NASA ADS] [CrossRef] [Google Scholar]
- Goddi, C., & Mosacadelli, L. 2006, A&A, 447, 577 [NASA ADS] [CrossRef] [EDP Sciences] [Google Scholar]
- Goddi, C., Moscadelli, L., Sanna, A., Cesaroni, R., & Minier, V. 2007, A&A, 461, 1027 [NASA ADS] [CrossRef] [EDP Sciences] [Google Scholar]
- Harju, J., Walmsley, C. M., & Wouterloot, J. G. A. 1993, A&AS, 98, 51 [Google Scholar]
- Hildebrand, R. H. 1983, QJRAS, 24, 267 [NASA ADS] [Google Scholar]
- Ho, P. T. P. 1977, Ph.D. Thesis, Massachusetts Institute of Technology [Google Scholar]
- Ho, P. T. P., & Townes, C. H. 1983, ARA&A, 21, 239 [NASA ADS] [CrossRef] [Google Scholar]
- Hotzel, S., Harju, J., & Walmsley, C. M. 2004, A&A, 415, 1065 [NASA ADS] [CrossRef] [EDP Sciences] [Google Scholar]
- Hunter, T. R., Testi, L., Taylor, G. B., et al. 1995, A&A, 302, 249 [NASA ADS] [Google Scholar]
- Hunter, T. R., Testi, L., Zhang, Q., & Sridharan, T. K. 1999, AJ, 118, 477 [NASA ADS] [CrossRef] [Google Scholar]
- Jenness, T., Scott, P. F., & Padman, R. 1995, MNRAS, 276, 1024 [NASA ADS] [Google Scholar]
- Jørgensen, J. K. 2004a, A&A, 424, 589 [NASA ADS] [CrossRef] [EDP Sciences] [Google Scholar]
- Jørgensen, J. K., Schöier, F. L., & van Dishoeck, E. F. 2004b, A&A, 416, 603 [NASA ADS] [CrossRef] [EDP Sciences] [Google Scholar]
- Lee, J. -E., Bergin, E. A., & Evans, N. J. II 2004, ApJ, 617, L360 [NASA ADS] [CrossRef] [Google Scholar]
- Matthews, B. C., Hogerheijde, M. R., Jørgensen, J. K., & Bergin, E. A. 2006, ApJ, 652, 1374 [NASA ADS] [CrossRef] [Google Scholar]
- Palau, A., Estalella, R., Girart, J. M., et al. 2007, A&A, 465, 219 [NASA ADS] [CrossRef] [EDP Sciences] [Google Scholar]
- Palau, A., Sánchez-Monge, Á., Busquet, G., et al. 2010, A&A, 510, A5 [NASA ADS] [CrossRef] [EDP Sciences] [Google Scholar]
- Pirogov, L., Zinchenko, I., Caselli, P., Johansson, L. E. B., & Myers, P. C. 2003, A&A, 405, 639 [NASA ADS] [CrossRef] [EDP Sciences] [Google Scholar]
- Pirogov, L., Zinchenko, I., Caselli, P., & Johansson, L. E. B. 2007, A&A, 461, 523 [NASA ADS] [CrossRef] [EDP Sciences] [Google Scholar]
- Qiu, K., Zhang, Q., Megeath, S. T., et al. 2008, ApJ, 685, 1005 [NASA ADS] [CrossRef] [Google Scholar]
- Rawlings, J. M. C., Harquist, T. W., Menten, K. M., & Williams, D. A. 1992, MNRAS, 255, 471 [NASA ADS] [CrossRef] [Google Scholar]
- Reid, M. A., & Matthews, B. C. 2008, ApJ, 675, 1343 [NASA ADS] [CrossRef] [Google Scholar]
- Sault, R. J., Teuben, P. J., & Wright, M. C. H. 1995, is Astronomical Data Analysis Software and Systems IV, ed. R. A. Shaw, H. E. Payne, & J. J. E. Hayes (San Francisco: ASP), ASP Conf. Ser. 77, 433 [Google Scholar]
- Snell, R. L., Huang, Y.-L., Dickman, R. L., & Claussen, M. J. 1988, ApJ, 325, 853 [NASA ADS] [CrossRef] [Google Scholar]
- Sofia, U. J., & Meyer, D. M. 2001, ApJ, 554, L221 [NASA ADS] [CrossRef] [Google Scholar]
- Tafalla, M., Myers, P. C., Caselli, P., & Walmsley, C. M. 2004, A&A, 416, 191 [NASA ADS] [CrossRef] [EDP Sciences] [Google Scholar]
- Torrelles, J. M., Gómez, J. F., Anglada, G., et al. 1992, ApJ, 392, 616 [NASA ADS] [CrossRef] [Google Scholar]
- Verdes-Montenegro, L., Torrelles, J. M., Rodríguez, L. F., et al. 1989, ApJ, 346, 193 [NASA ADS] [CrossRef] [Google Scholar]
- Viti, S., & Williams, D. A. 1999, MNRAS, 310, 517 [NASA ADS] [CrossRef] [Google Scholar]
- Viti, S., Caselli, P., Hartquist, T. W., & Williams, D. A. 2001, A&A, 370, 1017 [NASA ADS] [CrossRef] [EDP Sciences] [Google Scholar]
- Viti, S., Collings, M. P., Dever, J. W., McCoustra, M. R. S., & Williams, D. A. 2004, MNRAS, 354, 1141 [NASA ADS] [CrossRef] [Google Scholar]
- Woodall, J., Agúndez, M., Markwick-Kemper, A. J., & Millar, T. J. 2007, A&A, 466, 1197 [NASA ADS] [CrossRef] [EDP Sciences] [Google Scholar]
- Zhang, Q., Hunter, T. R., Sridharan, T. K., & Ho, P.T.P. 2002, ApJ, 566, 982 [NASA ADS] [CrossRef] [Google Scholar]
- Zhang, Q., Hunter, T. R., Beuther, H., et al. 2007, ApJ, 658, 1152 [NASA ADS] [CrossRef] [Google Scholar]
- Zinchenko, I., Caselli, P., & Pirogov, L. 2009, MNRAS, 395, 2234 [NASA ADS] [CrossRef] [Google Scholar]
All Tables
Parameters of the hyperfine fits to the N2H+ (1–0) line for the central position of each core.
All Figures
|
Fig. 1 3.2 mm continuum emission toward AFGL 5142. Contour levels range from 3 to 60σ in steps of 3σ, where σ is the rms of the map, 0.7 mJy beam-1. The synthesized beam, shown in the bottom right corner, is |
| In the text | |
|
Fig. 2 N2H+ (1–0) spectra toward three positions of AFGL 5142. The three positions labeled on each panel are, from top to bottom, CC (NH3 peak or central core), EC (peak of the eastern core), and WC (peak of the western core, see Fig. 4). |
| In the text | |
|
Fig. 3 Top panel: N2H+ (1–0) channel maps for the hyperfine F1F = 01 → 12 (isolated line) toward AFGL 5142. Contour levels are −2, 2, 4, 6, 8, 10, and 12 times the rms noise of the maps, 0.055 Jy beam-1. Bottom panel: N2H+ (1–0) channel maps for the hyperfine F1F = 21 → 11, 23 → 12, 22 → 11, and F1F = 11 → 10, 12 → 12, and 10 → 11. Contour levels are −4, −2, 2, 4, 6, 8, 10, 12, and 14 times the rms of the map, 0.055 Jy beam-1. In all panels the cross marks the position of the 3.2 mm continuum source. The synthesized beam is shown in the bottom left corner. Velocities referres to the F1F = 01 → 12 hyperfine with the systemic velocity vLSR= −3 km s-1. |
| In the text | |
|
Fig. 4 a) N2H+ zero-order moment integrated for all the hyperfine components of the (1–0) transition. Contours start at 3%, increasing in steps of 10% of the peak intensity, 6.01 Jy beam-1km s-1. b) NH3 (1, 1) zero-order moment (Zhang et al. 2002). Contours start at 10%, increasing in steps of 10% of the peak intensity, 0.202 Jy beam-1km s-1. The synthesized beams, |
| In the text | |
|
Fig. 5 a) First-order moment map (velocity) for the hyperfine F1F = 01 → 12 line of N2H+ (1–0) toward AFGL 5142 (color scale); b) second-order moment map (velocity dispersion) for the hyperfine F1F = 01 → 12 line of N2H+ (1-0) (color scale). In both figures, black contours are the same as in Fig. 4a, showing the N2H+ (1–0) emission, with contours starting at 3%, and increasing in steps of 10% of the peak intensity. Color scales are in km s-1. The synthesized beam is shown in the bottom right corner of the image. The black cross marks the position of the 3.2 mm source reported in this work. Blue and red lines represent the direction of outflows A, B, and C (Zhang et al. 2007), and the black dashed line in the top panel indicates the position-velocity cuts (see Fig. 6). The second-order moment gives the velocity dispersion and must be multiplied by the factor 2 |
| In the text | |
|
Fig. 6 N2H+p − v plot for the F1F = 01 → 12 hyperfine at a) PA = 90° (along the eastern and western cores). Channel maps have been convolved with a beam 6′′ × 2′′ with PA perpendicular to the direction of the cut. Contours start at 10%, increasing in steps of 5% of the peak emission, 0.408 Jy beam-1. The central position corresponds to the 3.2 mm source. Positive offsets are toward the east; b) PA = 15°. Channel maps have been convolved with a beam 2′′ × 2′′. Contours start at 10%, increasing in steps of 10% of the peak emission, 0.601 Jy beam-1. The central position is taken at the peak position of the western core, which is Δ x = −6.5′′, Δ y = −3′′ offset from the phase center. Positive offsets are toward the northeast. c) PA = 140°. Contours start at 20%, and increase in steps of 10% of the peak emission, 0.376 Jy beam-1. Positive offsets are toward the southeast. The central position corresponds to Δ x = 3.9′′, Δ y = −0.59′′ offset from the phase center. In all panels, the vertical dashed line indicates the systemic velocity, vLSR= −3 km s-1. |
| In the text | |
|
Fig. 7 a) N2H+ column density map. b) NH3 column density map. c) H13CO+ column density map overlaid with the 3.2 mm continuum emission (contours). In all panels scale units are cm-2. The synthesized beam, ~4′′, is shown in the bottom right corner of each panel. The white cross marks the position of the 3.2 mm peak. |
| In the text | |
|
Fig. 8 Color scale: N(NH3)/N(N2H+) abundance ratio map overlaid with the N2H+ emission (black contour), with contours starting at 3%, and increasing in steps of 20% of the peak intensity. The synthesized beam, ~4′′, is shown in the bottom right corner. The white cross marks the position of the 3.2 mm peak. |
| In the text | |
|
Fig. 9 Left: fractional abundances with respect to hydrogen as a function of time during phase I for the central core (top panel) and the western/eastern cores (middle panel). The NH3/N2H+ abundance ratio for both the central core and the western/eastern core are also shown in the bottom panel. Right: same as left panels but for phase II calculation. The y-axis ranges according to the model. In the bottom right panel we also show the temperature as a function of time, indicated by the thin lines. The two shaded areas mark the range of values (400–1000 for the central core and 50–200 for the western/eastern cores) of the NH3/N2H+ abundance ratio estimated from the observational data. |
| In the text | |
Current usage metrics show cumulative count of Article Views (full-text article views including HTML views, PDF and ePub downloads, according to the available data) and Abstracts Views on Vision4Press platform.
Data correspond to usage on the plateform after 2015. The current usage metrics is available 48-96 hours after online publication and is updated daily on week days.
Initial download of the metrics may take a while.